. 2020 Jul 22;11(1):25-41.e9.
doi: 10.1016/j.cels.2020.06.004. Epub 2020 Jul 6.

A Single-Cell Transcriptomics CRISPR-Activation Screen Identifies Epigenetic Regulators of the Zygotic Genome Activation Program

Affiliations

A Single-Cell Transcriptomics CRISPR-Activation Screen Identifies Epigenetic Regulators of the Zygotic Genome Activation Program

Celia Alda-Catalinas et al. Cell Syst. .

Abstract

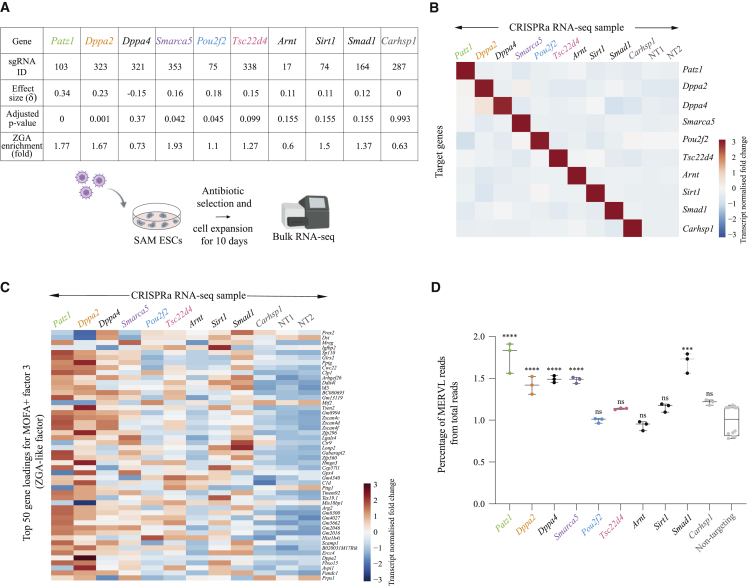
Zygotic genome activation (ZGA) is an essential transcriptional event in embryonic development that coincides with extensive epigenetic reprogramming. Complex manipulation techniques and maternal stores of proteins preclude large-scale functional screens for ZGA regulators within early embryos. Here, we combined pooled CRISPR activation (CRISPRa) with single-cell transcriptomics to identify regulators of ZGA-like transcription in mouse embryonic stem cells, which serve as a tractable, in vitro proxy of early mouse embryos. Using multi-omics factor analysis (MOFA+) applied to ∼200,000 single-cell transcriptomes comprising 230 CRISPRa perturbations, we characterized molecular signatures of ZGA and uncovered 24 factors that promote a ZGA-like response. Follow-up assays validated top screen hits, including the DNA-binding protein Dppa2, the chromatin remodeler Smarca5, and the transcription factor Patz1, and functional experiments revealed that Smarca5's regulation of ZGA-like transcription is dependent on Dppa2. Together, our single-cell transcriptomic profiling of CRISPRa-perturbed cells provides both system-level and molecular insights into the mechanisms that orchestrate ZGA.

Keywords: CRISPRa; Dppa2; MOFA; Patz1; Smarca5; ZGA; scRNA-seq; screen; single cell; zygotic genome activation.


Conflict of interest statement

Declaration of Interests W.R. is a consultant and shareholder of Cambridge Epigenetix. All other authors declare no competing interests.

Figures

None
Graphical abstract
Figure 1
Figure 1
A CRISPRa Screen for ZGA-like Regulators at Single-Cell Resolution (A) Schematic overview of the single-cell CRISPRa screen, highlighting the selection of candidates, lentiviral transduction strategy, and generation of 10x Genomics 3′ scRNA-seq libraries and barcoded sgRNA amplicon libraries. (B) Dot-plot showing normalized expression levels (log2 reads per million; RPM) of the screening candidates in oocytes, zygotes, two-cell, and four-cell embryos. Data analyzed from Xue et al. (2013). (C) Number of cells expressing a unique sgRNA (blue), two sgRNAs (dark gray), more than two sgRNAs (light gray), or none (pink) in each of the three transduction replicates. The number of cells assigned to a unique sgRNA in each replicate is displayed. (D) Genes ranked by the loadings of PC1 (left) and PC2 (right), highlighting in red previously know ZGA genes (as described in Table S2; see also Table S3 for gene loading values). (E) PC analysis displaying a scatterplot of the first two PCs (PC1 versus PC2) with cells colored by the expression of the ZGA markers Zscan4c, Zscan4d, Gm8300, and Tmem92. Marginal distributions of PC1 and PC2 values are displayed as rug plots along the respective axis. (F) Box-whisker plots showing normalized expression levels (log2 reads per million; RPM) for the top 50 loadings for PC1 (gray) and PC2 (light blue) during preimplantation development (data analyzed from Deng et al., 2014) (see Table S3 for gene loadings). As expected in serum-grown ESCs, PC1 loadings peak at blastocyst stages whereas PC2 loadings peak at mid-to-late two-cell embryo stages, identifying this component as ZGA-like.
Figure 2
Figure 2
Identification of a ZGA-like Transcriptional Signature Using MOFA+ (A) Schematic of the joint analysis of coding gene and repeat element expression using multi-omics factor analysis (MOFA+). Data matrices of dimension features (genes or repeat elements) in cells grouped by sgRNA expression are treated as distinct views in the model and decomposed into the product of weights (or loadings) and factors. Factor 3 in the trained model, interpreted as a ZGA-like factor, is highlighted in green. (B) Coding genes ranked by their loadings of MOFA+ factor 3, highlighting in red previously known ZGA genes (as described in Table S2; see also Table S4 for gene loading values), indicating that this factor captures a ZGA-like response, and thus, identifying it as a MOFA+ ZGA-like factor. (C) Box-whisker plots showing normalized expression levels (log2 reads per million; RPM) for the top 50 gene loadings of MOFA+ factor 3 (ZGA-like factor) during preimplantation development (data analyzed from Deng et al. (2014) (see Table S4 for gene loadings). (D) Repeat element families ranked by their loadings of MOFA+ factor 3 (ZGA-like factor). (E) Violin plots for MOFA+ factor values 1–3 trained on scRNA-seq data for zygotes, early two-cell, mid two-cell, late two-cell, and four-cell stage embryos (data analyzed from Deng et al., 2014).
Figure 3
Figure 3
Identification of Activators of a ZGA-like Transcriptional Signature (A) Screen hit rank shown as the effect size (regression coefficient value δ) and the adjusted t test p value (Benjamini-Hochberg adjustment). Target genes with sgRNA(s) at FDR <10% (25 sgRNAs) were considered hits, and their names are displayed (see Table S1 for the full ranking), with Patz1 (green), Dppa2 (orange), Smarca5 (purple), Pou2f2 (blue), and Tsc22d4 (pink) sgRNA hits highlighted. (B) Box-whisker plots showing log fold change expression for the top 50 genes associated with MOFA+ factor 3 (ZGA-like factor, ranked absolute loadings) in cells expressing the 25 sgRNA hits and cells expressing other targeting sgRNAs, compared to cells expressing non-targeting sgRNA controls. Expression is quantified in normalized counts (∗∗∗∗p value = 3.7 × 10−10, Mann-Whitney two-tailed test). (C) Box-whisker plots showing log fold change of MERVL normalized counts in cells expressing the 25 sgRNA hits and cells expressing other targeting sgRNAs, compared to cells expressing non-targeting sgRNA controls (∗∗∗∗p value = 8.2 × 10−7, Mann-Whitney two-tailed test). (D) Cumulative rank of the number of ZGA signature genes (as described in Table S2) upregulated by each sgRNA hit compared to non-targeting sgRNA controls, considering the top 400 genes ranked by statistical significance of differential gene expression test (generalized linear model likelihood ratio test as implemented in EdgeR). In gray is shown an empirical background distribution estimated based on differential gene expression between cells with non-targeting sgRNA controls, displaying plus and minus one standard deviation around the mean of ZGA signature genes recovered by non-targeting sgRNAs. The names of the target genes for sgRNAs identified as hits in A) are depicted, with those for which the differential gene expression rank overlaps with the non-targeting control background shown in gray. Patz1 (green), Dppa2 (orange), Smarca5 (purple), Pou2f2 (blue), and Tsc22d4 (pink) sgRNA hits are highlighted.
Figure 4
Figure 4
Validation of Screen Hits by Arrayed CRISPRa (A) Top: MOFA+ parameters (effect size and adjusted p value) and ZGA gene enrichment (based on analysis described in Figure 3D) for the screen hits Patz1, Dppa2, Smarca5, Pou2f2, and Tsc22d4, the candidates Dppa4, Arnt, Sirt1, and Smad1, and the negative control candidate Carhsp1. Bottom: schematic representation of an arrayed CRISPRa validation approach followed by bulk polyA-capture RNA-seq to confirm the screen hits Patz1, Dppa2, Smarca5, Pou2f2, and Tsc22d4 and to interrogate the candidates Dppa4, Arnt, Sirt1, and Smad1, using Carhsp1 as a negative control. (B) Heatmap showing normalized gene expression, scaled per gene, of the target genes interrogated by arrayed CRISPRa and bulk RNA-seq. Controls are two different non-targeting sgRNAs (NT1 and NT2). (C) Heatmap showing normalized gene expression, scaled per gene, of the top 50 gene loadings for MOFA+ factor 3 (ZGA-like factor) in bulk RNA-seq libraries for Patz1, Dppa2, Dppa4, Smarca5, Pou2f2, Tsc22d4, Arnt, Sirt1, Smad1, and Carhsp1 CRISPRa. Controls are two different non-targeting sgRNAs (NT1 and NT2). (D) Box-whisker plots showing expression of the MERVL repeat family in percentage of total reads measured by bulk RNA-seq after CRISPRa of Patz1 (green), Dppa2 (orange), Dppa4 (black), Smarca5 (purple), Pou2f2 (blue), Tsc22d4 (pink), Arnt (black), Sirt1 (black), Smad1 (black), and Carhsp1 (gray) and in two non-targeting sgRNA controls (gray). Each dot represents a biological replicate. Statistically significant differences to controls are reported as ∗∗∗∗p value < 0.0001, ∗∗∗p value < 0.001, ns (non-significant): p value > 0.05; Mann-Whitney two-tailed test.
Figure 5
Figure 5
Patz1, Dppa2, and Smarca5 Are Potent Inducers of ZGA-like Transcription (A) Schematic representation of a complementary validation approach for Patz1, Dppa2, and Smarca5, using Carhsp1 as a negative control, consisting of cDNA-eGFP transient transfections into mouse ESCs followed by eGFP+ fluorescence-activated cell sorting (FACS) and bulk polyA-capture RNA-seq. (B) Heatmap showing normalized gene expression, scaled per gene, of Patz1, Dppa2, Smarca5, and Carhsp1 in bulk RNA-seq libraries after cDNA overexpression of these genes, compared with an eGFP-only transfection. (C) Heatmap showing normalized gene expression, scaled per gene, of the top 50 gene loadings for MOFA+ factor 3 (ZGA-like factor) in bulk RNA-seq libraries for Patz1, Dppa2, Smarca5, and Carhsp1 cDNA overexpression. The control is a eGFP-only transfection. (D) Box-whisker plots showing expression of the MERVL repeat family in percentage of total reads measured by bulk RNA-seq after cDNA overexpression of Patz1 (green), Dppa2 (orange), Smarca5 (purple), and Carhsp1 (gray). The control is an eGFP-only transfection (gray). Each dot represents a biological replicate. Statistically significant differences to eGFP-only control are reported as ∗∗∗∗p value < 0.0001, ∗∗∗p value < 0.001, ns (non-significant): p value > 0.05; Mann-Whitney two-tailed test. (E) Box-whisker plots showing normalized expression levels (log2 reads per million; RPM) of differentially upregulated genes by both arrayed CRISPRa and cDNA overexpression of Patz1 (green), Dppa2 (orange), and Smarca5 (purple) as well as a random set of expressed genes (gray) during preimplantation development (data analyzed from Deng et al., 2014). Differential gene expression was calculated with EdgeR (FDR < 0.05). The number of analyzed genes in each case is depicted in brackets. (F) Representative single optical slices of zygotes immunostained for PATZ1, DPPA2, and SMARCA5, showing single channels and composites with DAPI. Scale bars represent 25 μm.
Figure 6
Figure 6
Smarca5 Requires Dppa2 to Induce ZGA-like Transcription (A) Normalized expression levels (log2 reads per kilobase per million; RPKM) of Dppa2 (orange, triangles) and Smarca5 (purple, squares) in oocytes and preimplantation development (data analyzed from Xue et al., 2013). Data are shown as mean plus standard deviation of biological replicates. (B) Representative single optical slices of zygotes (top row) and two-cell stage embryos (bottom row) immunostained for DPPA2 and SMARCA5, showing single channels and composites. Scale bars represent 20 μm. (C) Box-plots showing Pearson correlation coefficients calculated for co-localization of DPPA2 and SMARCA5 in the pronuclei of 10 zygotes and in the nuclei of 10 two-cell stage embryos. Co-localization values in the two pronuclei in zygotes and nuclei of each blastomere in two-cell embryos were measured separately. DPPA2 and SMARCA5 co-localize in two-cell embryos but not in zygotes (∗∗∗∗p value < 0.0001, Mann-Whitney two-tailed test). (D) Heatmap showing normalized expression, scaled per gene, of downregulated ZGA genes in Smarca5 KO mouse ESCs compared to WT (EdgeR, FDR < 0.05), in WT ESCs, Smarca5 KO ESCs, and Smarca5 KO ESCs expressing a Smarca5 WT protein or a Smarca5 catalytically dead mutant protein (Mut) (data analyzed from Barisic et al., 2019). (E and F) Analysis of relative expression levels of ZGA-like transcripts by quantitative reverse transcription PCR in (E) WT and Smarca5 KO mouse ESCs after 48-h transient transfection of eGFP or Dppa2-eGFP and (F) WT and Dppa2 KO mouse ESCs after 48-h transient transfection of eGFP or Smarca5-eGFP. eGFP+ cells were FACS-sorted before gene expression analysis. Relative expression levels are normalized to WT cells transfected with eGFP and sorted for eGFP+. Data are shown as mean plus standard deviation of three biological replicates. Statistically significant differences to WT GFP+ control are reported (∗∗p value < 0.01, ∗∗∗p value < 0.001, ∗∗∗∗p value < 0.0001; absence of stars (non-significant): p value > 0.05; homoscedastic two-tailed t test).
None

References

    1. Adamson B., Norman T.M., Jost M., Cho M.Y., Nuñez J.K., Chen Y., Villalta J.E., Gilbert L.A., Horlbeck M.A., Hein M.Y. A multiplexed single-cell CRISPR screening platform enables systematic dissection of the unfolded protein response. Cell. 2016;167:1867–1882.e21. - PMC - PubMed
    1. Akiyama T., Xin L., Oda M., Sharov A.A., Amano M., Piao Y., Cadet J.S., Dudekula D.B., Qian Y., Wang W. Transient bursts of Zscan4 expression are accompanied by the rapid derepression of heterochromatin in mouse embryonic stem cells. DNA Res. 2015;22:307–318. - PMC - PubMed
    1. Argelaguet R., Arnol D., Bredikhin D., Deloro Y., Velten B., Marioni J.C., Stegle O. MOFA+: a statistical framework for comprehensive integration of multi-modal single-cell data. Genome Biol. 2020;21:111. - PMC - PubMed
    1. Argelaguet R., Clark S.J., Mohammed H., Stapel L.C., Krueger C., Kapourani C.A., Imaz-Rosshandler I., Lohoff T., Xiang Y., Hanna C.W. Multi-omics profiling of mouse gastrulation at single-cell resolution. Nature. 2019;576:487–491. - PMC - PubMed
    1. Argelaguet R., Velten B., Arnol D., Dietrich S., Zenz T., Marioni J.C., Buettner F., Huber W., Stegle O. Multi-omics factor analysis- a framework for unsupervised integration of multi-omics data sets. Mol. Syst. Biol. 2018;14 - PMC - PubMed

Publication types

MeSH terms