. 2020 Jul 21;117(29):17359-17368.
doi: 10.1073/pnas.2001560117. Epub 2020 Jul 7.

Basal ganglia beta oscillations during sleep underlie Parkinsonian insomnia

Affiliations

Basal ganglia beta oscillations during sleep underlie Parkinsonian insomnia

Aviv D Mizrahi-Kliger et al. Proc Natl Acad Sci U S A. .

Abstract

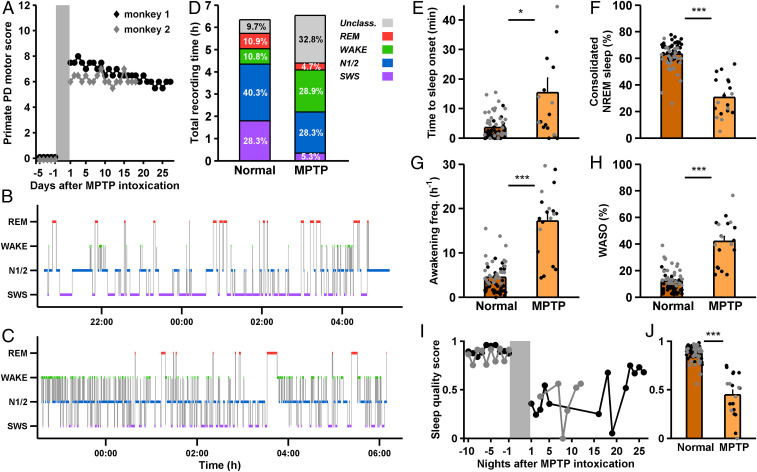
Sleep disorders are among the most debilitating comorbidities of Parkinson's disease (PD) and affect the majority of patients. Of these, the most common is insomnia, the difficulty to initiate and maintain sleep. The degree of insomnia correlates with PD severity and it responds to treatments that decrease pathological basal ganglia (BG) beta oscillations (10-17 Hz in primates), suggesting that beta activity in the BG may contribute to insomnia. We used multiple electrodes to record BG spiking and field potentials during normal sleep and in 1-methyl-4-phenyl-1,2,3,6-tetrahydropyridine (MPTP)-induced Parkinsonism in nonhuman primates. MPTP intoxication resulted in severe insomnia with delayed sleep onset, sleep fragmentation, and increased wakefulness. Insomnia was accompanied by the onset of nonrapid eye movement (NREM) sleep beta oscillations that were synchronized across the BG and cerebral cortex. The BG beta oscillatory activity was associated with a decrease in slow oscillations (0.1-2 Hz) throughout the cortex, and spontaneous awakenings were preceded by an increase in BG beta activity and cortico-BG beta coherence. Finally, the increase in beta oscillations in the basal ganglia during sleep paralleled decreased NREM sleep, increased wakefulness, and more frequent awakenings. These results identify NREM sleep beta oscillation in the BG as a neural correlate of PD insomnia and suggest a mechanism by which this disorder could emerge.

Keywords: Parkinson’s disease; beta oscillations; insomnia; sleep.


Conflict of interest statement

The authors declare no competing interest.

Figures

Fig. 1.
Fig. 1.
Parkinsonism introduces severe insomnia. (A) Primate PD motor score (range: 0–12. Bradykinesia, tremor, rigidity, and postural deficits were each assigned a score from 0 to 3, where 3 represents severe symptoms) for both monkeys, normal state (mean, 0.00 ± 0.00, n = 38 and n = 29 d for monkey 1 and 2, respectively) vs. after MPTP intoxication (monkey 1: mean ± SEM, 6.67 ± 0.13, n = 27 d. Monkey 2: mean, 6.19 ± 0.09, n = 18 d. P = 2.11 × 10⁻¹⁴ and P = 4.88 × 10⁻¹¹, respectively, Mann–Whitney U test). (B and C) All-night hypnograms for exemplary normal (B) and MPTP (C) nights, monkey 1. (D) Relative proportions of different sleep stages (unclass., unclassified, corresponding to transitional states), out of the total recording time, over all nights and both monkeys. Color scale as in B and C (Normal monkey, n = 38 recording nights for monkey 1 and n = 29 for monkey 2. MPTP monkey, n = 13 recording nights for monkey 1 and n = 6 for monkey 2. Normal vs. MPTP, change in SWS, P = 6.71 × 10⁻¹⁰, N1/2, P = 0.030, wakefulness, P = 8.29 × 10⁻⁸; REM, P = 1.50 × 10⁻⁴; Unclassified, P = 7.60 × 10⁻⁹; Mann–Whitney U test). (E) Time to consolidated sleep onset (first sleep bout of length > 40 s), normal vs. MPTP, for both monkeys. *P < 0.05, Mann-Whitney U test. Each point represents one night, error bars represent SEM: black, monkey 1; gray, monkey 2. A single point in the MPTP bar (at 86.17 min) is not included in this plot. (F) Percentage of consolidated NREM sleep out of all classified epochs. normal vs. MPTP. ***P < 0.0001, Mann–Whitney U test. (G) Awakening frequency, normal vs. MPTP. ***P < 0.0001, Mann–Whitney U test. (H) WASO, in % of all classified epochs, normal vs. MPTP. ***P < 0.0001, Mann–Whitney U test. (I) Sleep quality score for the last normal recording days and MPTP recording days, for both monkeys. Sleep quality improved in the last five recording days relative to the first 5 d (0.67 vs. 0.37, P = 0.016, but never reached preintoxication levels, 0.67 vs. 0.88, P = 6.67 × 10⁻⁴, Mann–Whitney U test). (J) Average sleep quality score, normal vs. MPTP, for both monkeys. ***P < 0.0001, Mann–Whitney U test. Unless otherwise noted, the data are presented as averages in this and the subsequent figures.
Fig. 2.
Fig. 2.
Parkinsonism is associated with an increase in beta oscillations in the BG during NREM sleep. (A and B) Typical field potential (FP, Upper) and concurrent spiking (Lower) recordings from a GPi electrode during NREM sleep in the normal monkey (A) and after MPTP intoxication (B). Horizontal bar, 0.5 s. Vertical bars, 50 µV. Colored are segments of spiking slow oscillation (A, dark blue) and beta oscillation (B, light blue), and their concurrent FP segments. (C) FP power spectra for GPe (red), GPi (blue), and STN (green) during NREM sleep, normal (dark traces) vs. MPTP (light traces). Shading represents SEM. (Inset) The proportion of FP recording sites exhibiting beta activity, averaged across four different thresholds (Methods). For the entire figure, n = 305, 172, and 94 sites recorded during NREM sleep (FP and spiking) for the normal GPe, GPi, and STN, respectively (of which n = 161, 61, and 63 were obtained from monkey 1, and the rest from monkey 2). n = 211, 51, and 43 for the GPe, GPi, and STN, respectively, during MPTP intoxication (of which n = 154, 15, and 20 were obtained from monkey 1 and the rest from monkey 2). (D) Spiking power spectra for GPe, GPi, and STN, normal vs. MPTP. Shading and Inset as in C. (E) NREM sleep and wakefulness FP beta power (normalized by subtraction of the average power in the flanking frequency ranges), normal (dark boxplots) vs. MPTP (light boxplots), GPe, GPi, and STN, ***P < 0.0001, Mann–Whitney U test. Black line represents the median; boxes represent the 25–75 percentiles, and whiskers denote the 10 and 90 percentiles. n = 271, 160, and 79 sites recorded during wakefulness (FP and spiking) for the normal GPe, GPi, and STN, respectively (of which n = 129, 50, and 53 were obtained from monkey 1 and the rest from monkey 2). n = 209, 50, and 44 for the GPe, GPi, and STN, respectively, during wakefulness following MPTP intoxication (of which n = 152, 13, and 20 were obtained from monkey 1 and the rest from monkey 2). For the GPe and STN, MPTP wakefulness vs. NREM, nonsignificant. (F) NREM sleep and wakefulness spiking beta power, normal vs. MPTP, GPe, GPi, and STN, *P < 0.05, ***P < 0.0001, Mann–Whitney U test. For the GPe, MPTP wakefulness vs. NREM, nonsignificant. (G) NREM sleep FP beta episode probability, beta episode duration (Upper Inset) and beta episode frequency (Lower Inset), normal vs. MPTP, GPe, GPi, and STN, ***P < 0.0001, Mann–Whitney U test. (H) NREM sleep spiking beta episode probability, beta episode duration, and beta episode frequency, normal vs. MPTP, GPe, GPi, and STN, **P < 0.005, ***P < 0.0001, n.s., nonsignificant, Mann–Whitney U test.
Fig. 3.
Fig. 3.
Parkinsonism is associated with an increase in beta oscillations in the cerebral cortex during NREM sleep. (A) Examples of central EEG (C1) activity during normal NREM sleep (Upper, notice the predominant slow oscillatory activity) and during Parkinsonian NREM sleep (Lower, where beta activity is more prominent). Horizontal bar, 0.5 s. Vertical bars, 50 µV. (B) Power spectra of scalp EEG (average over frontal, central and occipital electrodes ipsilateral to BG electrodes) during NREM sleep and wakefulness, normal vs. MPTP nights. Pale shading represents SEM. n = 67 and 19 nights for the normal and MPTP recordings, respectively. (C) NREM sleep and wakefulness EEG beta power (normalized as previously) for both conditions and sleep stages, **P < 0.005, ***P < 0.0001, Mann–Whitney U test. During MPTP, NREM beta power was not significantly different from the wakefulness beta power, Wilcoxon signed rank test. (D) NREM sleep EEG beta episode probability, beta episode duration (Upper Inset), and beta episode frequency (Lower Inset), normal vs. MPTP, ***P < 0.0001, Mann–Whitney U test.
Fig. 4.
Fig. 4.
Beta oscillations during NREM sleep are coherent within and between the BG and cerebral cortex. (A and B) Examples of field potential (FP, A) and spiking activity (B) recorded simultaneously by two microelectrodes in the GPi during Parkinsonian NREM sleep. Horizontal bar, 0.5 s (A) or 0.25 s (B). Vertical bars, 50 µV. Spiking traces represent 1 s. (C and D) Coherence of simultaneously recorded FP (C) and spiking (D) in the BG during NREM sleep in the Parkinsonian monkey. Dashed lines represent the same recording sites, with time-shifted FP/spiking traces. Pale shading represents SEM. For FP and spiking coherence, n = 278, 85, and 26 paired recordings for the GPe, GPi, and STN, respectively. (Inset) Area under the curve (AUC) evaluated for the beta range (10–17 Hz), the baseline being the average 20–40 Hz range coherence, nonshifted (left boxes) vs. shifted data (right boxes). ***P < 0.0001, Mann–Whitney U test. (E) FP-spiking coherence for the MPTP data vs. shifted data, conventions and Inset as in C and D. For the GPe, GPi and STN, respectively, n = 211, 51, and 43 recordings. (F) Coherence between ipsilateral EEG electrodes during Parkinsonian NREM sleep, relative to shifted data (n = 19 nights). Inset, AUC as before. **P < 0.005, ***P < 0.0001, Mann-Whitney U test. (G and H) Coherence between averaged ipsilateral EEG and BG FP (G) or spiking (H) activity during Parkinsonian NREM sleep. Dashed lines represent the coherence spectra between shifted data. (Insets) AUC for the nonshifted and shifted data, as previously.
Fig. 5.
Fig. 5.
The increase in beta activity in the BG is correlated with a decrease in BG and cortical slow oscillatory activity. (A) Power spectra of firing rates recorded during NREM sleep in the normal (dark traces) and MPTP monkey (light traces), GPe (red), GPi (blue), and STN (green). Error bars represent SEM. Normal, n = 305, 172, and 94 neurons for GPe, GPi, and STN, respectively. MPTP, n = 211, 51, and 43 for GPe, GPi, and STN, respectively. (B) Average NREM sleep firing rate 0.1–1 Hz relative power, for each BG nucleus, across recording nights, normal vs. MPTP monkey. *P < 0.05, ***P < 0.0001, Mann–Whitney U test. (C) Bilateral frontal, central and occipital EEG power spectra in the normal (dark trace, n = 67 nights) and MPTP monkey (light trace, n = 19 nights). (D) Average EEG slow oscillation (SO, 0.1–2 Hz) relative power during NREM sleep, across recording nights, normal vs. MPTP monkey. *P < 0.05, Mann–Whitney U test. (E and F) Firing rate slow oscillation power for the different nuclei of the BG, divided into four quartiles by the degree of FP (E) or spiking (F) beta power recorded by the same electrode in the same neuronal site. As beta activity became stronger, firing rate slow oscillatory activity decreased. Colored traces represent recording sites from the GPe (red), GPi (blue), and STN (green). Purple bars represent the average across all recording nights from all BG nuclei. Error bars represent SEM. (G) Example scatter plots depicting the correlation between BG FP beta power and EEG SO power during NREM sleep following MPTP intoxication, GPe (red), GPi (blue), and STN (green). Each point represents one 10-s NREM sleep epoch. (H) Average Pearson’s correlation coefficients between BG FP beta power and EEG SO activity, for all of the sites and units exhibiting a significant correlation with the EEG SO (white, percent out of all sites and units exhibiting beta activity), n = 72, 28, and 8 sites for GPe, GPi, and STN, respectively. A single point in the STN bar (at 0.53) is not included in this plot. (I) Same as G, only for the correlation between BG spiking beta power and EEG SO power. (J) Same as H, only for Pearson’s correlation coefficients between BG spiking beta power and EEG SO activity. n = 11, 5, and 2 sites.
Fig. 6.
Fig. 6.
BG beta activity rises before spontaneous awakening and correlates with the severity of insomnia in Parkinsonism. (A) FP beta power in the GPe (red), GPi (blue), and STN (green) during NREM sleep decreases as sleep deepens, is relatively low during SWS, and increases steadily before awakening (dashed red line), when it plateaus. Shading represents SEM. Numbers of recording sites as in Fig. 2. SWS beta power was lower than the beta power in the first NREM epoch after falling asleep for GPe and STN, lower than the average N1/2 beta power (all BG structures), and lower than the beta power 10 s before wake-up for GPe. For STN, the beta power 40 s after falling asleep was lower than 10 s before wake-up. For all structures, the beta power was not significantly different for any one of the wakefulness points, Kruskal–Wallis H test, P > 0.05. For all structures, the average postawakening beta power was greater than the beta power during SWS and greater than the beta power 40 s after falling asleep. Unless stated otherwise, the statistical test used for all comparisons was the Mann–Whitney U test, and all P < 0.05. (B) Same as A, only for FP beta episode probability. All statistical relationships in A also hold for the beta probability, except for the relationship between the first NREM sleep epoch and SWS, which was true for GPe and GPi, and the N1/2 vs. SWS comparison, which was not significant for STN. (C) Same as A and B, only for FP-EEG beta range coherence. In the GPe, SWS beta coherence was lower than beta coherence for the first NREM epoch, lower than beta coherence for the average of the last three epochs before awakening, and lower than N1/2 beta coherence. In the STN, the beta coherence 10 s before awakening was greater than the SWS beta coherence. For all structures, the beta coherence was not significantly different for any one of the wakefulness points, Kruskal–Wallis H test, P > 0.05. For GPi, the average postawakening beta coherence was greater than during SWS and 40 s before awakening. (D) EEG SO power during NREM sleep increases as sleep deepens, is relatively high during SWS and before awakening, and decreases abruptly after awakening when it plateaus. SWS SO power was greater than SO power in the first NREM epoch after falling asleep, N1/2 SO power, and postawakening SO power. EEG SO power was not significantly different for any of the 40-s to 10-s points before awakening and was not significantly different for any one of the wakefulness points, Kruskal–Wallis H test, P > 0.05. Finally, the average EEG SO power 20 s and 30 s after awakening was significantly lower than the average EEG SO power 40 s to 10 s before awakening. (E) Increased FP NREM sleep beta power in the BG correlates with poorer sleep. NREM sleep (% out of all classified epochs) (Left), wakefulness (%) (Center), and hourly awakening frequency (Right). Shading represents SEM. Beta power levels are shown on the x axis as sixths of the total beta range recorded for each night to enable comparisons between nights. Lowest vs. highest normalized beta power group, for the MPTP monkey, NREM sleep percentage was lower for the highest beta group, and both wakefulness percentage and awakening frequency were higher for the highest beta group, for all structures except wakefulness percentage for STN (P < 0.05, Mann–Whitney U test). (F) Same as E, only for spiking beta power. Lowest vs. highest normalized beta power group, for the MPTP monkey, NREM sleep percentage was lower for the highest beta group, and both wakefulness percentage and awakening frequency were higher for the highest beta group for GPe and STN only (P < 0.001, Mann–Whitney U test).

References

    1. De Cock V. C., Vidailhet M., Arnulf I., Sleep disturbances in patients with parkinsonism. Nat. Clin. Pract. Neurol. 4, 254–266 (2008). - PubMed
    1. Factor S. A., McAlarney T., Sanchez-Ramos J. R., Weiner W. J., Sleep disorders and sleep effect in Parkinson’s disease. Mov. Disord. 5, 280–285 (1990). - PubMed
    1. Videnovic A., Högl B., “Disorders of sleep and circadian rhythms” in Parkinson’s Disease, Videnovic A., Högl B., Eds. (Springer Vienna, 2015), pp. 79–91.
    1. Chahine L. M., Amara A. W., Videnovic A., A systematic review of the literature on disorders of sleep and wakefulness in Parkinson’s disease from 2005 to 2015. Sleep Med. Rev. 35, 33–50 (2017). - PMC - PubMed
    1. Kryger M., Roth T., Dement W. C., Principles and Practice of Sleep Medicine, (Elsevier, 2017).

Publication types

MeSH terms

Substances