. 2020 Jul 7;11(1):3382.
doi: 10.1038/s41467-020-17156-x.

Interferon-independent STING signaling promotes resistance to HSV-1 in vivo

Affiliations

Interferon-independent STING signaling promotes resistance to HSV-1 in vivo

Lívia H Yamashiro et al. Nat Commun. .

Abstract

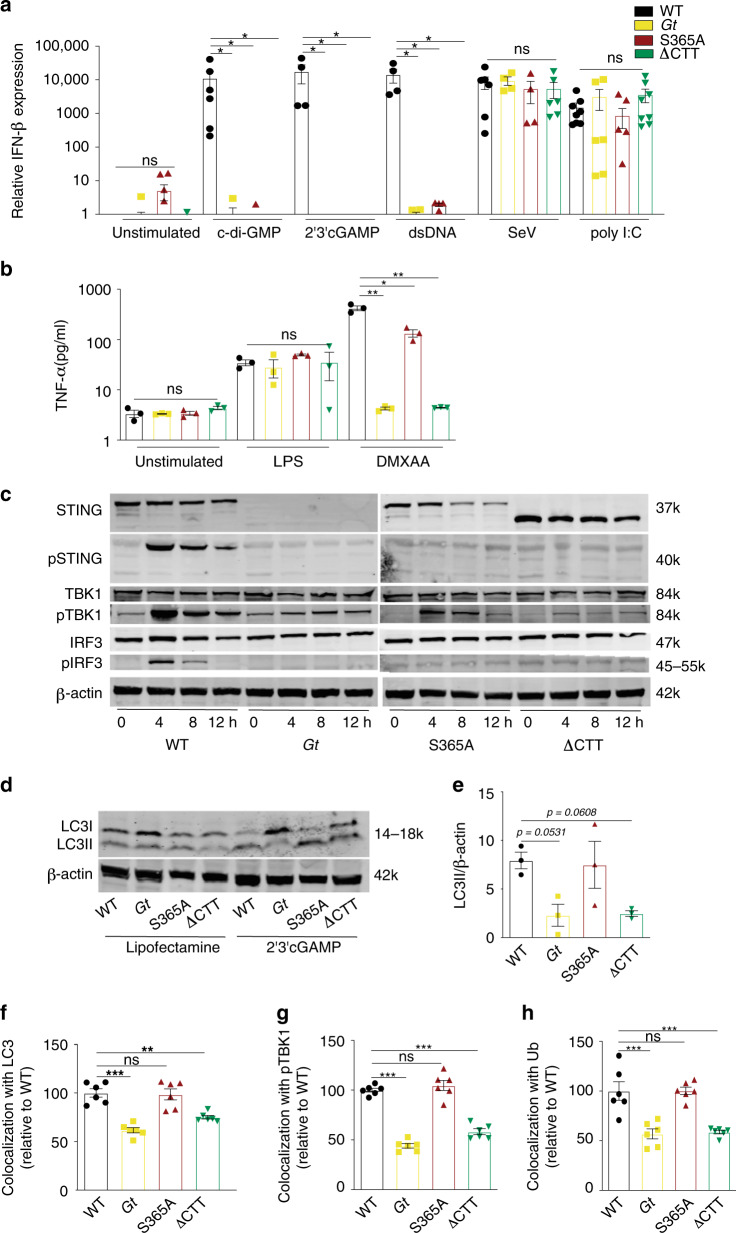
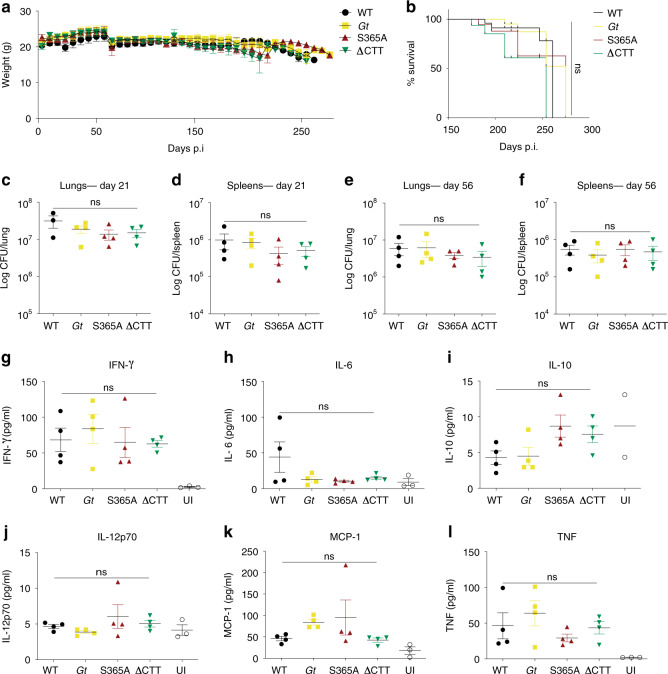
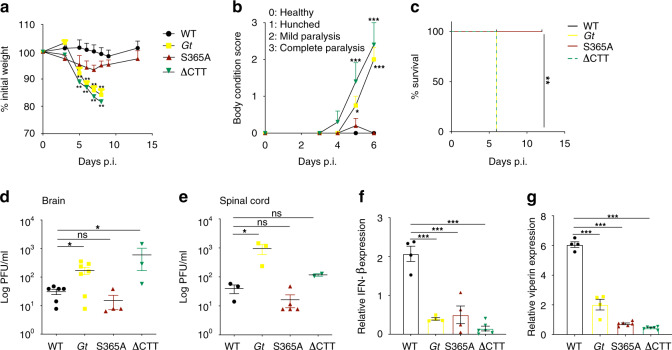
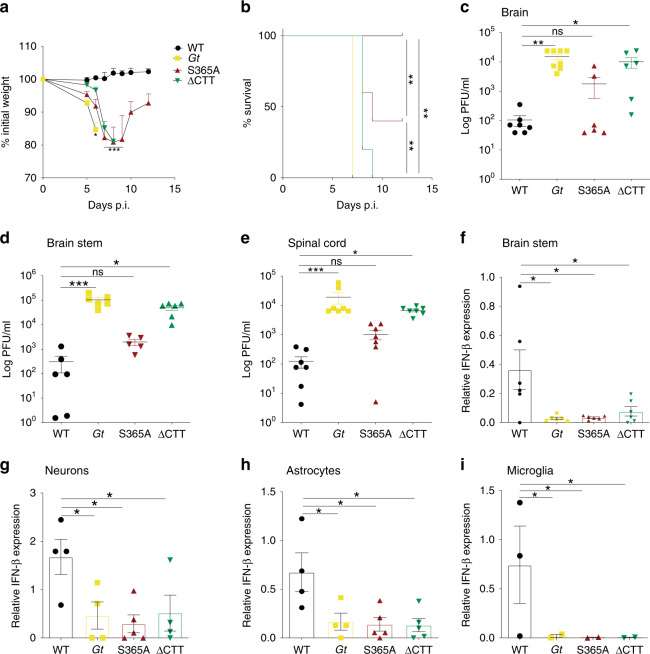
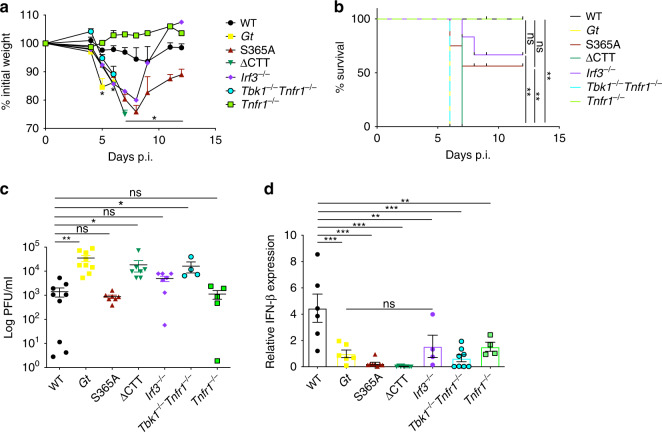
The Stimulator of Interferon Genes (STING) pathway initiates potent immune responses upon recognition of DNA. To initiate signaling, serine 365 (S365) in the C-terminal tail (CTT) of STING is phosphorylated, leading to induction of type I interferons (IFNs). Additionally, evolutionary conserved responses such as autophagy also occur downstream of STING, but their relative importance during in vivo infections remains unclear. Here we report that mice harboring a serine 365-to-alanine (S365A) mutation in STING are unexpectedly resistant to Herpes Simplex Virus (HSV)-1, despite lacking STING-induced type I IFN responses. By contrast, resistance to HSV-1 is abolished in mice lacking the STING CTT, suggesting that the STING CTT initiates protective responses against HSV-1, independently of type I IFNs. Interestingly, we find that STING-induced autophagy is a CTT- and TBK1-dependent but IRF3-independent process that is conserved in the STING S365A mice. Thus, interferon-independent functions of STING mediate STING-dependent antiviral responses in vivo.


Conflict of interest statement

R.E.V. has a financial relationship with Aduro BioTech and Ventus Therapeutics, and both he and the companies may benefit from the commercialization of the results of this research. The other authors declare no competing interests.

Figures

Fig. 1
Fig. 1. Defective type I IFN induction in STING S365A and ∆CTT macrophages.
a Bone marrow-derived macrophages were stimulated for 6 h and relative expression of IFN-β mRNA was measured. b Mice were injected DMXAA (25 mg/kg, i.p.) or LPS (10 ng, i.v.) and TNF-α production was measured on the serum 2 h later (n = 3 mice per genotype). c Primary macrophages were transfected with dsDNA for 4, 8 or 12 h or d 2′3′cGAMP for 6 h, and cell lysates were analyzed by immunoblotting for the indicated proteins. e Quantification of LC3II/β-actin ratio from three independent experiments similar to (d). f Quantification of LC3, g phospho TBK1 or h ubiquitin colocalization with DNA in primary macrophages transfected with Cy3-DNA for 6 h. Images were analyzed by an automated pipeline created on Perkin Elmer Harmony software for colocalization quantification (for more details refer to “Methods”). a Combined results from two independent experiments. b, c Representative results of two independent experiments, each yielding similar results. dh Representative results of three independent experiments, each yielding similar results. Center and error bars show mean and SEM. Analyzed with one-way ANOVA and Tukey post-test. *p ≤ 0.05; **p ≤ 0.005; ***p ≤ 0.0001. ns, not significant. Exact p values are given in the Supplementary Information.
Fig. 2
Fig. 2. STING mutant mice exhibit normal susceptibility to M. tuberculosis infection.
Mice were aerosol infected with 400 CFU dose of M. tuberculosis (Erdman strain) and a weighed every week. b Survival of infected mice. c Bacterial burden from lungs and d spleens at 21 and e, f 56 days post infection. gl Cytokine levels in the lungs from infected mice at day 21, measured by CBA. All mice except C57BL/6J WT were bred in-house. a, b n = 12 mice per genotype. cf n = 4/4/4/4. gl n = 4/4/4/4/3. Representative results of five independent experiments, each yielding similar results. UI, uninfected. Center and error bars show mean and SEM. Analyzed with one-way ANOVA and Tukey post test. ns not significant.
Fig. 3
Fig. 3. S365A mice are partially resistant to systemic HSV-1 infection.
Mice were intravenously infected with 1 × 106 PFU of HSV-1 (KOS strain). a Percentage of initial weight following infection. b Body condition score (BCS) of infected mice. c Survival of mice following infection. d Viral titers in the brain and e spinal cord at 6 days p.i. f Relative expression of Ifnb and g Viperin in the brain at 3 days p.i. All mice except C57BL/6J WT were bred in-house. ac n = 7 mice per genotype, (d) n = 6/7/4/3, (e) n = 3/3/4/3, (f) n = 4/3/4/4, and (g) n = 4/4/6/6. Representative of at least three independent experiments, each yielding similar results. Center and error bars show mean and SEM. Analyzed with one-way ANOVA and Tukey post test. *p ≤ 0.05; **p ≤ 0.005; ***p ≤ 0.0001. ns not significant. Exact p values are given in the Supplementary Information.
Fig. 4
Fig. 4. S365A mice are resistant to ocular HSV-1 infection.
Mice were infected via the ocular route with 1 × 105 PFU of HSV-1 (strain 17). a Percentage of initial weight following infection. b Survival of infected mice. c Viral titers in the brain, d brain stem, and e spinal cord from 6 days p.i. f Relative expression of Ifnb in the brain stem at 3 days p.i. g Brains from infected mice were collected 3 days p.i. and neurons, h astrocytes, and i microglia cells were sorted, and Ifnb expression was analyzed. a, b n = 7 mice per genotype. a, b Representative of more than five independent experiments, each yielding similar results. cf n = 3/4 mice per genotype. Combined results from two independent experiments, each yielding similar results. More than five independent experiments were performed. g, h n = 4 mice per genotype, i n = 3 mice per genotype. gi Representative of two independent experiments, each yielding similar results. Center and error bars show mean and SEM. Analyzed with one-way ANOVA and Tukey post-test. *p ≤ 0.05; **p ≤ 0.005; ***p ≤ 0.0001. ns not significant. Exact p values are given in the Supplementary Information.
Fig. 5
Fig. 5. STING S365A and Irf3−/ mice phenocopy resistance to HSV-1.
Mice were ocular infected with 1 × 105 PFU of HSV-1 (strain 17). a Percentage of initial weight following infection. b Survival of infected mice. c Viral titers in the brain stem. d Relative Ifnb expression from brain stems. a, b n = 7 mice per genotype. Representative results of at least two independent experiments, each yielding similar results. c, d n = 3/5 mice per genotype. Combined results from two independent experiments, each yielding similar results. Center and error bars show mean and SEM. Analyzed with one-way ANOVA and Tukey post test. *p ≤ 0.05; **p ≤ 0.005; ***p ≤ 0.0001. ns not significant. Exact p values are given in the Supplementary Information.

References

    1. Janeway CA., Jr. Approaching the asymptote? Evolution and revolution in immunology. Cold Spring Harb. Symp. Quant. Biol. 1989;54(Pt 1):1–13. - PubMed
    1. Sorensen LN, et al. TLR2 and TLR9 synergistically control herpes simplex virus infection in the brain. J. Immunol. 2008;181:8604–8612. - PubMed
    1. Watson RO, et al. The cytosolic sensor cGAS detects mycobacterium tuberculosis DNA to induce type I interferons and activate autophagy. Cell Host Microbe. 2015;17:811–819. - PMC - PubMed
    1. Watson RO, Manzanillo PS, Cox JS. Extracellular M. tuberculosis DNA targets bacteria for autophagy by activating the host DNA-sensing pathway. Cell. 2012;150:803–815. - PMC - PubMed
    1. Gao P, et al. Cyclic [G(2′,5′)pA(3′,5′)p] is the metazoan second messenger produced by DNA-activated cyclic GMP-AMP synthase. Cell. 2013;153:1094–1107. - PMC - PubMed

Publication types