. 2020 Jul 7;10(1):11164.
doi: 10.1038/s41598-020-67430-7.

A novel humanized mouse model to study the function of human cutaneous memory T cells in vivo in human skin

Affiliations

A novel humanized mouse model to study the function of human cutaneous memory T cells in vivo in human skin

Maria M Klicznik et al. Sci Rep. .

Abstract

Human skin contains a population of memory T cells that supports tissue homeostasis and provides protective immunity. The study of human memory T cells is often restricted to in vitro studies and to human PBMC serving as primary cell source. Because the tissue environment impacts the phenotype and function of memory T cells, it is crucial to study these cells within their tissue. Here we utilized immunodeficient NOD-scid IL2rγnull (NSG) mice that carried in vivo-generated engineered human skin (ES). ES was generated from human keratinocytes and fibroblasts and was initially devoid of skin-resident immune cells. Upon adoptive transfer of human PBMC, this reductionist system allowed us to study human T cell recruitment from a circulating pool of T cells into non-inflamed human skin in vivo. Circulating human memory T cells preferentially infiltrated ES and showed diverse functional profiles of T cells found in fresh human skin. The chemokine and cytokine microenvironment of ES closely resembled that of non-inflamed human skin. Upon entering the ES T cells assumed a resident memory T cell-like phenotype in the absence of infection, and a proportion of these cutaneous T cells can be locally activated upon injection of monocyte derived dendritic cells (moDCs) that presented Candida albicans. Interestingly, we found that CD69+ memory T cells produced higher levels of effector cytokines in response to Candida albicans, compared to CD69- T cells. Overall, this model has broad utility in many areas of human skin immunology research, including the study of immune-mediated skin diseases.


Conflict of interest statement

M.M.K., E.M.M. and I.K.G. are inventors on patent application EP18168258 / US 16389821 that was jointly filed by the University of Salzburg, Austria, and Debra Austria that covers the use of skin humanized mice in pre-clinical studies involving engineered skin and human T cells.

Figures
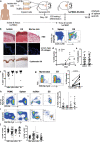
Figure 1
Figure 1
Engineered human skin is preferentially infiltrated by human T cells. (a) Schematic of the huPBMC-ES-NSG model. (b) ES were generated as in (a) and analyzed by H&E staining and immunofluorescence staining of human type VII collagen on day 72 (upper two panels) as well as immunohistochemical staining of human Cytokeratin 5/6 in ES (lower panel). Murine skin and human skin from a HD served as controls. White bar = 100 µm (c–g) Single cell suspensions of spleen and ES of huPBMC-ES-NSG mice were analyzed by flow cytometry. Each data point represents an individual human donor or experimental mouse. Circles represent data collected from huPBMC-ES-NSG mice using tissue of donor WT85 (female) and squares donor WT70 (male). The different fillings of the symbols indicate independent experiments. (c) Representative flow cytometry analysis and (d) graphical summary of proportion of human CD45+ cell as % of live cells in the lymphocyte gate in paired spleen and ES at indicated time points after adoptive transfer of 2.5 × 106 PBMC. (e) Graphical summary of proportion of CD45+ cells of live cells in spleen and ES 18–34 days after PBMC transfer. n = 3–6/experiment; cumulative data of 6 independent experiments. (f) Graphical summary of the proportion of CD3+ cells of live CD45+ cells 18–35 days after PBMC transfer; n = 3–6/experiment; cumulative data of 6 independent experiments. (g) Representative flow cytometry analysis and graphical summary of CD3+ percentages in ES and adjacent murine skin 18–35 days after PBMC transfer gated on live lymphocytes. n = 3–6/experiment; cumulative data of 3 independent experiments. Significance determined by paired student’s t test; mean ± SD. (h) Representative plots and graphical summary of TCRγδ+ and CD3+ cells of live CD45+ in indicated tissues. (i) Representative flow cytometry plots of CD4+ and CD8+ of CD3+CD45+ live gated cells (j) Graphical summary of CD4 and CD8 expressing cells in human PBMC and skin and spleen and ES, 18–35 days after PBMC transfer gated on live CD3+CD45+ lymphocytes. n = 3–6/experiment; Combined data of 6 independent experiments.
Figure 2
Figure 2
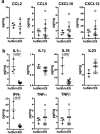
Engineered human skin mirrors chemokine and cytokine levels of non-inflamed human skin. Cytokine and chemokine expression within tissues was determined by bead-based multicomponent analysis of ES from huPBMC-ES-NSG 21 days after PBMC transfer and 3 different healthy human skin donors. Amount of the indicated (a) chemokines and (b) cytokines per mg skin. Statistical significance determined by student’s t test; mean ± SD.
Figure 3
Figure 3
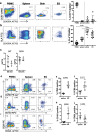
Skin and spleen infiltrating CD4+ T cells show skin-homing memory phenotype and upregulate markers of tissue residency and skin-tropism in ES. Representative flow cytometry analysis of (a) CCR7 and CD45RA expression, and (b) CLA and CD45RA expression by gated CD4+CD3+CD45+ live leukocytes from blood and skin of healthy donors, spleen and ES of huPBMC-ES-NSG mice and graphical summary of the proportions of indicated cells by gated CD4+CD3+CD45+ live leukocytes. n = 5–6/experiment; cumulative data of 2 independent experiments. (c) Amount of the indicated cytokines per mg skin determined by bead-based multicomponent analysis of ES from huPBMC-ES-NSG and 3 different healthy human skin donors. (d, g, h) Representative flow cytometry analysis of the expression of (d) CCR6 and CD69; (g) CD62L and (h) CD103 in indicated tissues by CLA+CD45RA-CD4+CD3+ living cells. (e, f, i, j) Graphical summary of CLA+CD45RA-CD4+CD3+living cells isolated from spleen and ES, expressing the indicated markers. n = 5; Significance determined by paired student’s t test; mean ± SD.
Figure 4
Figure 4
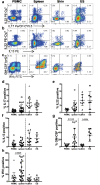
Engrafted splenic and cutaneous human CD4+ T cells reflect diverse phenotypes of T cells in human tissues (a–c) Single cell suspensions of blood and skin of healthy donors, and spleen and ES of huPBMC-ES-NSG mice prepared 18–35 days after PBMC transfer, were stimulated ex vivo with PMA/ionomycin and intracellular cytokine production was analyzed by flow cytometry. Representative analysis of IL17, IL22, IL13, GM-CSF and IFNγ % of CD4+ T cells as indicated. (d–h) Graphical summary of the expression of the indicated cytokines by T cells from blood and skin of healthy donors, and spleen and ES of huPBMC-ES-NSG mice analyzed 18–35 days after PBMC transfer by gated CD4+CD3+CD45+ live leukocytes. n = 3–6/experiment; cumulative data of 2–5 independent experiments as indicated by the symbol fillings; each symbol shape is representative of a skin donor (circles = donor WT85 and squares = donor WT70), and each filling represents an independent experiment.
Figure 5
Figure 5
Cutaneous CD4+ T cells are activated by local C.albicans presented by moDCs in ES. (a) Schematic outline of the experiment. (b) Graphical summary of the proportion of CD45+ cells among live cells in the lymphocyte gate in indicated organs of huPBMC-ES-NSG mice that received either LPS/moDC injections or HKCA/moDC injections into the ES. n = 2–7/experiment, cumulative data of 6 independent experiments. (c) Graphical analysis of the proportion of Ki67+ proliferating cells and CD25+ cells by gated CD4+CD3+CD45+ live leukocytes from LPS/moDC or HKCA/moDC treated ES. (c) Single cell suspensions of ES were analyzed by flow cytometry after ex vivo stimulation with PMA/Ionomycin and intracellular cytokine staining. Graphical summary of the proportion of skin CD4+ T cells by gated CD4+CD3+CD45+ live leukocytes expressing IL17 and TNFα. n = 2–7/experiment, cumulative data of 3 independent experiments. (circles = donor WT85, squares = donor WT70, triangles = WT73) Statistical significance determined by 2-tailed unpaired student’s t test; mean ± SD.
Figure 6
Figure 6
C. albicans-specific CD4+ T cell response can be detected in allogeneic ES. (a) Schematic: NSG mice bearing fully healed ES of one of two different skin donors (A and B) were adoptively transferred with either skin donor-matched PBMC or skin donor-mismatched PBMC. Intradermal injections of donor A derived LPS/moDC or HKCA/moDC were performed as depicted (i.e. leukocytes were matched). Single cell suspensions of ES were analyzed by flow cytometry after ex vivo stimulation with PMA/Ionomycin and intracellular staining. (b, c) Graphical summary of the proportion of skin CD4+ T cells by gated CD4+CD3+CD45+ live leukocytes expressing the indicated markers following intradermal encounter of LPS/moDC (LPS) or HKCA/moDC (HKCA). Red data points represent CD4+ T cells isolated out of mismatched ES. Statistical significance determined by ANOVA and Tuckey’s test for multiple comparison; mean ± SD. (d) Graphical summary of the ratio between CD4+ and CD8+ T cells of isolated skin T cells gated by CD3+CD45+ live leukocytes. n = 2–5/group, combined data of 2 independent experiments;
Figure 7
Figure 7
CD4+ T cell activation within the C. albicans injected ES grafts is antigen-specific. (a) Schematic of experimental procedure. Mice carrying ES received hPBMC followed by 1–2 intradermal injections of HKCA-loaded moDCs autologous to the PBMC. 10 days after the last injection, single cell suspensions of ES were divided and re-stimulated ex vivo either with autologous moDCs stimulated with LPS or with moDC loaded with HKCA in presence of Brefeldin A (BFA) to detect cytokines by flow cytometry. (b) Graphical analysis of the proportion of Ki67+ proliferating cells of gated CD4+CD3+CD45+ live leukocytes from ES re-stimulated with LPS/moDC or HKCA/moDC. (c) Graphical summary of the proportion of CD4+ T cells from ES re-stimulated with LPS/moDC or HKCA/moDC producing the indicated cytokines. Combined data of 3 independent experiments (n = 3–11 mice/experiment). Squares = donor WT70, triangles = WT73. Red data points represent CD4+ T cells isolated out of allo-mismatched ES. Clear symbols indicate autologous setting. Statistical significance determined by one tailed paired student’s t test.
Figure 8
Figure 8
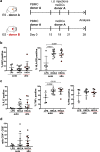
Cutaneous CD4+CD69+ T Cells show increased effector function in response to C.albicans. Mice were treated as in Fig. 5. 7 days after the last injection of HKCA/moDC single cell suspensions were stimulated with PMA/ionomycin and analyzed by flow cytometry Graphical summary of the expression of (a) CD25 or (b) the indicated cytokines by CD69- or CD69+ gated CD4+CD3+CD45+ live leukocytes from ES. Each symbol represents an individual animal, donors: circles = donor WT85, squares = donor WT70, triangles = WT73; data from 2–3 experiments. Significance determined by paired student’s t test.

Similar articles

Cited by

References

    1. Bos JD, et al. Predominance of ‘memory’ T cells (CD4+, CDw29+) over ‘naive’ T cells (CD4+, CD45R+) in both normal and diseased human skin. Arch. Dermatol. Res. 1989;281:24–30. - PubMed
    1. Clark RA, et al. The vast majority of CLA+ T cells are resident in normal skin. J. Immunol. Baltim. Md. 2006;1950(176):4431–4439. - PubMed
    1. Nestle FO, Di Meglio P, Qin J-Z, Nickoloff BJ. Skin immune sentinels in health and disease. Nat. Rev. Immunol. 2009;9:679–691. - PMC - PubMed
    1. Di Meglio P, Perera GK, Nestle FO. The multitasking organ: recent insights into skin immune function. Immunity. 2011;35:857–869. - PubMed
    1. Klicznik MM, Szenes-Nagy AB, Campbell DJ, Gratz IK. Taking the lead - how keratinocytes orchestrate skin T cell immunity. Immunol. Lett. 2018;200:43–51. - PMC - PubMed

Publication types