. 2020 Jun 30:12:5181-5200.
doi: 10.2147/CMAR.S250661. eCollection 2020.

LACTB Regulates PIK3R3 to Promote Autophagy and Inhibit EMT and Proliferation Through the PI3K/AKT/mTOR Signaling Pathway in Colorectal Cancer

Affiliations

LACTB Regulates PIK3R3 to Promote Autophagy and Inhibit EMT and Proliferation Through the PI3K/AKT/mTOR Signaling Pathway in Colorectal Cancer

Wei Xu et al. Cancer Manag Res. .

Abstract

Background: Colorectal cancer (CRC) is one of the most common aggressive malignancies. LACTB functions as a tumor suppressor, and previous findings have demonstrated that LACTB can inhibit epithelial-to-mesenchymal transition (EMT) and proliferation of breast cancer and CRC cells. However, few studies have investigated the roles of LACTB in autophagy and proliferation in CRC. The current study aimed to identify the roles of LACTB in EMT and proliferation associated with autophagy in CRC and to elucidate the probable molecular mechanisms through which LACTB are involved in these processes.

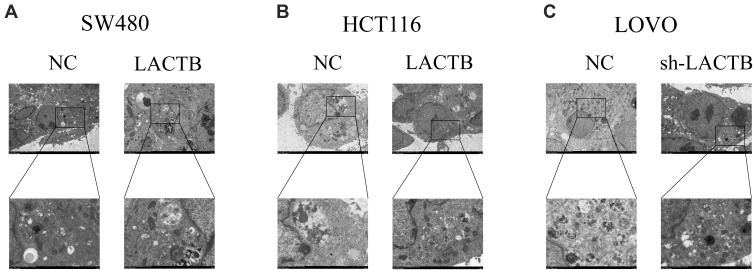
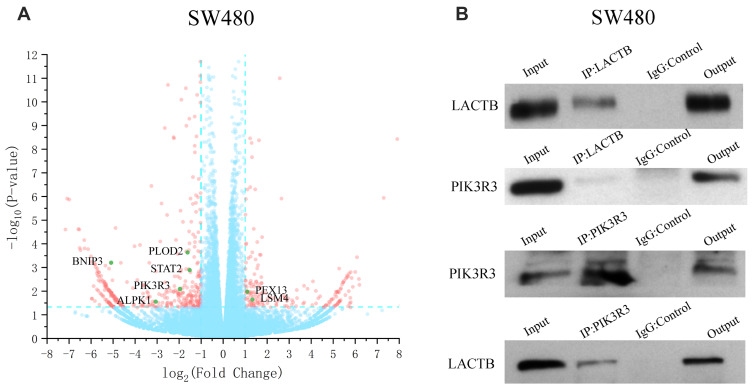
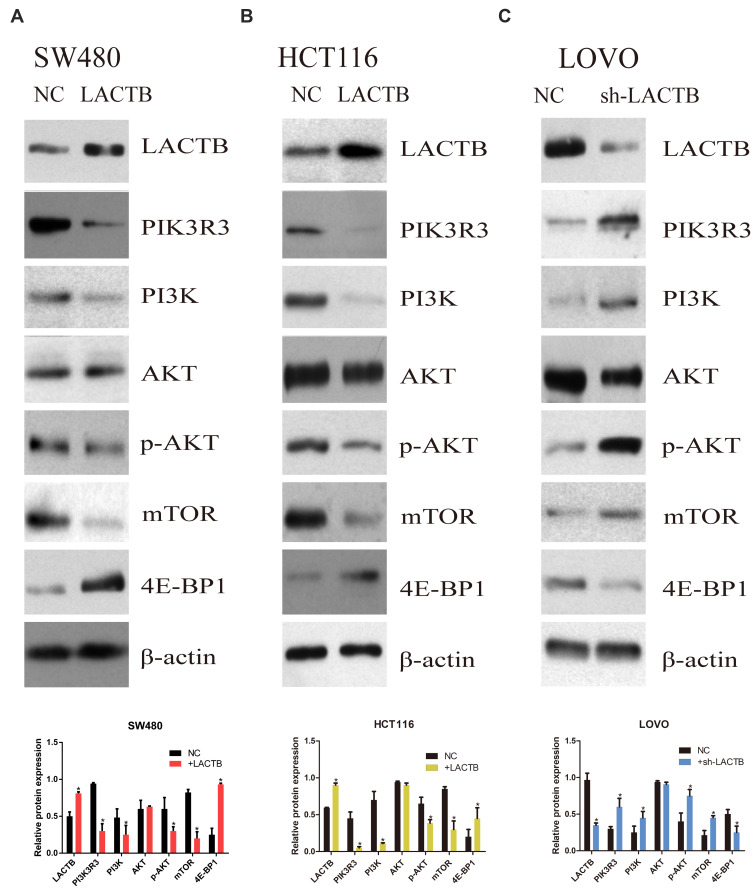
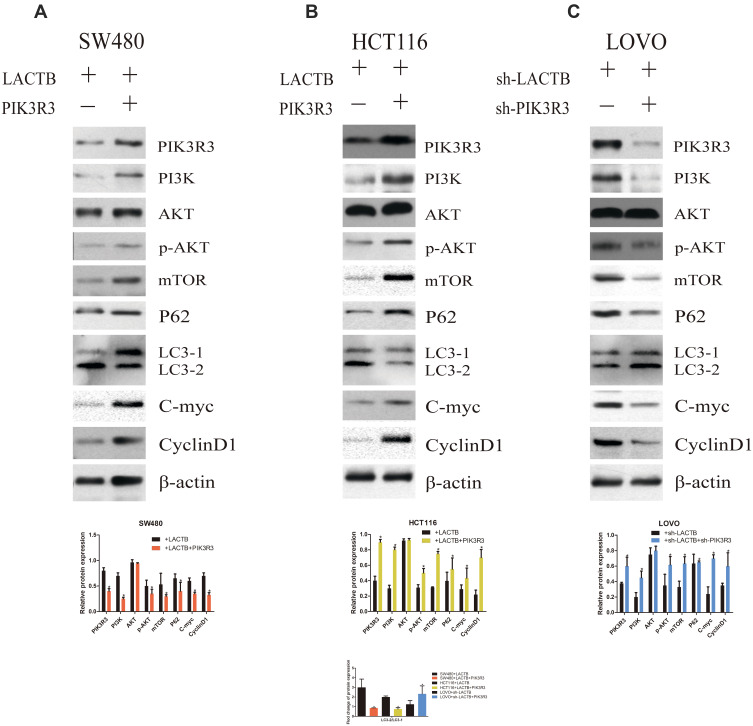
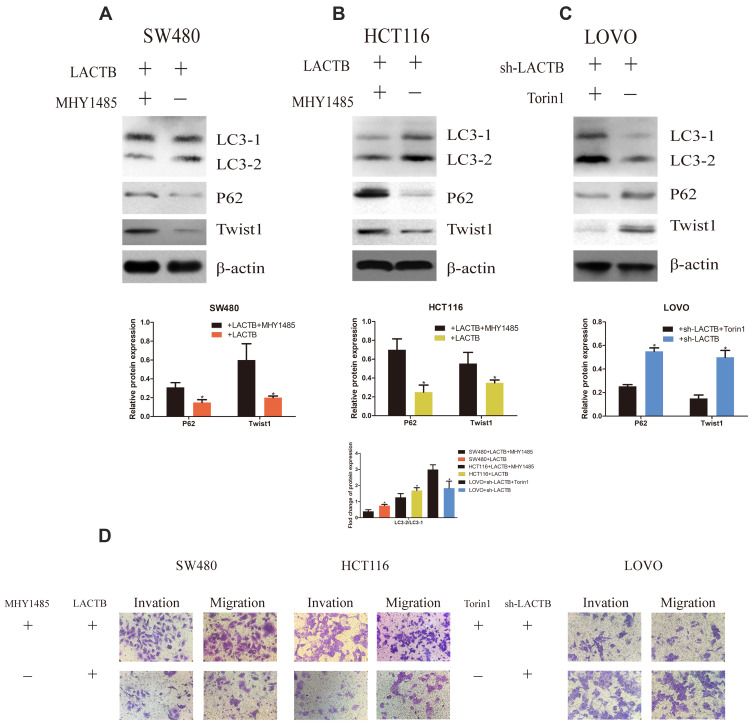
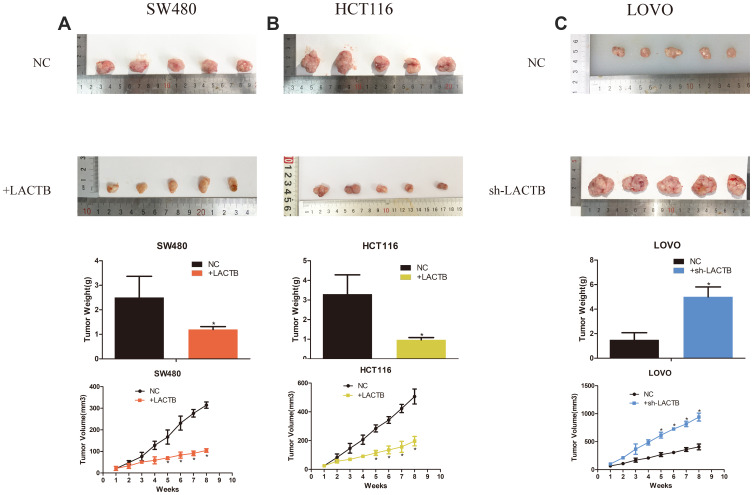
Materials and methods: Transwell invasion, MTT, transmission electron microscopy, RNA-seq, immunoprecipitation, immunohistochemistry and Western blotting assays were performed to evaluate the migratory, invasive, proliferative and autophagic abilities of CRC cells, and the levels of active molecules involved in PI3K/AKT signaling were examined through Western blotting analysis. In addition, the in vivo function of LACTB was assessed using a tumor xenograft model.

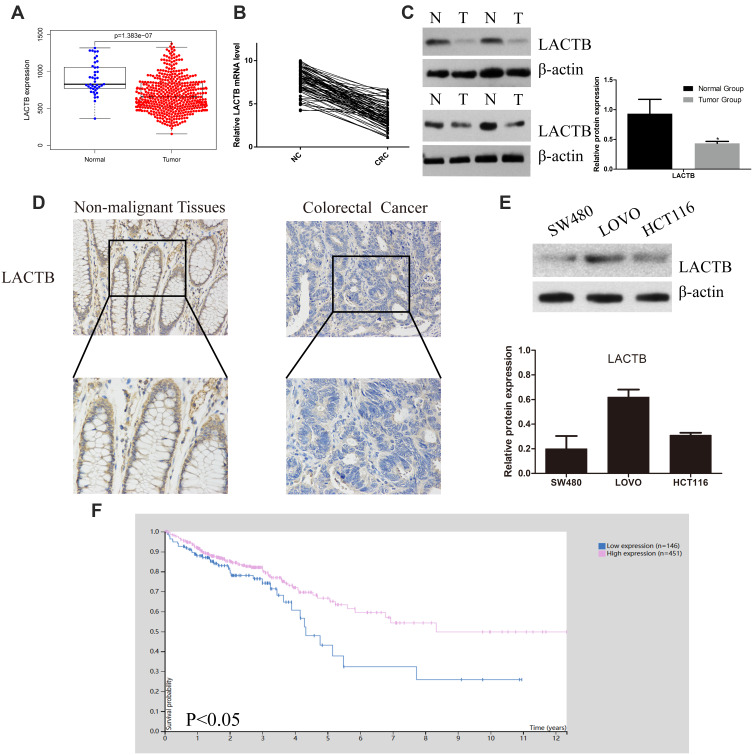
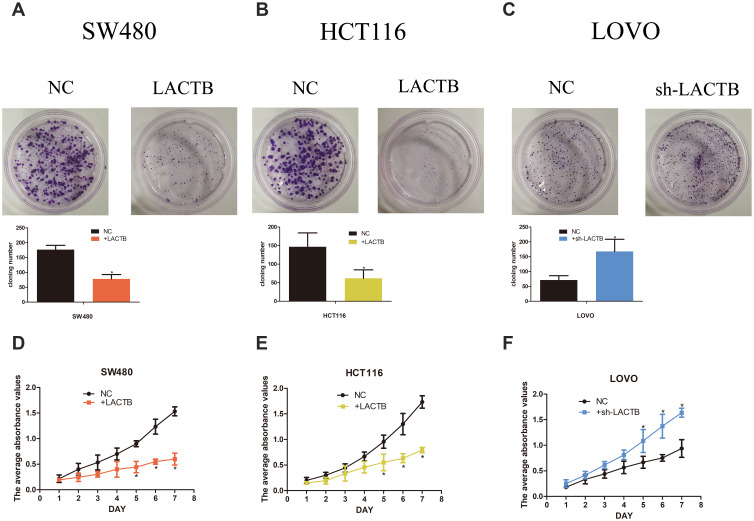
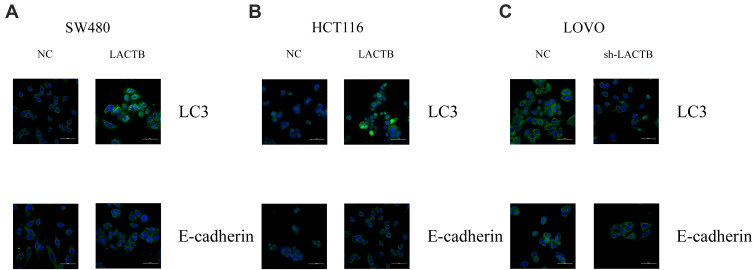
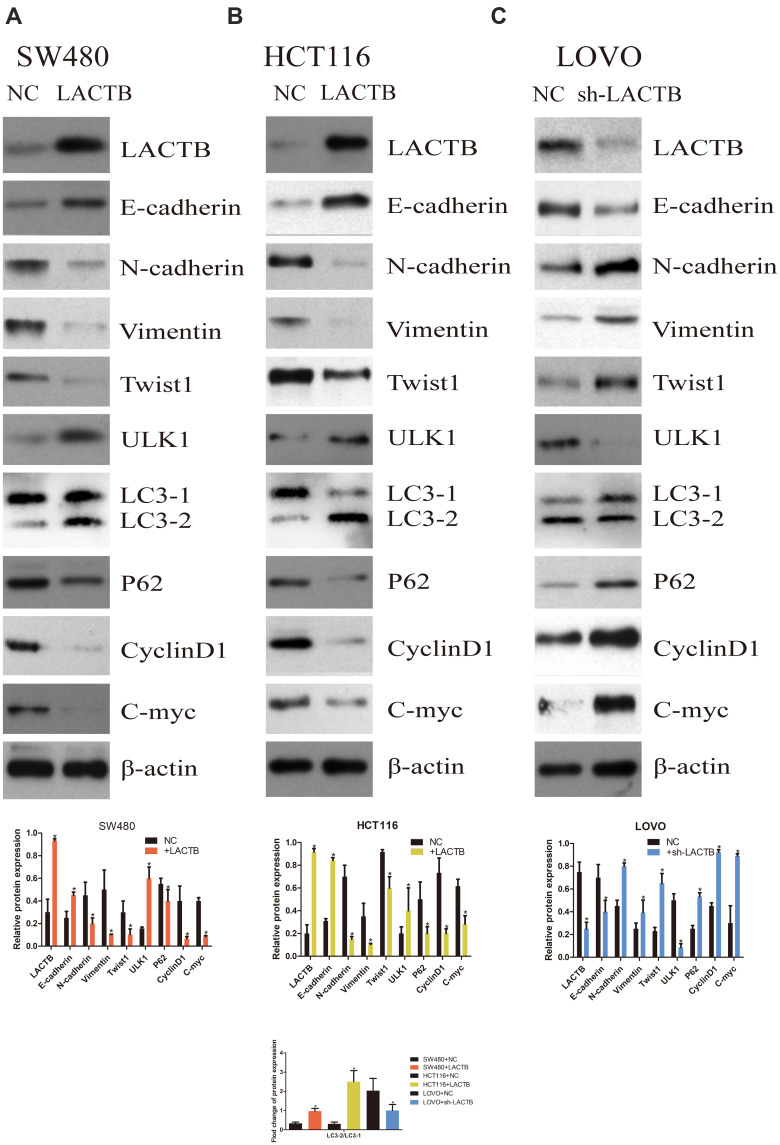
Results: Weaker LACTB expression was found in CRC tissue samples than in nonmalignant tissue samples, and LACTB inhibited cell invasion, migration, and proliferation by promoting autophagy in vitro. Furthermore, the regulatory effects of LACTB on autophagy and EMT were partially attributed to the PI3K/AKT signaling pathway. The in vivo results also showed that LACTB modulated CRC tumorigenesis.

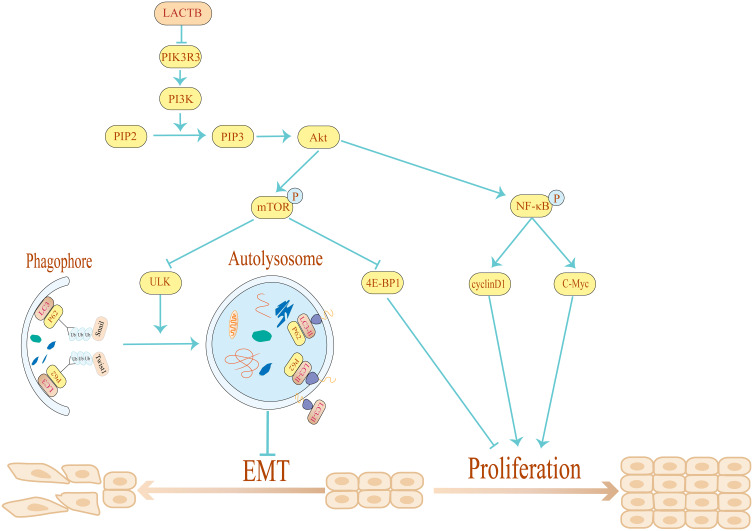
Conclusion: LACTB can regulate the activity of PIK3R3 to influence the level of PI3K, and it also promotes autophagy and inhibits EMT and proliferation in part through the PI3K/AKT/mTOR signaling pathway.

Keywords: EMT; LACTB; PIK3R3; autophagy; colorectal cancer; proliferation.


Conflict of interest statement

The authors declare that they have no competing interests.

Figures

Figure 1
Figure 1
LACTB expression in CRC tissues is low and could promote the overall survival of CRC patients. (A) The analysis of the LACTB mRNA levels in CRC tissues and paired noncancerous tissues from TCGA revealed that these levels were significantly decreased in CRC tissues, as demonstrated by the Mann–Whitney U-test. (B) The LACTB mRNA expression levels in 80 CRC tissues and paired noncancerous tissues were assessed by qRT-PCR, which showed that LACTB mRNA expression was significantly decreased in CRC tissues, as demonstrated using the 2-ΔΔct method and determined by the Mann–Whitney U-test. (C) LACTB protein expression in representative samples of CRC tissues and paired adjacent noncancerous tissues. The level of LACTB was downregulated in CRC tissues (*P<0.05), as determined by Log rank test. (D) Immunohistochemical staining of LACTB in CRC tissues and normal tissues. The level of LACTB was weaker in CRC tissues than in nonmalignant tissues. (E) Levels of LACTB protein expression in three different CRC cell lines. The HCT116 and SW480 cells showed inconspicuous LACTB expression, and strong expression of LACTB was detected in LOVO cells. (F) The analysis of TCGA data showed that the CRC patients with high LACTB expression exhibited significantly improved OS as determined by Student’s t-test (P<0.05).
Figure 2
Figure 2
LACTB inhibits CRC cell proliferation and colony formation in vitro. (AC) The colonies formed by the LACTB-knockdown cells were denser than those formed by the negative control cells, which suggests that LACTB upregulation weakens the ability of cancer cells to form colonies (*P<0.05), as determined by Student’s t-test. (DF) The MTT assay showed that the proliferative capacity of LOVO cells with suppressed LACTB expression was higher than that of control LOVO cells; however, the overexpression of LACTB in HCT116 or SW480 cells led to a decline in the proliferative ability of these cells (*P<0.05), as determined by Student’s t-test.
Figure 3
Figure 3
LACTB inhibits EMT and promotes autophagy in CRC, as demonstrated by immunofluorescence. (AC) Immunofluorescence results revealed that E-cadherin expression was enhanced in LACTB-overexpressing SW480 and HCT116 cell lines and dysregulated in LACTB-knockdown LOVO cells compared with control cells transfected with a nonspecific lentivirus. The upregulation of LACTB expression in SW480 and HCT116 cells significantly elevated the LC3-II/LC3-I ratio, and the knockdown of LACTB expression in LOVO cells decreased the LC3-II/LC3-I ratio and the E-cadherin level.
Figure 4
Figure 4
LACTB inhibits EMT and promotes autophagy in CRC, as demonstrated by Western blotting. (AC) Western blotting assays revealed that E-cadherin expression was enhanced in LACTB-overexpressing SW480 and HCT116 cell lines and dysregulated in LACTB-knockdown LOVO cells compared with control cells transfected with a nonspecific lentivirus. In contrast, the opposite trend was obtained for N-cadherin, vimentin, C-Myc, CyclinD1 and Twist1 expression in these groups of cells. The upregulation of LACTB expression in SW480 and HCT116 cells significantly elevated the LC3-II/LC3-I ratio and the ULK1 level and decreased the P62 expression level. In contrast, the knockdown of LACTB expression in LOVO cells decreased the LC3-II/LC3-I ratio and the ULK1 level and promoted the expression of P62 (*P<0.05), as determined by Student’s t-test.
Figure 5
Figure 5
Effects of LACTB on autophagosomes in CRC cells. (AB) Autophagosomes were observed in CRC cells by TEM. Additionally, in LACTB-overexpressing HCT116 and SW480 cells exhibited higher levels of autophagosomes compared with the control cells. (C) The inhibition of LACTB expression in LOVO cells decreased the numbers of autophagosomes. Magnification, 1500× and 5000×.
Figure 6
Figure 6
LACTB can regulate the level of PIK3R3 to influence cancer development. (A) The RNA‐seq-based analysis showed that the LACTB-overexpressing SW480 cells exhibited 2178 differentially expressed genes (p < 0.05), including 1464 (67.2%) upregulated and 714 (32.8%) downregulated cells, compared with the control SW480 cells. (B) Coimmunoprecipitation assays indicated that LACTB can directly regulate the level of PIK3R3.
Figure 7
Figure 7
The regulatory effects of LACTB on autophagy and EMT are partially due to the PI3K/AKT signaling pathway. (AC) Western blotting showed that PIK3R3 and PI3K expression was clearly decreased in the two LACTB-overexpressing cell lines compared with the control cell lines, whereas the LACTB-knockdown LOVO cells showed high PIK3R3 and PI3K expression. Simultaneously, the levels of p-AKT and mTOR were decreased after LACTB overexpression, and the LACTB-silenced LOVO cells showed increased levels of these proteins. In addition, 4E-BP1 exhibited adverse outcomes (*P<0.05), as determined by Student’s t-test.
Figure 8
Figure 8
The regulatory effects of LACTB on autophagy can be partially attributed to the PI3K/AKT/mTOR signaling pathway via regulation of the level of PIK3R3. (AC) PI3K expression was increased and blocked in stable PIK3R3-overexpressing and PIK3R3-knockdown cell lines, respectively, and these changes affected the expression of PI3K, AKT, p-AKT and mTOR, as observed by Western blotting. Additionally, PIK3R3 silencing inhibited the PI3K/AKT/mTOR signaling pathway, which lead to reduced expression of PI3K, p-AKT and mTOR. In contrast, the LC3-II/LC3-I expression ratio was augmented after PIK3R3 silencing, and this enhancement resulted in suppression of the PI3K/AKT/mTOR signaling pathway and thereby the induction of autophagy, as demonstrated by a decreased level of the negative autophagy marker P62. In addition, decreased levels of C-Myc and cyclinD1 resulted in the inhibition of proliferation (*P<0.05), as determined by Student’s t-test.
Figure 9
Figure 9
LACTB can mediate EMT and proliferation of CRC cells by regulating autophagy. (AC) The results showed that LACTB-overexpressing SW480 and HCT116 cells exhibited increased expression levels of P62 and Twist1 after treatment with the autophagy inhibitor MHY1485, but these levels were reduced in LACTB-knockdown LOVO cells treated with the autophagy activator Torin1. In addition, the LC3-II/LC3-I expression ratio was decreased in LACTB-overexpressing SW480 and HCT116 cells following MHY1485 treatment, but this ratio was increased in LACTB-knockdown LOVO cells treated with Torin1. The inhibition of autophagy is associated with an increased level of P62, which prevents the degradation of Twist1 (*P<0.05), as determined by Student’s t-test. (D) Transwell assays revealed that cell migration and invasion were promoted after the attenuation of autophagy in LACTB-overexpressing SW480 and HCT116 cells treated with the autophagy inhibitor MHY1485, whereas LOVO-knockdown cells treated with the autophagy activator Torin1 showed poor cell migration and invasion abilities.
Figure 10
Figure 10
LACTB modulates CRC tumorigenesis in vivo. (AC) We constructed a tumor xenograft model. Untreated control LOVO, SW480 or HCT116 cells or those transduced with LACTB-shRNA or the LACTB-overexpression vectors (1 × 10⁶) were injected into the left flank of nude mice. The sizes of the tumors generated from the corresponding untransduced control cells were enhanced compared with those of the tumors derived from LACTB-overexpressing cells, whereas the tumors generated from LACTB-silenced cells exhibited a considerable increase in volume compared with those from the corresponding control cells. Furthermore, as a consequence of these effects in the tumor volume, a similar trend was obtained for the tumor weight (*P<0.05), as determined by Student’s t-test.
Figure 11
Figure 11
Schematic diagram of the mechanism through which LACTB inhibits EMT and promotes autophagy in CRC via the PI3K/AKT/mTOR signaling pathway. By overexpressing and silencing LACTB and PIK3R3, we demonstrated that LACTB might negatively regulate PIK3R3 to inhibit cancer development. In addition, LACTB can inhibit EMT by promoting autophagy and decreasing the level of Twist1.

References

    1. Siegel RL, Miller KD, Jemal A. Cancer statistics, 2019. CA Cancer J Clin. 2019;69(1):7–34. doi:10.3322/caac.21551 - DOI - PubMed
    1. Wingo PA, Cardinez CJ, Landis SH, et al. Long-term trends in cancer mortality in the United States, 1930–1998. Cancer. 2003;97(S12):3133–3275. doi:10.1002/cncr.11380 - DOI - PubMed
    1. Kahi CJ, Boland CR, Dominitz JA, et al. United states multi-society task force on colorectal, colonoscopy surveillance after colorectal cancer resection: recommendations of the us multi-society task force on colorectal cancer. Gastroenterology. 2016;150(3):758–768.e711. doi:10.1053/j.gastro.2016.01.001 - DOI - PubMed
    1. Keckesova Z, Donaher JL, De Cock J, et al. LACTB is a tumour suppressor that modulates lipid metabolism and cell state. Nature. 2017;543(7647):681–686. doi:10.1038/nature21408 - DOI - PMC - PubMed
    1. Zeng K, Chen X, Hu X, et al. LACTB, a novel epigenetic silenced tumor suppressor, inhibits colorectal cancer progression by attenuating MDM2-mediated p53 ubiquitination and degradation. Oncogene. 2018;37(41):5534–5551. doi:10.1038/s41388-018-0352-7 - DOI - PubMed