. 2020 Jun 19:14:648.
doi: 10.3389/fnins.2020.00648. eCollection 2020.

Comparison of Phase Synchronization Measures for Identifying Stimulus-Induced Functional Connectivity in Human Magnetoencephalographic and Simulated Data

Affiliations

Comparison of Phase Synchronization Measures for Identifying Stimulus-Induced Functional Connectivity in Human Magnetoencephalographic and Simulated Data

Kenji Yoshinaga et al. Front Neurosci. .

Abstract

Phase synchronization measures are widely used for investigating inter-regional functional connectivity (FC) of brain oscillations, but which phase synchronization measure should be chosen for a given experiment remains unclear. Using neuromagnetic brain signals recorded from healthy participants during somatosensory stimuli, we compared the performance of four phase synchronization measures, imaginary part of phase-locking value, imaginary part of coherency (ImCoh), phase lag index and weighted phase lag index (wPLI), for detecting stimulus-induced FCs between the contralateral primary and ipsilateral secondary somatosensory cortices. The analyses revealed that ImCoh exhibited the best performance for detecting stimulus-induced FCs, followed by the wPLI. We found that amplitude weighting, which is related to computing both ImCoh and wPLI, effectively attenuated the influence of noise contamination. A simulation study modeling noise-contaminated periodograms replicated these findings. The present results suggest that the amplitude-dependent measures, ImCoh followed by wPLI, may have the advantage in detecting stimulus-induced FCs.

Keywords: amplitude coherence; cross-periodogram; functional connectivity; phase synchronization; somatosensory system.


Figures

FIGURE 1
FIGURE 1
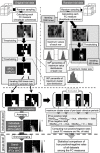
Processing pipeline for constructing surrogate data. Each “trial K” and “trial KR” represents Kth actual trial onset (K  =  1,2,  … ,  N) and KR th dummy trial onset (KR   =  1,2,  … ,  NR). c-SI Ch: one of a channel pair over the primary somatosensory cortex contralateral to the stimuli, i-SII Ch: the other of a channel pair over the secondary somatosensory cortex ipsilateral to the stimuli.
FIGURE 2
FIGURE 2
(Upper panel, thick dashed line) Processing pipeline of statistical analysis for identifying significant functional connectivities (FCs) and amplitude coherences (ACs). (Middle panel, thick dashed line) Processing pipeline for an individual-level analysis for obtaining the individual-averages of double-thresholded functional connectivities and true positive/negative rates. (Lower panel, thick dashed line) Processing pipeline for a group-level analysis for the individual results. dFCs/dACs: double-thresholded FCs/ACs, MaxSzpre/MaxSzpost: maximum cluster sizes of the prestimulus/poststimulus periods.
FIGURE 3
FIGURE 3
Grand-averages of double-thresholded functional connectivities (dFCs) across all the datasets. As shown in the rightmost-bottom panel, each panel shows data in the time range (abscissa) of 0.5 s before to 0.5 s after the stimulus onset (0 s) and in the frequency range (ordinate) between 2 Hz and 45 Hz. Note that each pixel value represents a proportion of the corresponding pixel to be in significant clusters among all 250 sets of random sampling and all datasets.
FIGURE 4
FIGURE 4
(A) Box plots of the true positive rates (TPRs) with the number of trials being 100 (AI) and 200 (AII). For this plotting purpose, we only used the datasets (n = 35) in which the TPRs for the number of trials 200 were above 0.05 across all the FC measures. (B) Box plots of the true negative rates (TNRs) of all the datasets when the number of trials is100 (BI) and 200 (BII). On each box plot, the red line, the bottom and top edges of the box represent the median, 25th and 75th percentiles of the TPRs, respectively. The whiskers represent the most extreme values of the TPRs except outliers.
FIGURE 5
FIGURE 5
(A) Grand-average of double-thresholded amplitude coherences (dACs) in the time range (abscissa) of 0.5 s before to 0.5 s after the stimulus onset (0 s) and in the frequency range (ordinate) between 2 Hz and 45 Hz. Note that each pixel value represents a proportion of the corresponding pixel to be in significant clusters among all 250 sets of random sampling and all datasets. (B) Polar plot of the cross-periodograms of one representative dataset (dataset 42). Each dot represents each cross-periodogram and the blue dashed line represents the direction of the estimated phase lag. The distribution of the plot appear shifted from the origin toward the direction at the estimated phase lag. (C) Box plots of amplitudes of cross-periodograms sorted into 9 bins according to these phases relative to angles of phase locking (i.e., phase lags). These 9 bins are successive bins from 0 to pi. On each box plot, the red line, the bottom and top edges of the box represent the median, 25th and 75th percentiles of the amplitudes in each bin, respectively. The whiskers represent the 10th and 90th percentiles.
FIGURE 6
FIGURE 6
Results of the descriptive statistics analysis. (A) Dot plots of means against natural log-transformed coefficients of variance of normalized functional connectivity (FC) values retrieved from the prestimulus FC mask. The plots are well overlapping between ImCoh and wPLI. (B) Dot plots of means against natural log-transformed coefficients of variance of normalized FC values retrieved from the stimulus-induced FC mask. The dot plot of ImCoh appears gradually shifted upward and leftward in comparison with that of wPLI as means of normalized FC values become greater. Note that values increase from right to left in the x-axis of both plots. nMEANs, means of normalized FC values; nCVs, coefficients of variance of normalized FC values.
FIGURE 7
FIGURE 7
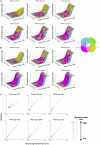
Results of the data simulation of periodograms. (A,B) Surface plots of the true positive rates against numbers of trials and signal-to-noise ratios (SNRs) at each angle in the single-pair simulation (A) and multiple-pair simulation (B). Surfaces of the plots of each functional connectivity (FC) measure colored with the corresponding color in the color map are overlaid as layers so that the measure with the greatest rate is identified in the uppermost layer. Overall, ImCoh and wPLI show higher rates in most situations. ImCoh tends to have higher rates in the multiple-pair simulation or at larger phase lags, whereas wPLI tends to have higher rates in the single-pair simulation or at smaller phase lags. (C) Dot plots of the means against the coefficient of variances of the normalized FCs in the descriptive statistics analysis for the simulated data. The sizes of dots change depending on the SNRs (getting larger as the SNRs become higher). Note that values increase from right to left in the x-axis of all plots. nMEANs, means of normalized FCs; nCVs, coefficients of variance of normalized FCs.

Similar articles

Cited by

References

    1. Almeida M., Bioucas-Dias J., Vigário R. (2013). Separation of phase-locked sources in pseudo-real MEG data. EURASIP J. Adv. Signal Process. 2013:32 10.1186/1687-6180-2013-32 - DOI
    1. Andrew C., Pfurtscheller G. (1996). Event-related coherence as a tool for studying dynamic interaction of brain regions. Electroencephalogr. Clin. Neurophysiol. 98 144–148. 10.1016/0013-4694(95)00228-6 - DOI - PubMed
    1. Ard T., Carver F. W., Holroyd T., Horwitz B., Coppola R. (2015). Detecting functional connectivity during audiovisual integration with MEG: a comparison of connectivity metrics. Brain Connect. 5 336–348. 10.1089/brain.2014.0296 - DOI - PMC - PubMed
    1. Bakhshayesh H., Fitzgibbon S. P., Janani A. S., Grummett T. S., Pope K. J. (2019). Detecting synchrony in EEG: a comparative study of functional connectivity measures. Comput. Biol. Med. 105 1–15. 10.1016/j.compbiomed.2018.12.005 - DOI - PubMed
    1. Benjamini Y., Hochberg Y. (1995). Controlling the false discovery rate: a practical and powerful approach to multiple testing. J. R. Stat. Soc. Ser. B 57 289–300. 10.1111/j.2517-6161.1995.tb02031.x - DOI

LinkOut - more resources