

Association between neutrophil-to-lymphocyte ratio, platelet-to-lymphocyte ratio, and diabetic retinopathy among diabetic patients without a related family history
- PMID: 32636938
- PMCID: PMC7331251
- DOI: 10.1186/s13098-020-00562-y
Association between neutrophil-to-lymphocyte ratio, platelet-to-lymphocyte ratio, and diabetic retinopathy among diabetic patients without a related family history
Abstract
Background: Diabetic retinopathy (DR) is a specific neurovascular complication of diabetes mellitus (DM). Clinically, family history is a widely recognized risk factor for DR, assisting diagnosis and risk strata. However, among a great amount of DR patients without hereditary history like hypertension and diabetes, direct and simple risk factors to assist clinical decisions are still required. Herein, we intend to investigate the associated risk factors for these DR patients based on systemic inflammatory response indexes, neutrophil-to-lymphocyte ratio (NLR) and platelet-to-lymphocyte ratio (PLR).
Methods: We consecutively enrolled 1030 patients with a definite diagnosis of type 2 diabetes mellitus (T2DM) from the endocrinology department of the Second hospital of People in Yun Nan. Based on funduscopy and family history checking, we excluded patients with a family history of hypertension and diabetes and finally enrolled 264 patients with DR and 206 patients with non-diabetic retinopathy (NDR). Through correlation analysis, univariate and multivariate regression, we further explore the association between NLR, PLR, and DR. On top of that, we investigate the effect of NLR and PLR on risk reclassification of DR.
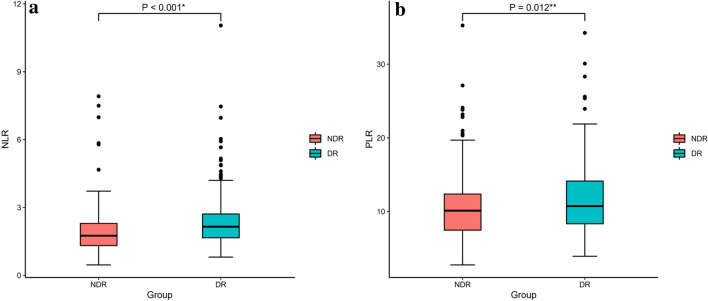
Results: Compared with NDR patients, NLR and PLR levels are significantly higher among DR patients (NLR: 2.36 ± 1.16 in DR group versus 1.97 ± 1.06 in NDR group, p < 0.001; PLR: 11.62 ± 4.55 in DR group versus10.56 ± 4.45 in NDR group, p = 0.012). According to univariate analysis, NLR and PLR add risks to DR. After fully adjusting co-founders, NLR, as both continuous and categorical variate, remains an independent risk factor for DR (OR (95%CI): 1.37 (1.06, 1.78) P = 0.018). And though PLR was not independently associated with DR as a continuous variable (OR (95%CI) 1.05 (0.99, 1.11) p = 0.135), the highest quantile of PLR add two-fold increased risk (OR (95%CI) 2.20 (1.05, 4.59) p = 0.037) in the fully adjusted model for DR. In addition, addition of PLR and NLR to the established factor hemoglobin (Hb) improved the discriminability of the model and assisted the reclassification of DR. After combining PLR and NLR the Area under curve (AUC) of Hb based model raised from 0.76 to 0.78, with a category-free net reclassification improvement (NRI) of 0.532 (p < 0.001) and integrated discrimination improvement (IDI) of 0.029 (p < 0.001).
Conclusions: Systemic inflammatory response indexes NLR and PLR were associated with the presence of DR among patients without associated family history and contributed to improvements in reclassification of DR in addition to Hb.
Keywords: Diabetic retinopathy; Family history; Hemoglobin; Neutrophil-to-lymphocyte ratio; Platelet-to-lymphocyte ratio; Type 2 diabetes mellitus.
© The Author(s) 2020.
Conflict of interest statement
Competing interestsThe authors declare that they have no competing interests.
Figures

Similar articles
-
Exploring leukocyte differential count ratio profiles as inflammatory biomarkers in diabetic retinopathy: a systematic review and meta-analysis.BMC Ophthalmol. 2025 May 1;25(1):265. doi: 10.1186/s12886-025-04075-y. BMC Ophthalmol. 2025. PMID: 40312699 Free PMC article.
-
Systemic immune-inflammation index, neutrophil-to-lymphocyte ratio, and platelet-to-lymphocyte ratio in patients with type 2 diabetes at different stages of diabetic retinopathy.Int J Ophthalmol. 2024 May 18;17(5):877-882. doi: 10.18240/ijo.2024.05.12. eCollection 2024. Int J Ophthalmol. 2024. PMID: 38766329 Free PMC article.
-
The Platelet-to-Lymphocyte Ratio Predicts Diabetic Retinopathy in Type 2 Diabetes Mellitus.Diabetes Metab Syndr Obes. 2022 Nov 22;15:3617-3626. doi: 10.2147/DMSO.S378284. eCollection 2022. Diabetes Metab Syndr Obes. 2022. PMID: 36444389 Free PMC article.
-
Characterization of peripheral blood inflammatory indicators and OCT imaging biological markers in diabetic retinopathy with or without nephropathy.Front Endocrinol (Lausanne). 2023 Jul 3;14:1160615. doi: 10.3389/fendo.2023.1160615. eCollection 2023. Front Endocrinol (Lausanne). 2023. PMID: 37465123 Free PMC article.
-
Exploring the correlations between six serological inflammatory markers and different stages of type 2 diabetic retinopathy.Sci Rep. 2025 Jan 10;15(1):1567. doi: 10.1038/s41598-025-85164-2. Sci Rep. 2025. PMID: 39794420 Free PMC article.
Cited by
-
Influence of Fibrinogen/Albumin Ratio and Fibrinogen/Pre-Albumin Ratio on Cardiac Autonomic Neuropathy in Type 2 Diabetes.Diabetes Metab Syndr Obes. 2023 Oct 18;16:3249-3259. doi: 10.2147/DMSO.S431551. eCollection 2023. Diabetes Metab Syndr Obes. 2023. PMID: 37872973 Free PMC article.
-
The Predictors of Early Treatment Effectiveness of Intravitreal Bevacizumab Application in Patients with Diabetic Macular Edema.Diagnostics (Basel). 2024 May 10;14(10):992. doi: 10.3390/diagnostics14100992. Diagnostics (Basel). 2024. PMID: 38786290 Free PMC article.
-
Exploring leukocyte differential count ratio profiles as inflammatory biomarkers in diabetic retinopathy: a systematic review and meta-analysis.BMC Ophthalmol. 2025 May 1;25(1):265. doi: 10.1186/s12886-025-04075-y. BMC Ophthalmol. 2025. PMID: 40312699 Free PMC article.
-
Exploring the link: Hemogram-derived markers in type 2 diabetes mellitus and its complications.World J Diabetes. 2025 Jul 15;16(7):105233. doi: 10.4239/wjd.v16.i7.105233. World J Diabetes. 2025. PMID: 40697587 Free PMC article. Review.
-
Assessment of Hematological Profiles and Prognostic Role of Hemogram-Derived Novel Markers for Diabetes Mellitus and Its Complications Among Type 2 Diabetes Mellitus Adult Patients Attending Bishoftu General Hospital, Central, Ethiopia: A Comparative Cross-Sectional Study.J Blood Med. 2023 Dec 28;14:681-699. doi: 10.2147/JBM.S435452. eCollection 2023. J Blood Med. 2023. PMID: 38164459 Free PMC article.
References
-
- Chinese Medical Association Diabetes Division Retinopathy Group Expert consensus on prevention and treatment of diabetic retinopathy. Chinese J Diabet Mellitus. 2018;10:241–247.
-
- Wat N, Wong RL, Wong IY. Associations between diabetic retinopathy and systemic risk factors. Hong Kong Med J. 2016;22:589–599. - PubMed
LinkOut - more resources
Full Text Sources
