Review
. 2020 Jun 12:18:1569-1576.
doi: 10.1016/j.csbj.2020.06.014. eCollection 2020.

Handling multi-mapped reads in RNA-seq

Affiliations
Review

Handling multi-mapped reads in RNA-seq

Gabrielle Deschamps-Francoeur et al. Comput Struct Biotechnol J. .

Abstract

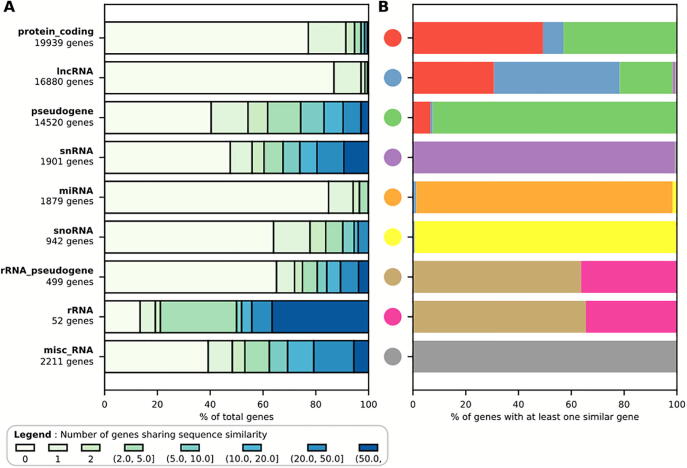
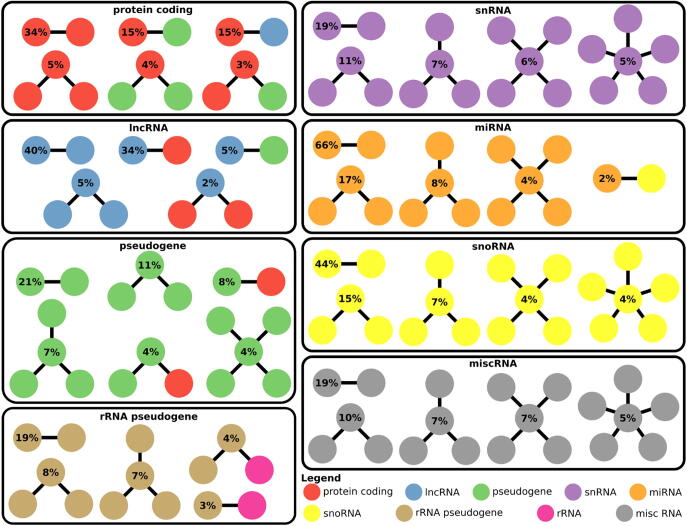
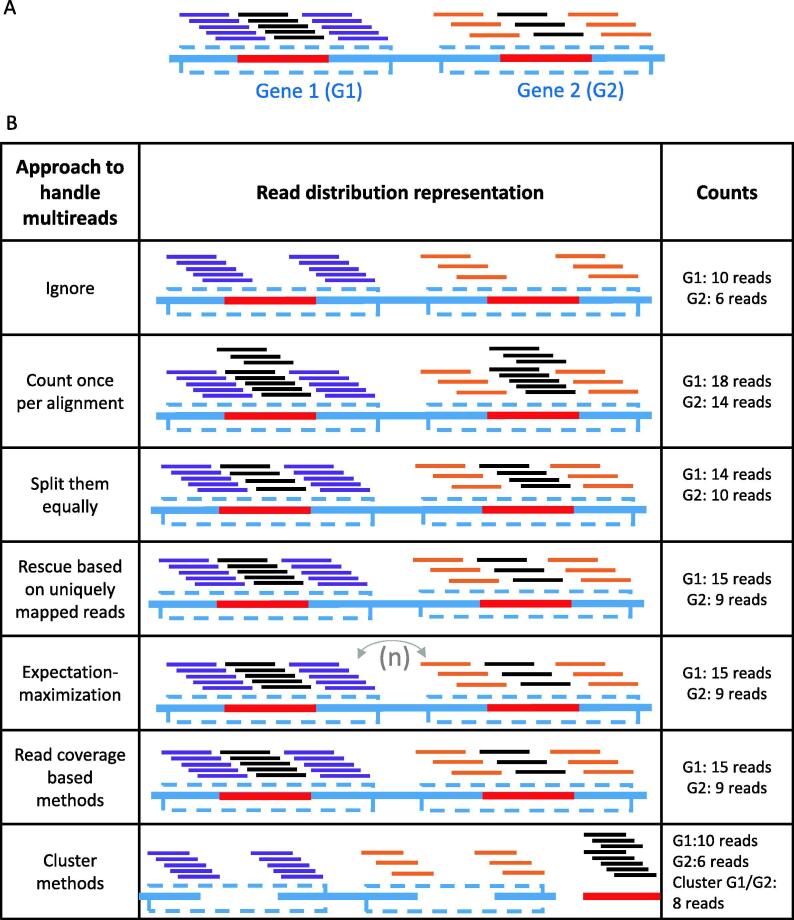
Many eukaryotic genomes harbour large numbers of duplicated sequences, of diverse biotypes, resulting from several mechanisms including recombination, whole genome duplication and retro-transposition. Such repeated sequences complicate gene/transcript quantification during RNA-seq analysis due to reads mapping to more than one locus, sometimes involving genes embedded in other genes. Genes of different biotypes have dissimilar levels of sequence duplication, with long-noncoding RNAs and messenger RNAs sharing less sequence similarity to other genes than biotypes encoding shorter RNAs. Many strategies have been elaborated to handle these multi-mapped reads, resulting in increased accuracy in gene/transcript quantification, although separate tools are typically used to estimate the abundance of short and long genes due to their dissimilar characteristics. This review discusses the mechanisms leading to sequence duplication, the biotypes affected, the computational strategies employed to deal with multi-mapped reads and the challenges that still remain to be overcome.

Keywords: Duplicated genes; Expectation–maximization algorithm; Gene isoforms; Multi-mapped reads; Noncoding RNAs; RNA-seq.


Conflict of interest statement

The authors declare that they have no known competing financial interests or personal relationships that could have appeared to influence the work reported in this paper.

Figures

Fig. 1
Fig. 1
Proportion of human genes with sequence similarity to other genes, per biotype. (A) Stacked bar chart displaying the percentage of genes per biotype with specified number of genes sharing sequence similarity. (B) For each biotype and for all genes of that biotype that share similarity with another human gene, the distribution of the biotypes of their similar genes is shown. To calculate gene similarity, human genes were obtained from the Ensembl annotation (version 99). Pairwise sequence similarity was measured with BLAST (version 2.9.0 from bioconda). The BLAST database was composed of the genomic sequence from each gene, and the spliced sequence of their transcript having the highest number of exons. The spliced transcript is used to identify processed pseudogenes by reducing gap bias. The blastn algorithm was run for all pairs of sequences in the database, with 1e-20 as a minimum e-value, and keeping only the best hit for each pairwise comparison. Each BLAST hit was scored as the average of the alignment length divided by the whole length of the sequence and multiplied by the percentage of identical matches for each sequence in the pair. Results were then parsed, eliminating self-hits (a gene with itself or its transcript), and analysed using a BLAST pairwise score threshold of 60%.
Fig. 2
Fig. 2
Most common sequence similarity relationships between human genes, per biotype. The network of sequence similarity relationships was measured for all human genes as described in Fig. 1. The most common sequence similarity patterns are illustrated here, per biotype.
Fig. 3
Fig. 3
Strategies to deal with multi-mapped reads. (A) Example of two genes sharing a duplicated sequence and the distribution of RNA-seq reads originating from them. The two genes are represented by boxes outlined by dashed lines and their common sequence is illutrated by a red line. The reads are represented by lines above the genes, purple for reads that are unique to Gene 1, orange for reads that are unique to Gene 2 and black for reads that are common to genes 1 and 2. (B) General classes to handle multi-mapped reads include ignoring them, counting them once per alignment, splitting them equally between the alignments, rescuing the reads based on uniquely mapped reads of the gene, expectation–maximization approaches, rescuing methods based on read coverage in flanking regions and clustering methods that group together genes/transcripts with shared sequences. (For interpretation of the references to colour in this figure legend, the reader is referred to the web version of this article.)

References

    1. Ohta T. Role of gene duplication in evolution. Genome. 1989;31:304–310. - PubMed
    1. Magadum S., Banerjee U., Murugan P., Gangapur D., Ravikesavan R. Gene duplication as a major force in evolution. J Genet. 2013;92:155–161. - PubMed
    1. Treangen T.J., Salzberg S.L. Repetitive DNA and next-generation sequencing: computational challenges and solutions. Nat Rev Genet. 2011;13:36–46. - PMC - PubMed
    1. Dharshini S.A.P., Taguchi Y.H., Gromiha M.M. Identifying suitable tools for variant detection and differential gene expression using RNA-seq data. Genomics. 2020;112:2166–2172. - PubMed
    1. McDermaid A., Chen X., Zhang Y., Wang C., Gu S. A new machine learning-based framework for mapping uncertainty analysis in RNA-Seq read alignment and gene expression estimation. Front Genet. 2018;9:313. - PMC - PubMed