. 2020 Jul 1:8:27.
doi: 10.1038/s41413-020-0102-7. eCollection 2020.

Aging and menopause reprogram osteoclast precursors for aggressive bone resorption

Affiliations

Aging and menopause reprogram osteoclast precursors for aggressive bone resorption

Anaïs Marie Julie Møller et al. Bone Res. .

Abstract

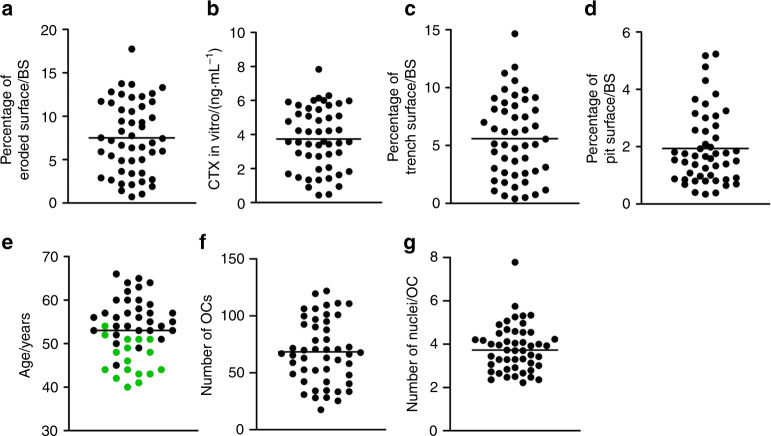
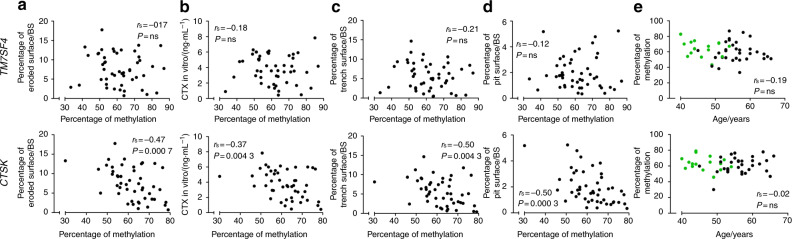
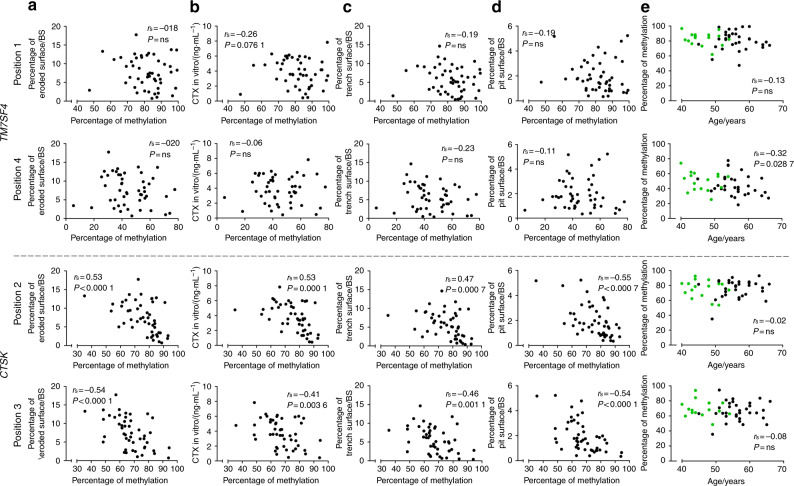
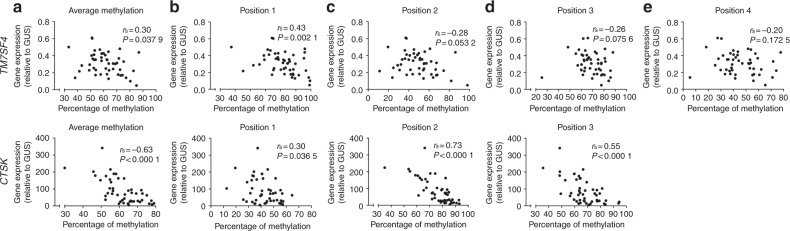
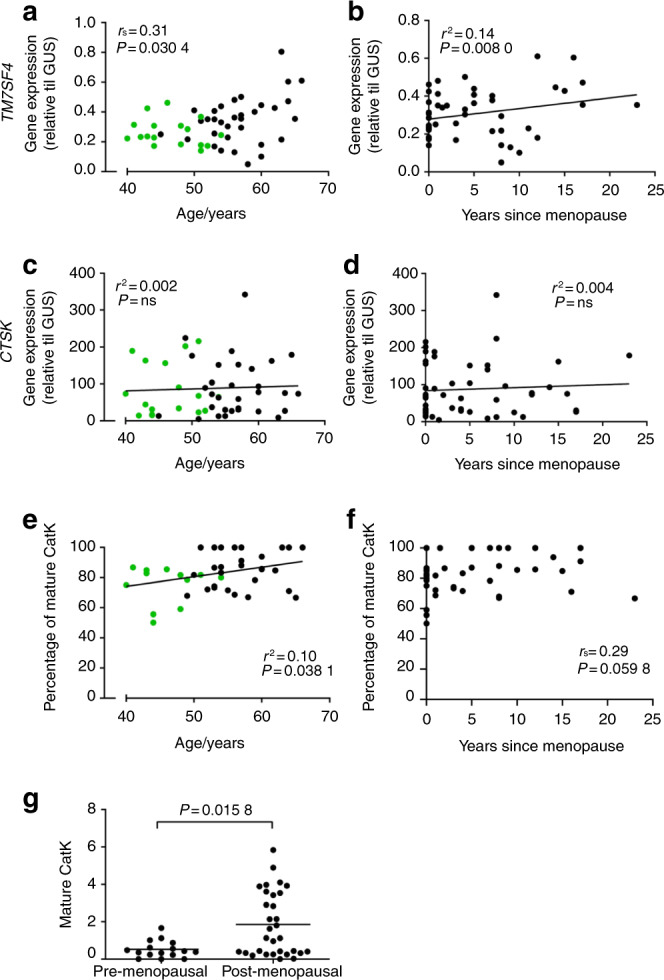
Women gradually lose bone from the age of ~35 years, but around menopause, the rate of bone loss escalates due to increasing bone resorption and decreasing bone formation levels, rendering these individuals more prone to developing osteoporosis. The increased osteoclast activity has been linked to a reduced estrogen level and other hormonal changes. However, it is unclear whether intrinsic changes in osteoclast precursors around menopause can also explain the increased osteoclast activity. Therefore, we set up a protocol in which CD14+ blood monocytes were isolated from 49 female donors (40-66 years old). Cells were differentiated into osteoclasts, and data on differentiation and resorption activity were collected. Using multiple linear regression analyses combining in vitro and in vivo data, we found the following: (1) age and menopausal status correlate with aggressive osteoclastic bone resorption in vitro; (2) the type I procollagen N-terminal propeptide level in vivo inversely correlates with osteoclast resorption activity in vitro; (3) the protein level of mature cathepsin K in osteoclasts in vitro increases with age and menopause; and (4) the promoter of the gene encoding the dendritic cell-specific transmembrane protein is less methylated with age. We conclude that monocytes are "reprogrammed" in vivo, allowing them to "remember" age, the menopausal status, and the bone formation status in vitro, resulting in more aggressive osteoclasts. Our discovery suggests that this may be mediated through DNA methylation. We suggest that this may have clinical implications and could contribute to understanding individual differences in age- and menopause-induced bone loss.

Keywords: Bone; Osteoporosis.


Conflict of interest statement

Competing interestsThe authors declare no competing interests.

Figures

Fig. 1
Fig. 1
Variation of results obtained using OCs generated from different donors for the given variables: (a) percent eroded surface/bone surface (mean = 7.51); (b) CTX level in vitro (mean = 3.74); (c) percent trench surface/bone surface (mean = 5.60); (d) percent pit surface/bone surface (median = 1.66); (e) donor age (mean = 53.0); (f) mean number of OCs per vision field (mean = 68.4); and (g) mean number of nuclei/OC (median = 3.73). In (e), green dots indicate premenopausal donors, while black dots indicate postmenopausal donors. Each dot represents the results obtained from OCs generated from an individual donor (n = 49)
Fig. 2
Fig. 2
Average DNA methylation of CpGs in the promoter of the TM7SF4 gene, encoding DC-STAMP, (top row) and that of the CTSK gene, encoding cathepsin K, (bottom row) compared with (a) percent eroded surface/bone surface, (b) CTX level in vitro, (c) percent trench surface/bone surface, (d) percent pit surface/bone surface, and (e) donor age (years). In (e), green dots indicate premenopausal donors, while black dots indicate postmenopausal donors. Statistical correlation analyses were performed using Spearman’s rank correlation (rs). Each dot represents the results obtained from OCs generated from an individual donor (n = 49)
Fig. 3
Fig. 3
DNA methylation status of selected CpG sites in the promoter of the TM7SF4 gene, encoding DC-STAMP, (top rows) and that of the CTSK gene, encoding cathepsin K, (bottom rows) compared with (a) percent eroded surface/bone surface, (b) CTX level in vitro, (c) percent trench surface/bone surface, (d) percent pit surface/bone surface, and (e) donor age (years). In (e), green dots indicate premenopausal donors, while black dots indicate postmenopausal donors. Statistical correlation analyses were performed using Spearman’s rank correlation (rs). Each dot represents the results obtained from OCs generated from an individual donor (n = 49). The selected CpG sites are indicated as “positions”. Only relevant positions were selected to be shown in this figure. The correlations of positions that are shown here are significant or near significant. Positions that are not shown here did not correlate with any of the abovementioned variables
Fig. 4
Fig. 4
Comparison of the expression of the TM7SF4 gene, encoding DC-STAMP, (top row) and the CTSK gene, encoding cathepsin K, (bottom row) with the DNA methylation status of their promoter regions based on (a) the average or (be) the individual CpG sites. Statistical correlation analyses were performed using Spearman’s rank correlation (rs). Each dot represents the results obtained from OCs generated from an individual donor (n = 49). The CpG sites are indicated as “positions”
Fig. 5
Fig. 5
Comparison of the gene expression level of the TM7SF4 gene, encoding DC-STAMP, with (a) the donor age, or (b) the number of years since menopause (n = 48). Comparison of the gene expression level of the CTSK gene, encoding cathepsin K, with (c) the donor age, or (d) the number of years since menopause (n = 49). Comparison of the percentage of mature cathepsin K (of the total cathepsin K for each donor) within each OC culture, as determined by Western blotting with (e) the donor age (n = 46) and (f) the number of years since menopause (n = 46). (g) Comparison of the relative amount of mature cathepsin K (normalized to the β-actin level) between pre- and postmenopausal women as determined by Western blotting (n = 46). In a, c, and e, green dots indicate premenopausal donors, while black dots indicate postmenopausal donors. Statistical correlation analyses were performed using either Spearman’s rank correlation (rs) or Pearson’s correlation (r2). Comparisons between two groups were performed using the Mann–Whitney test. One data point in a was excluded using the ROUT outlier test (Q = 2%). Each dot represents the results obtained from OCs generated from an individual donor

References

    1. Boyle WJ, Simonet WS, Lacey DL. Osteoclast differentiation and activation. Nature. 2003;423:337–342. doi: 10.1038/nature01658. - DOI - PubMed
    1. Katsimbri P. The biology of normal bone remodelling. Eur. J. Cancer Care. 2017;26:e12740. - PubMed
    1. Howard GA, Bottemiller BL, Turner RT, Rader JI, Baylink DJ. Parathyroid hormone stimulates bone formation and resorption in organ culture: evidence for a coupling mechanism. Proc. Natl Acad. Sci. 1981;78:3204–3208. - PMC - PubMed
    1. Parfitt AM, Travers R, Rauch F, Glorieux FH. Structural and cellular changes during bone growth in healthy children. Bone. 2000;27:487–494. - PubMed
    1. Riggs BL, Khosla S, Melton LJ. Sex steroids and the construction and conservation of the adult skeleton. Endocr. Rev. 2002;23:279–302. - PubMed