. 2020 Oct;68(10):2148-2166.
doi: 10.1002/glia.23883. Epub 2020 Jul 8.

Genetic driver mutations introduced in identical cell-of-origin in murine glioblastoma reveal distinct immune landscapes but similar response to checkpoint blockade

Affiliations

Genetic driver mutations introduced in identical cell-of-origin in murine glioblastoma reveal distinct immune landscapes but similar response to checkpoint blockade

Zhihong Chen et al. Glia. 2020 Oct.

Abstract

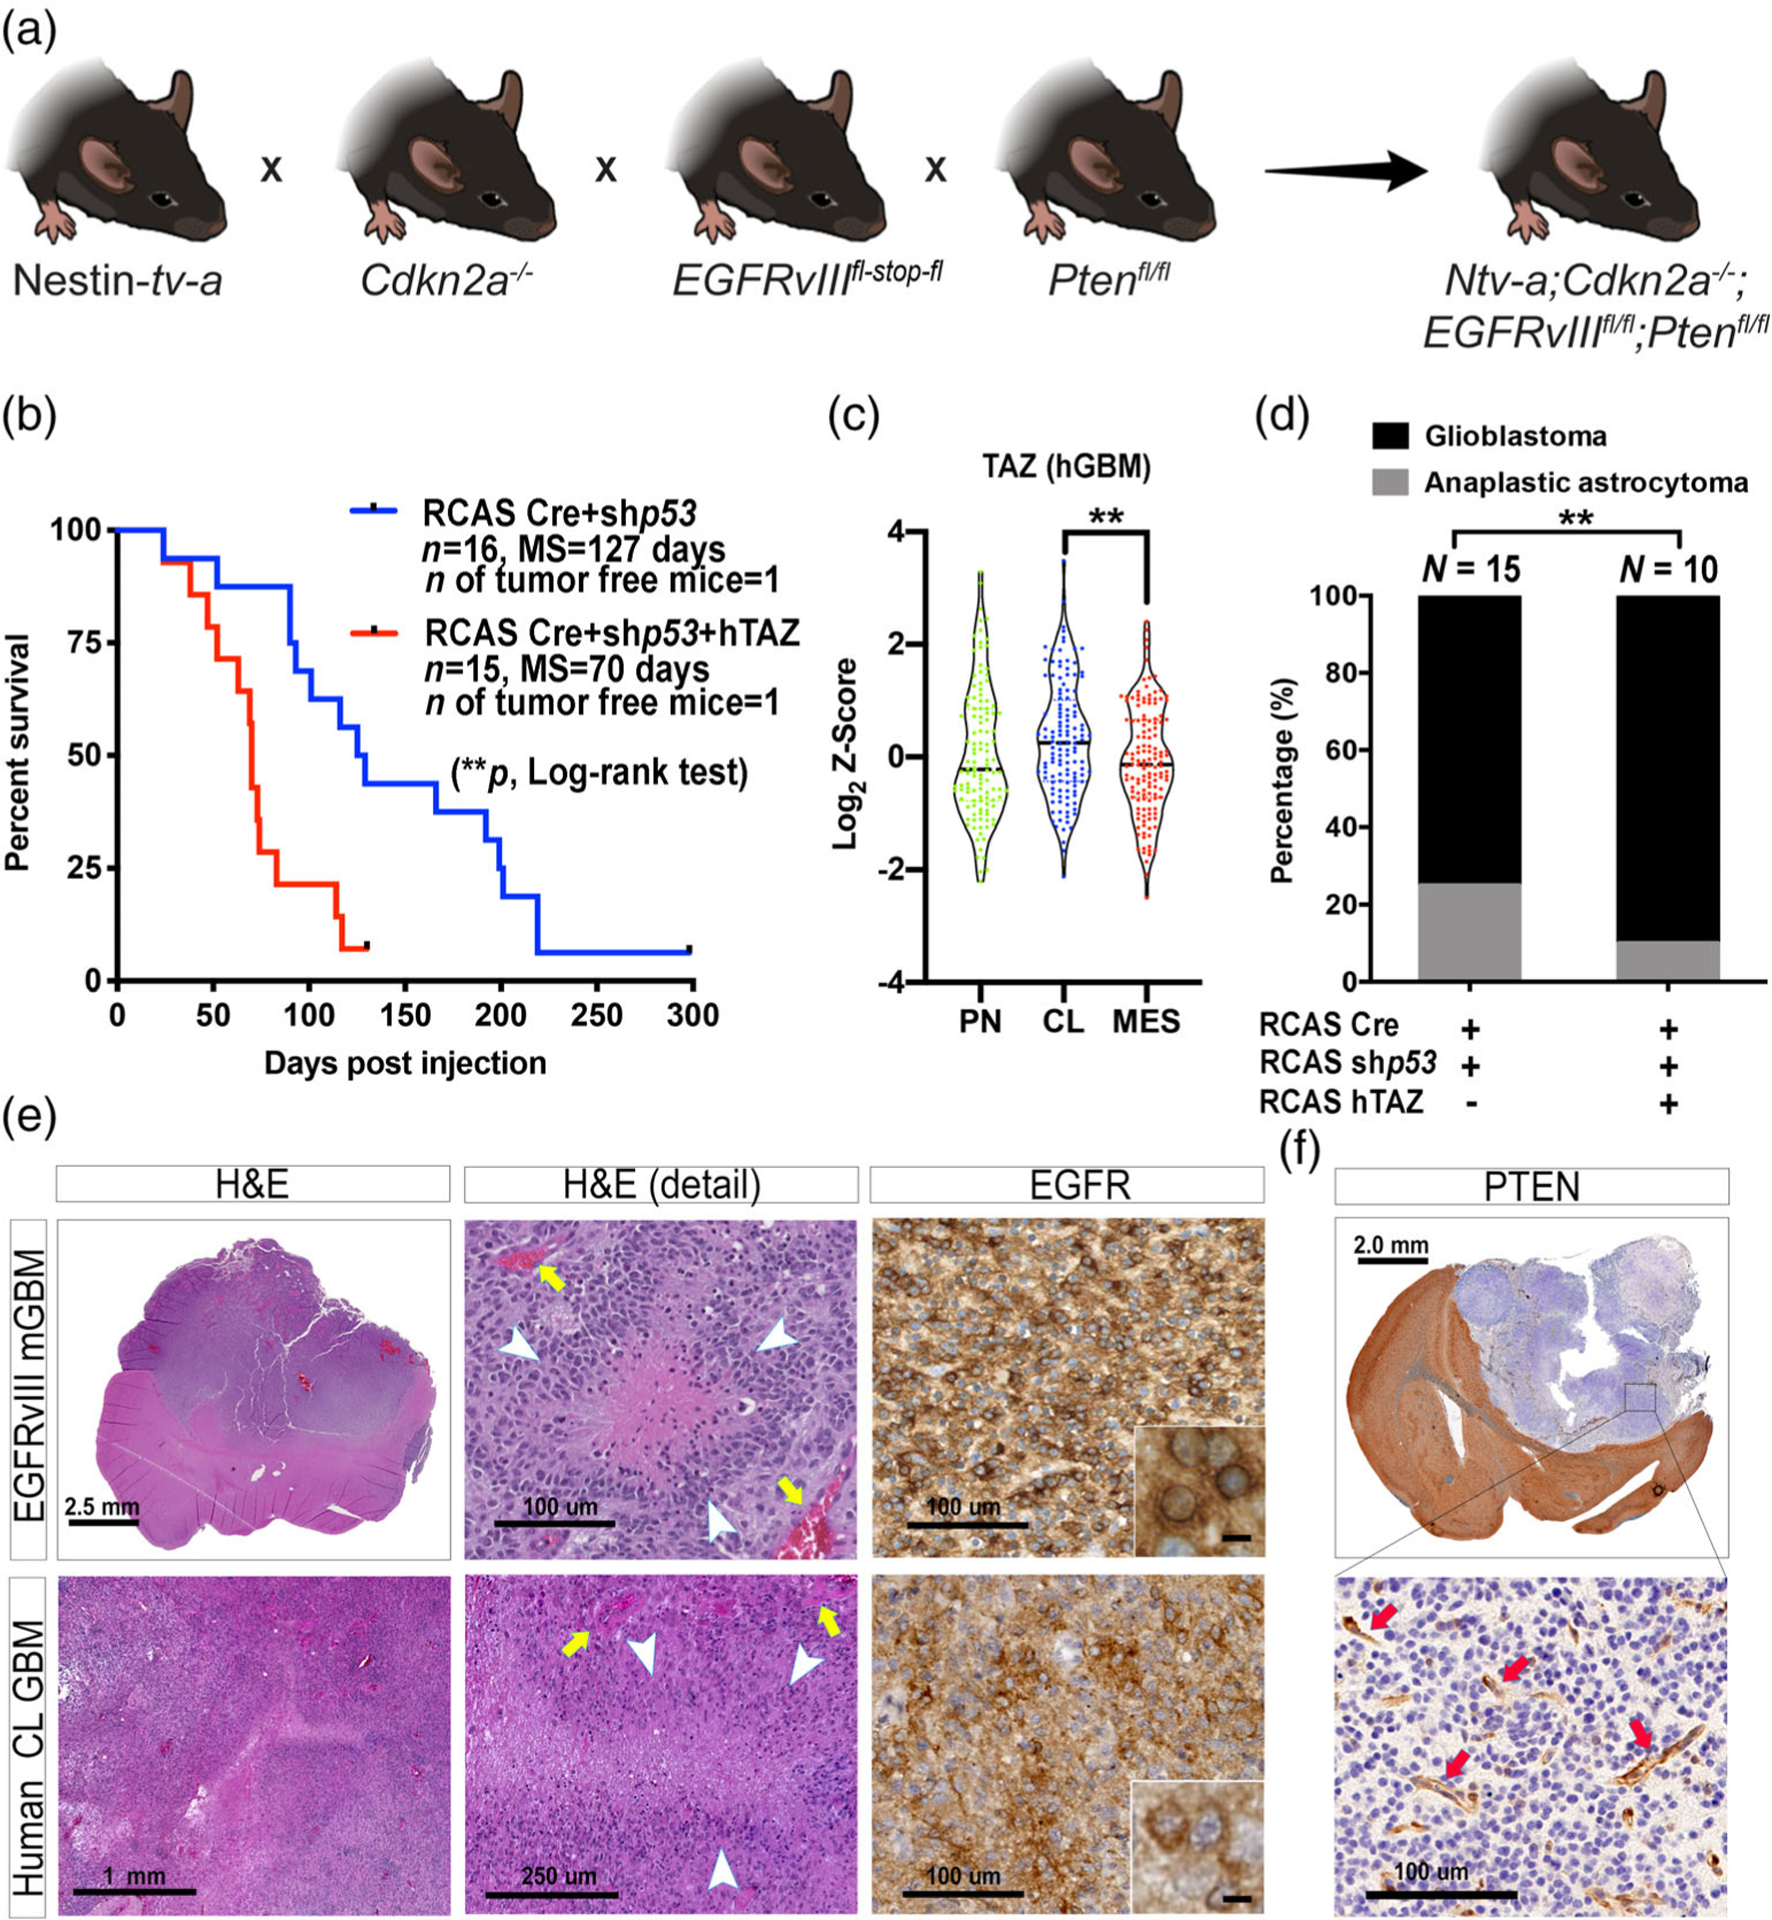
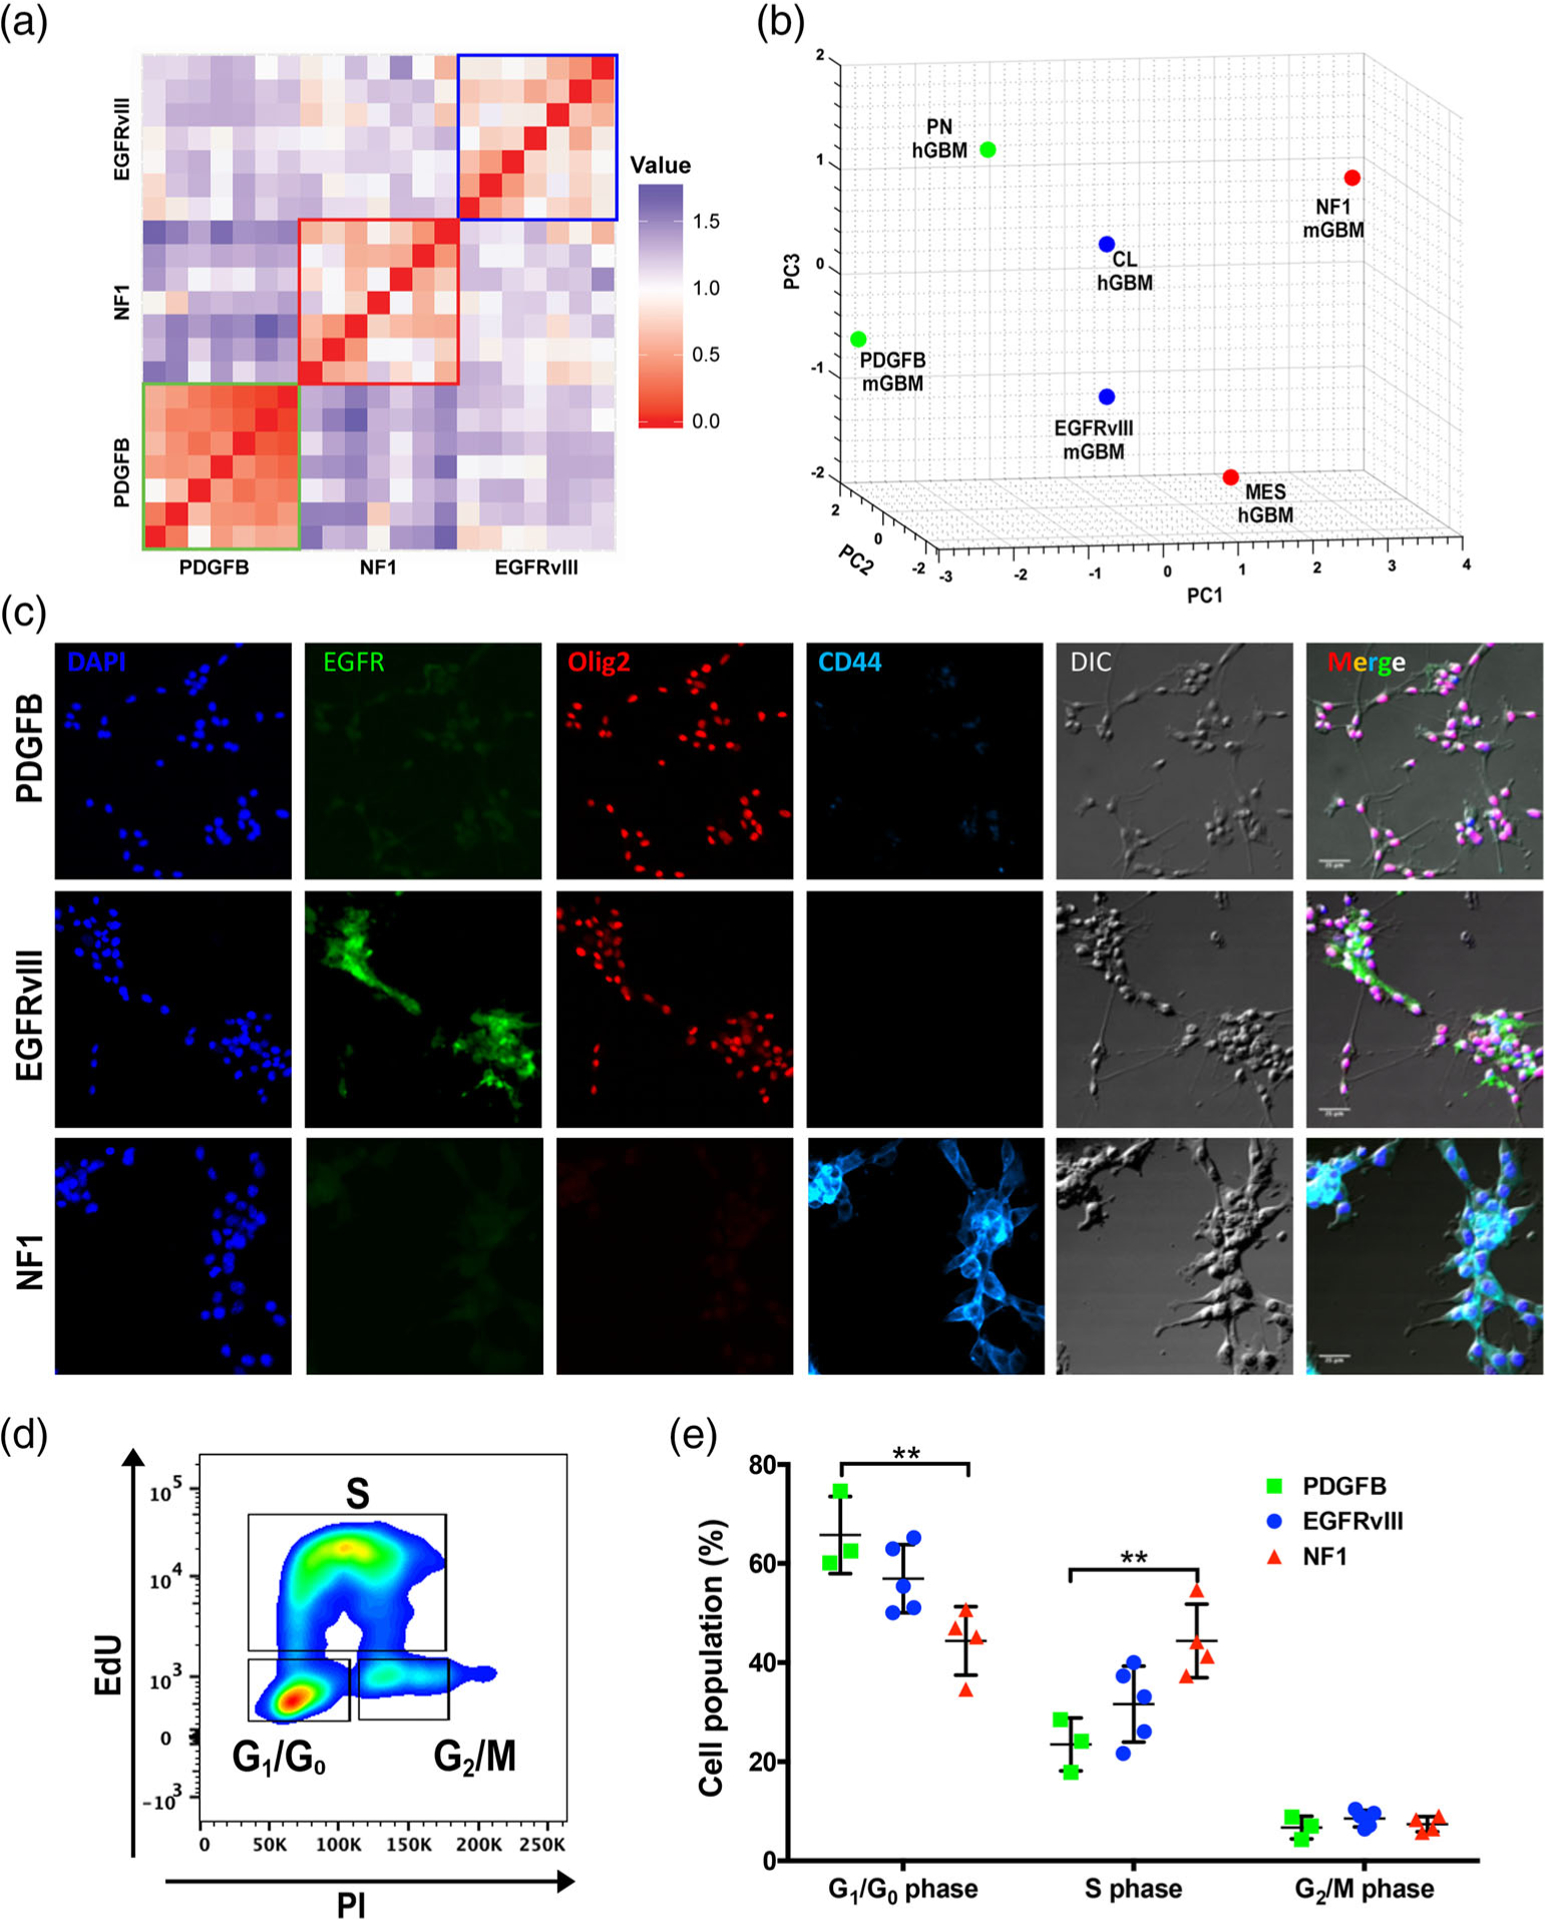
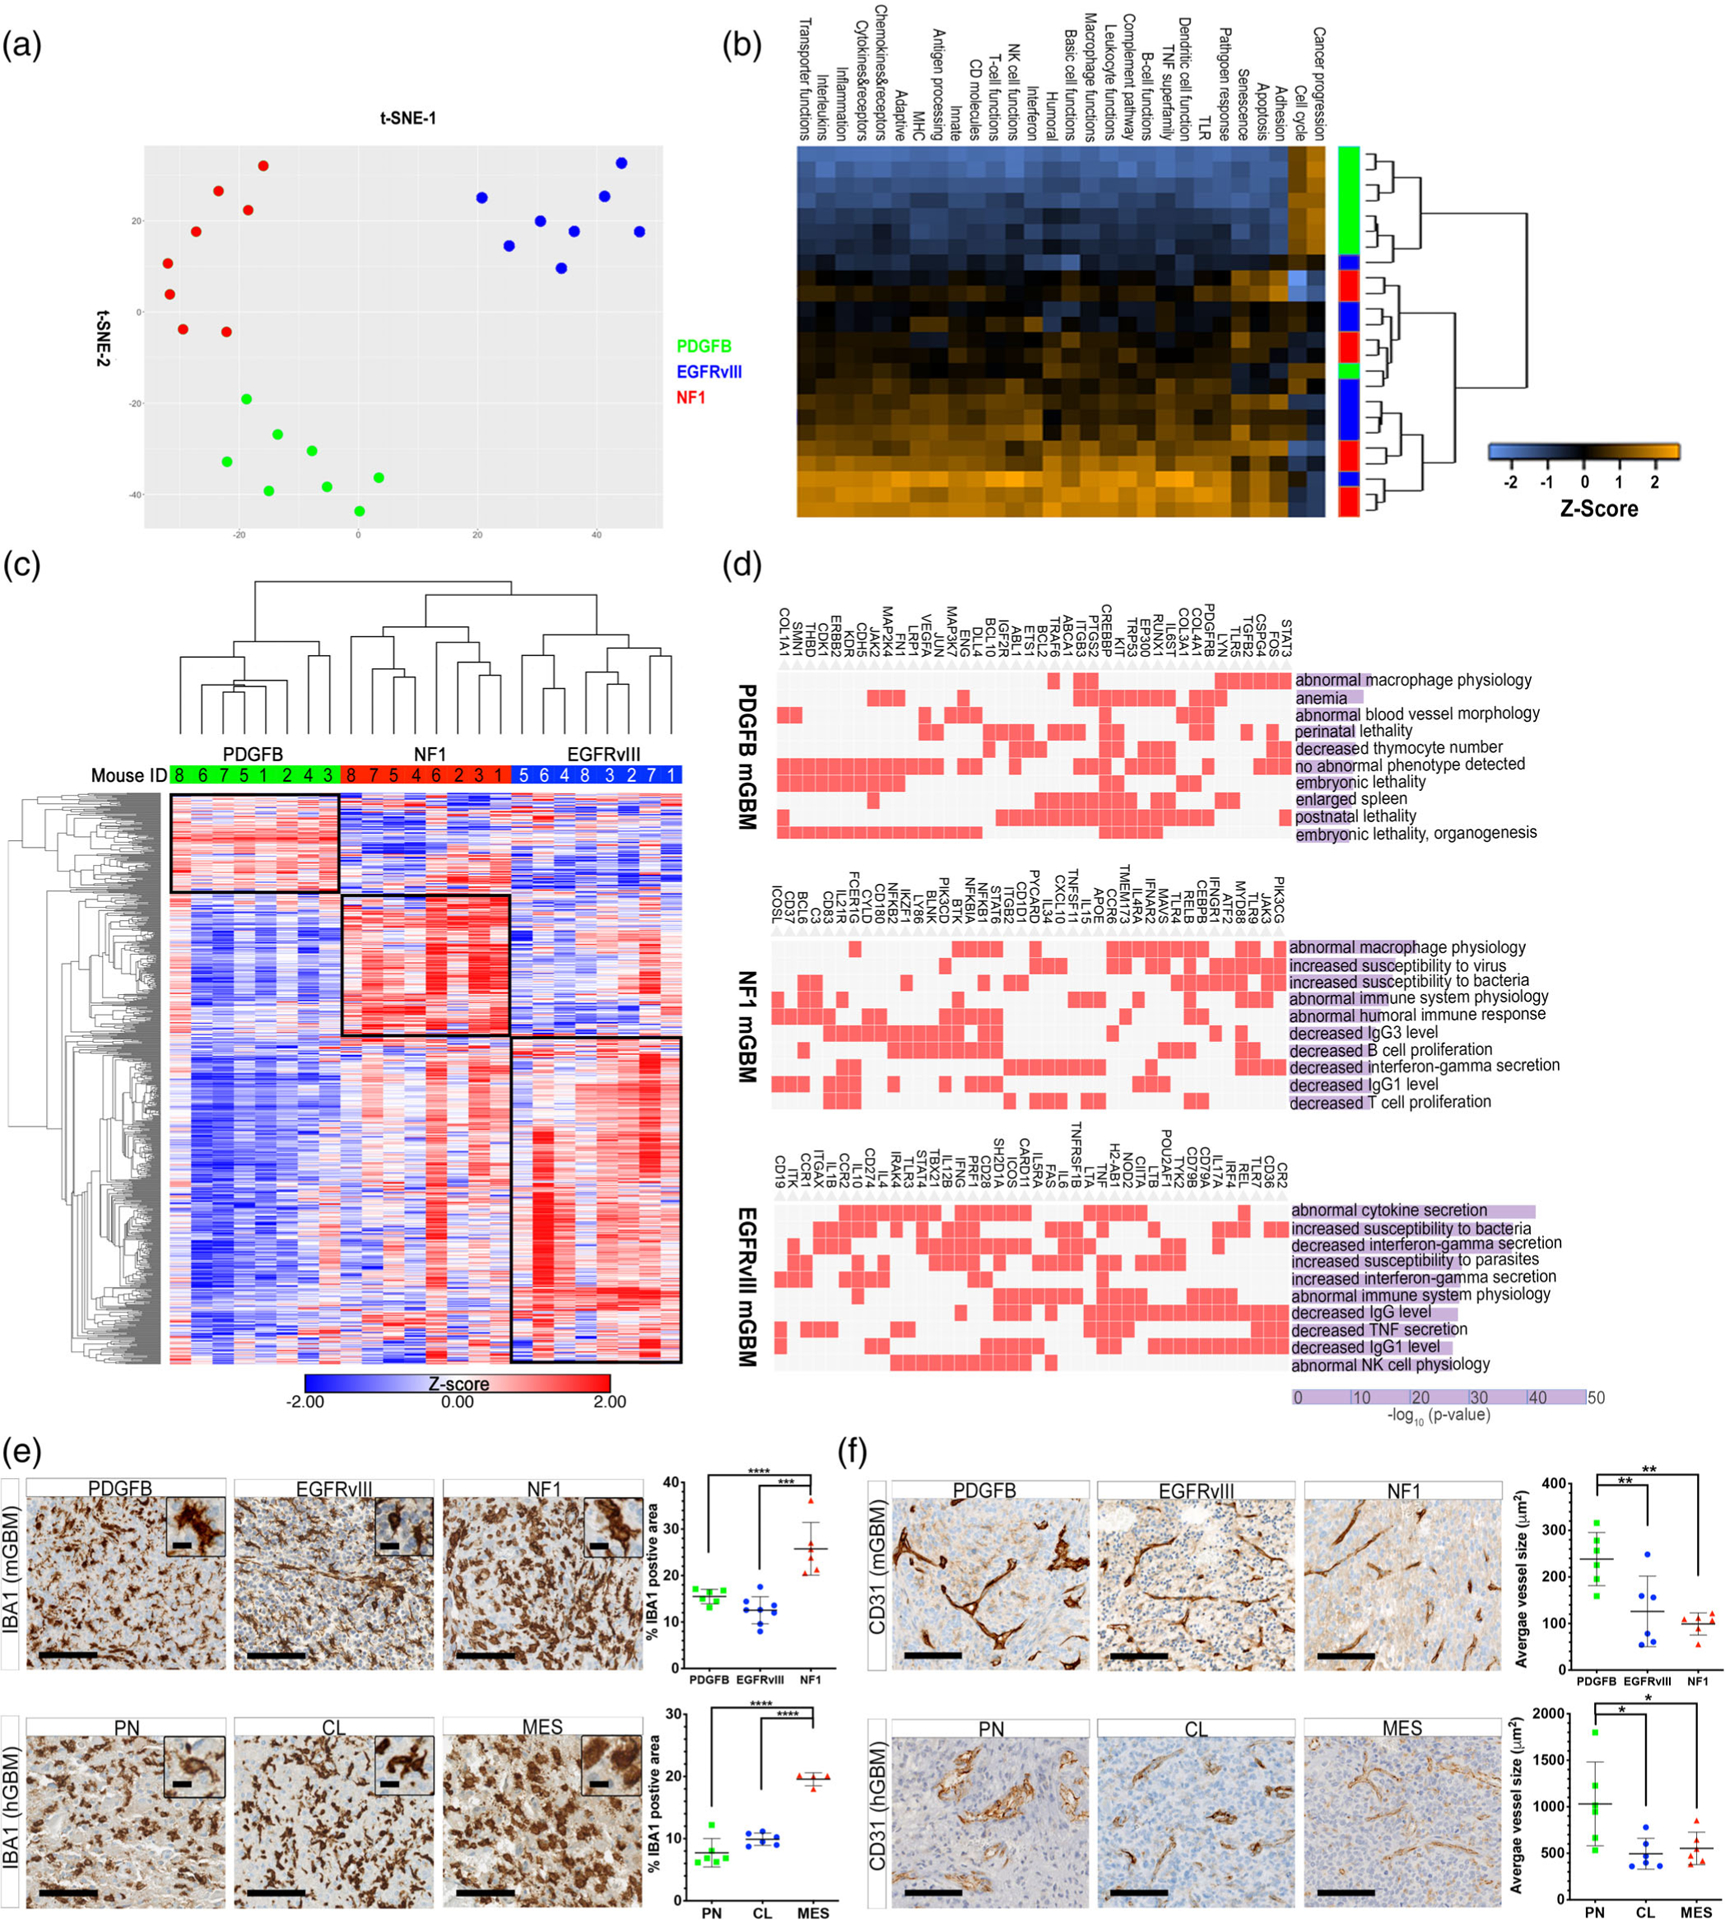
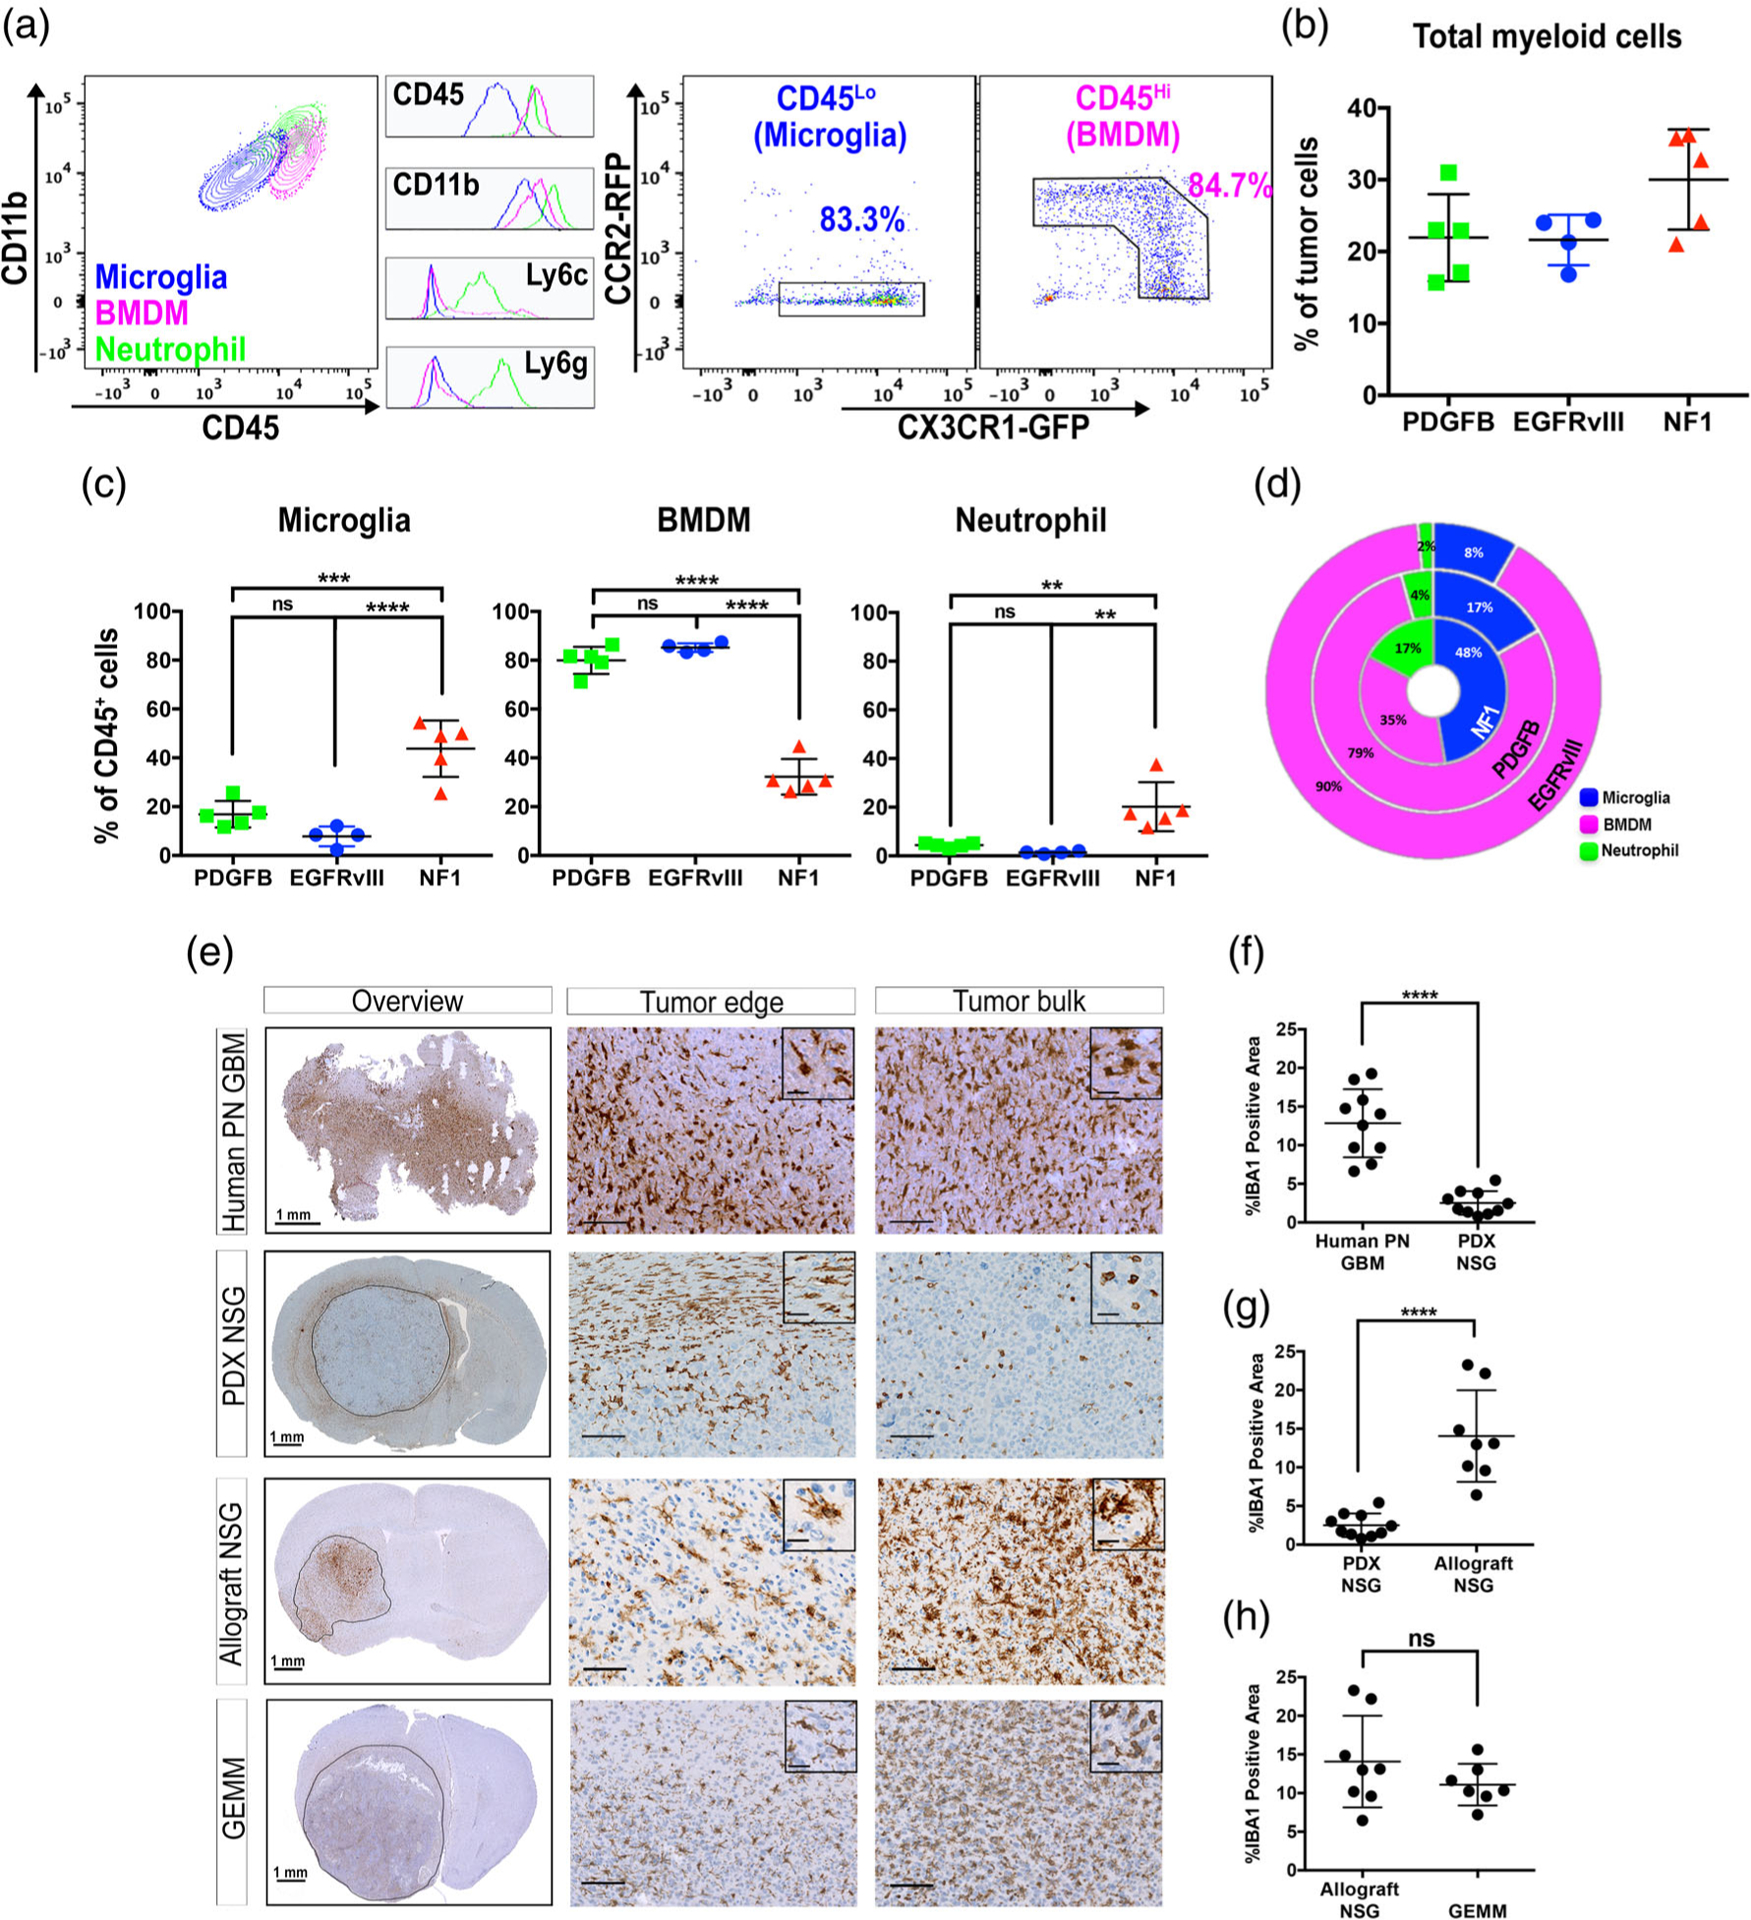
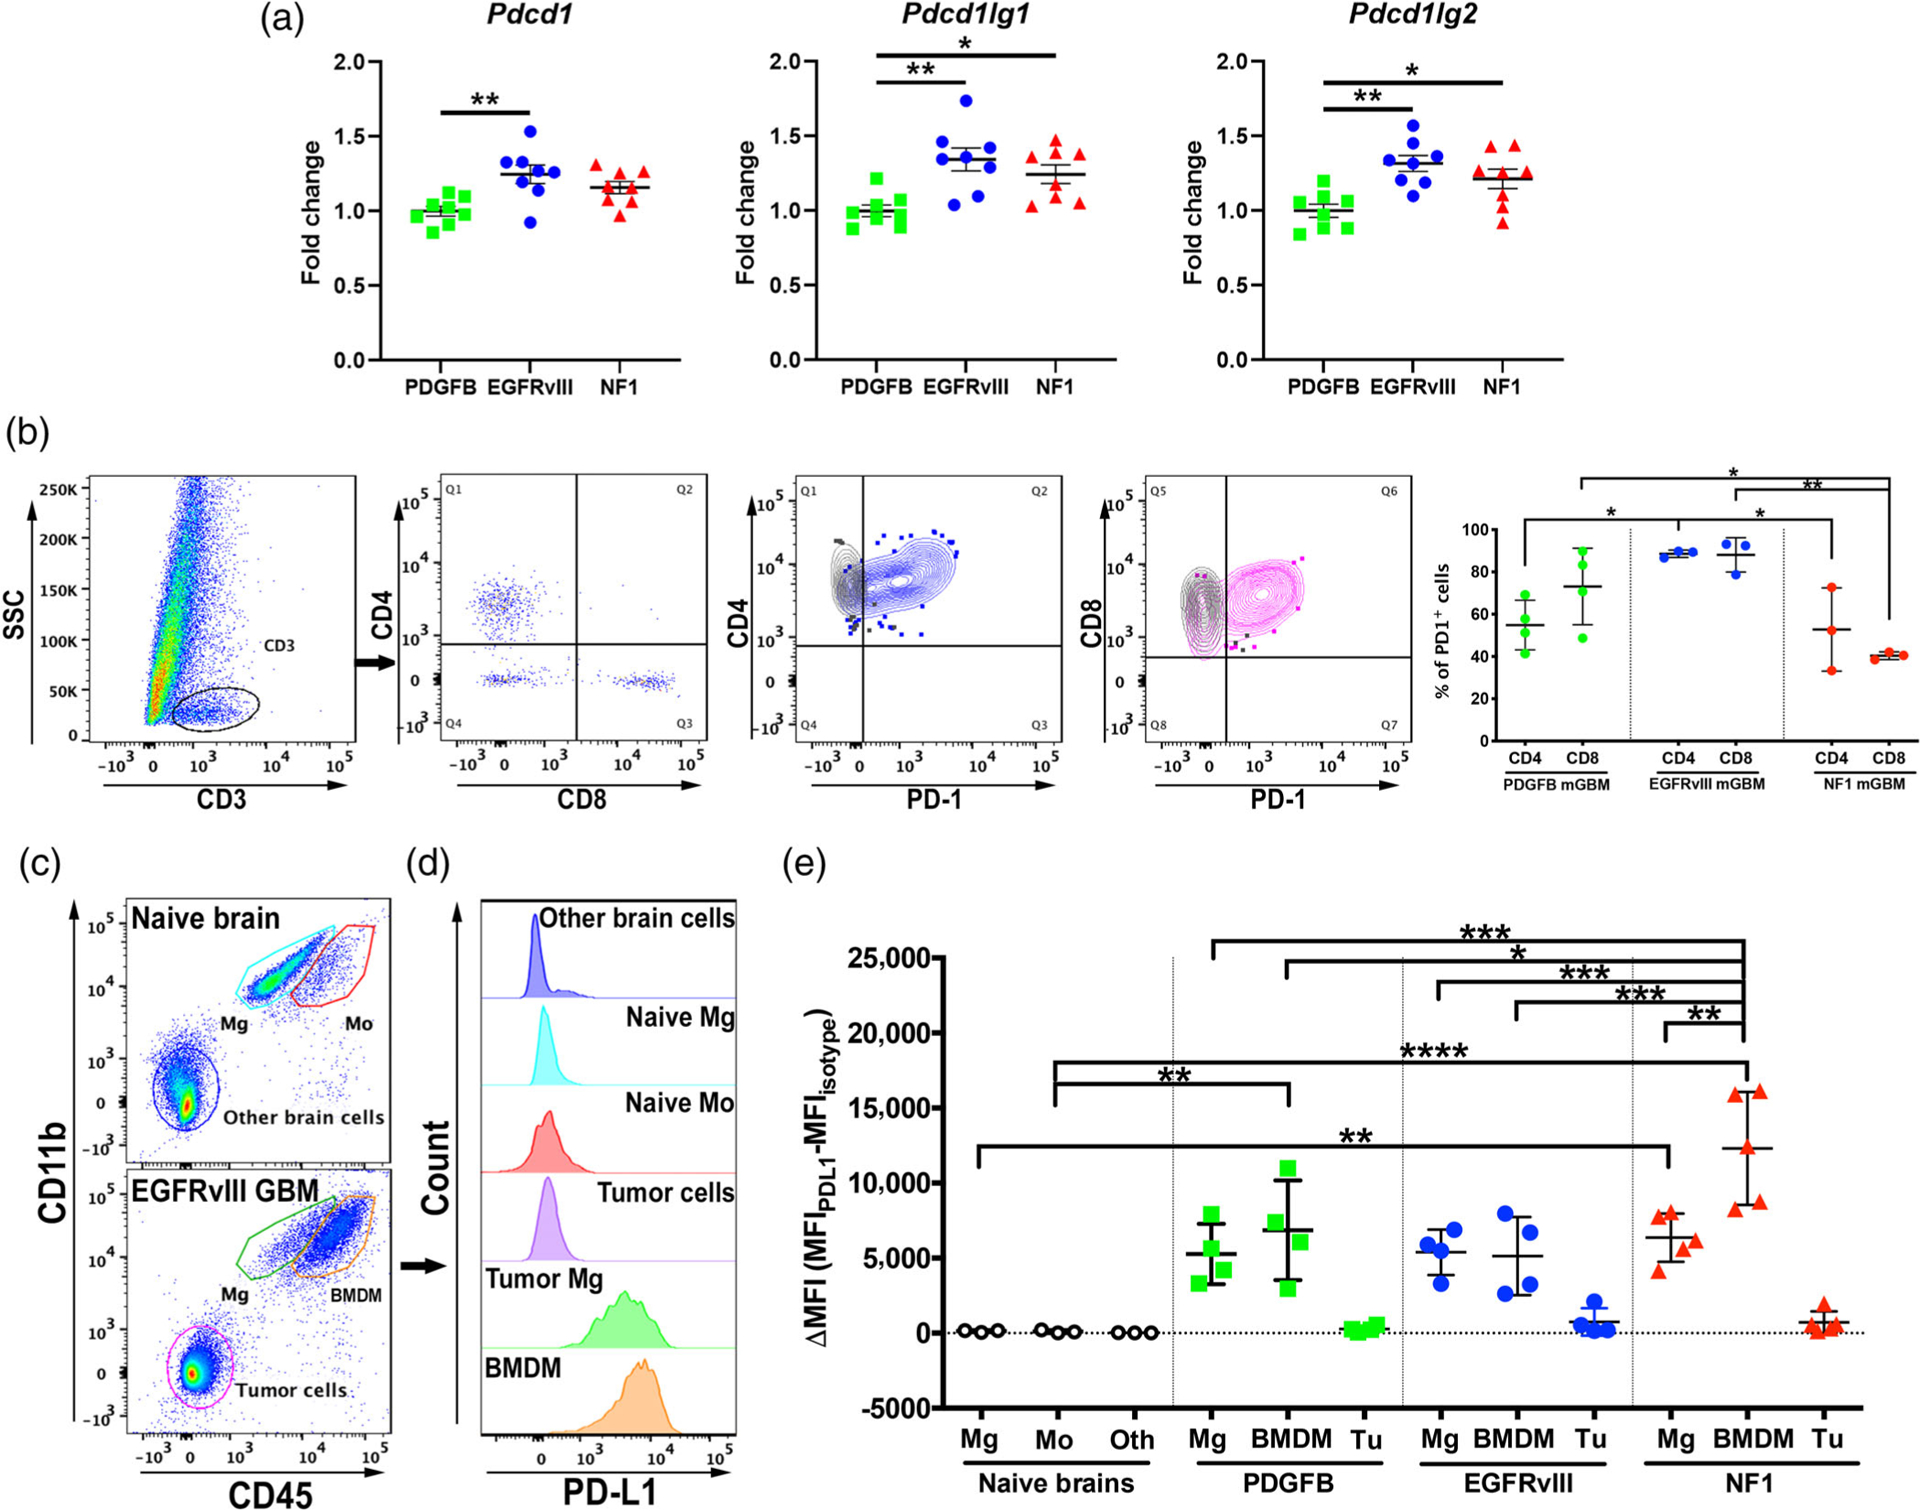
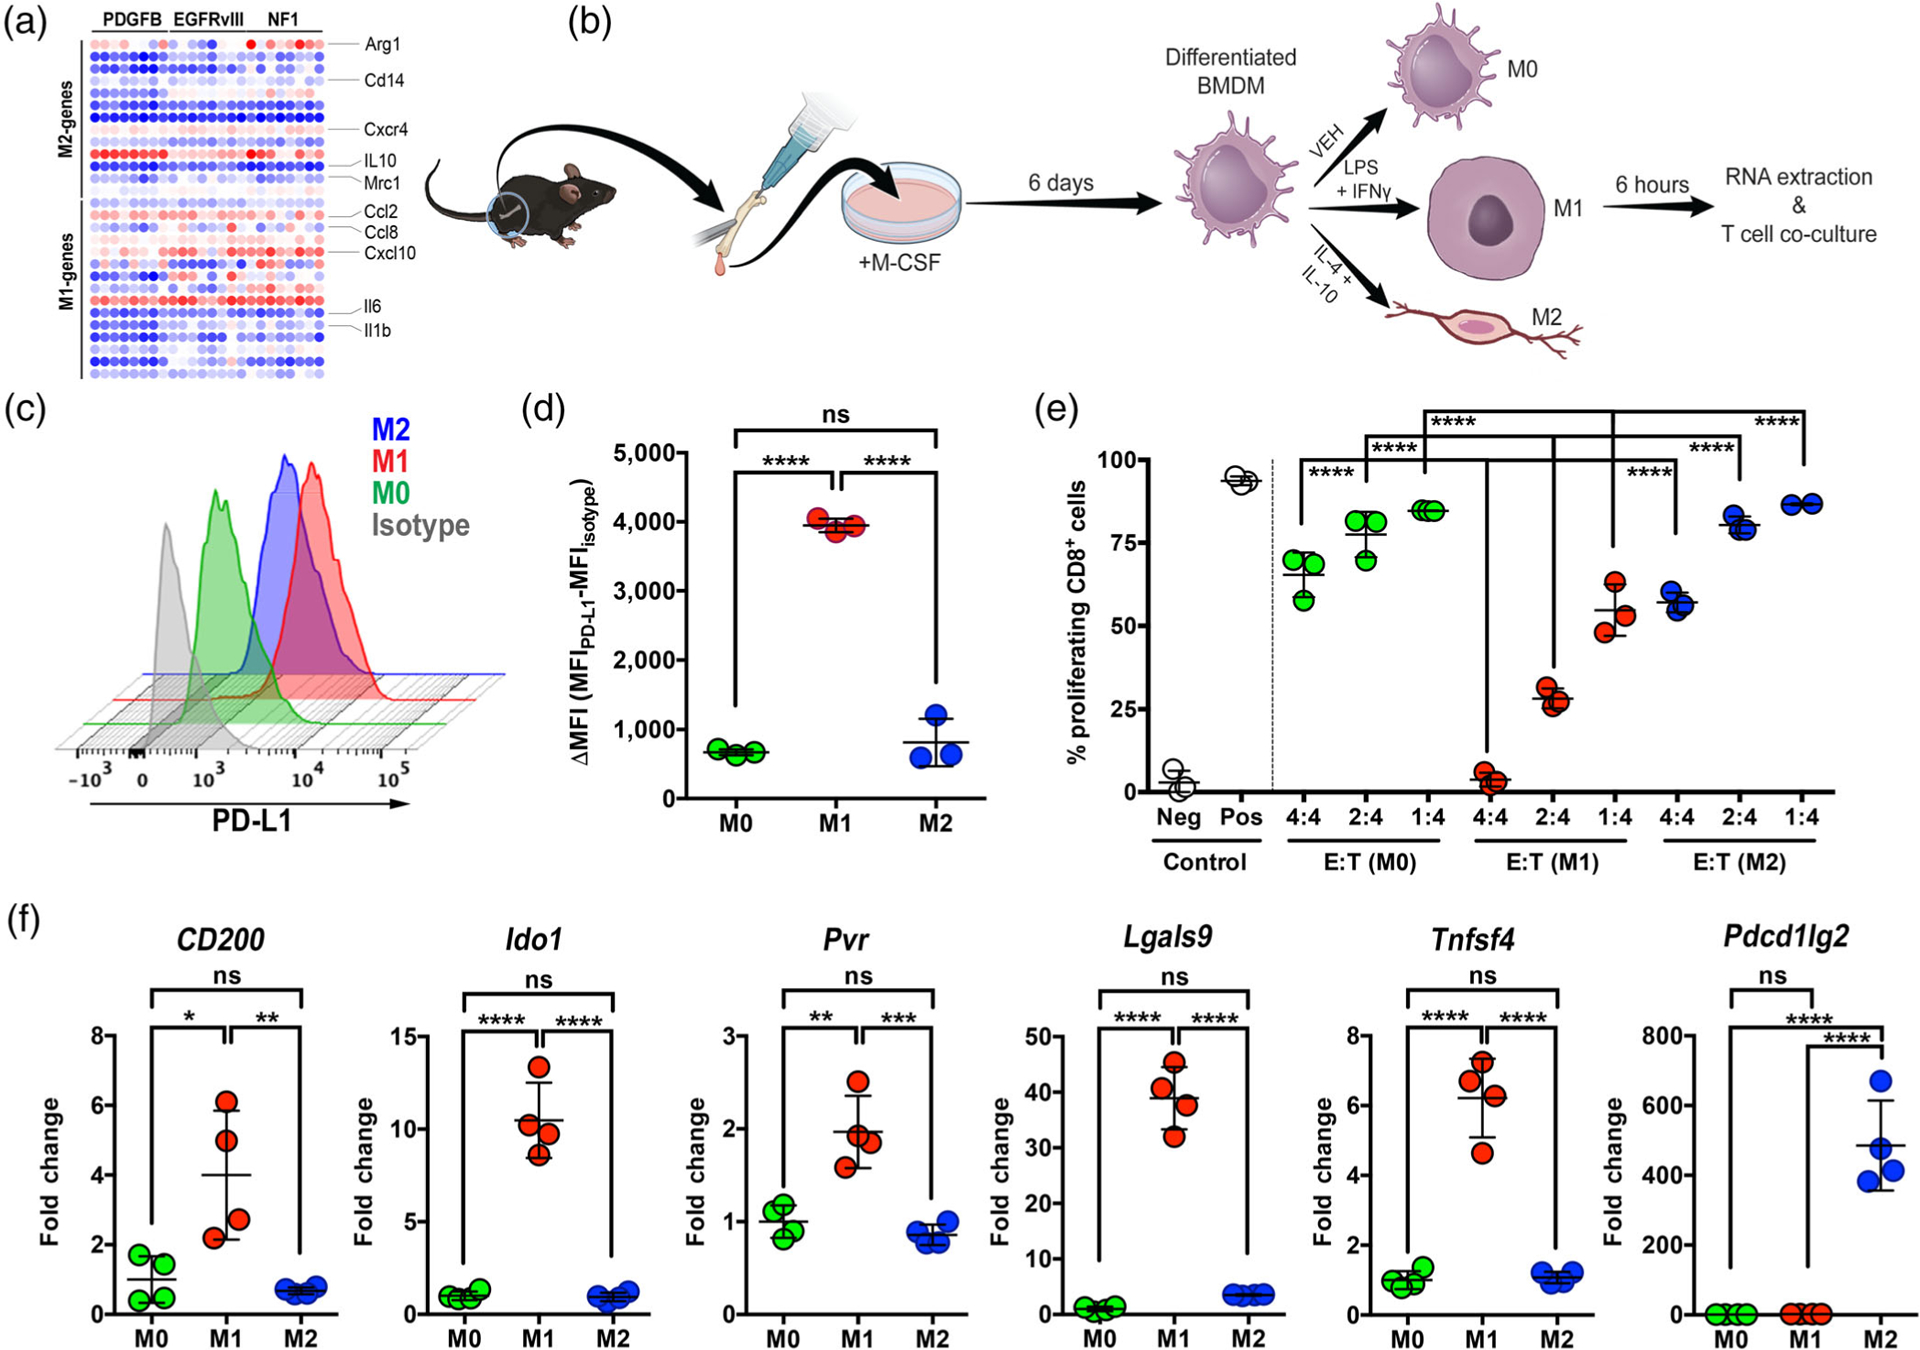
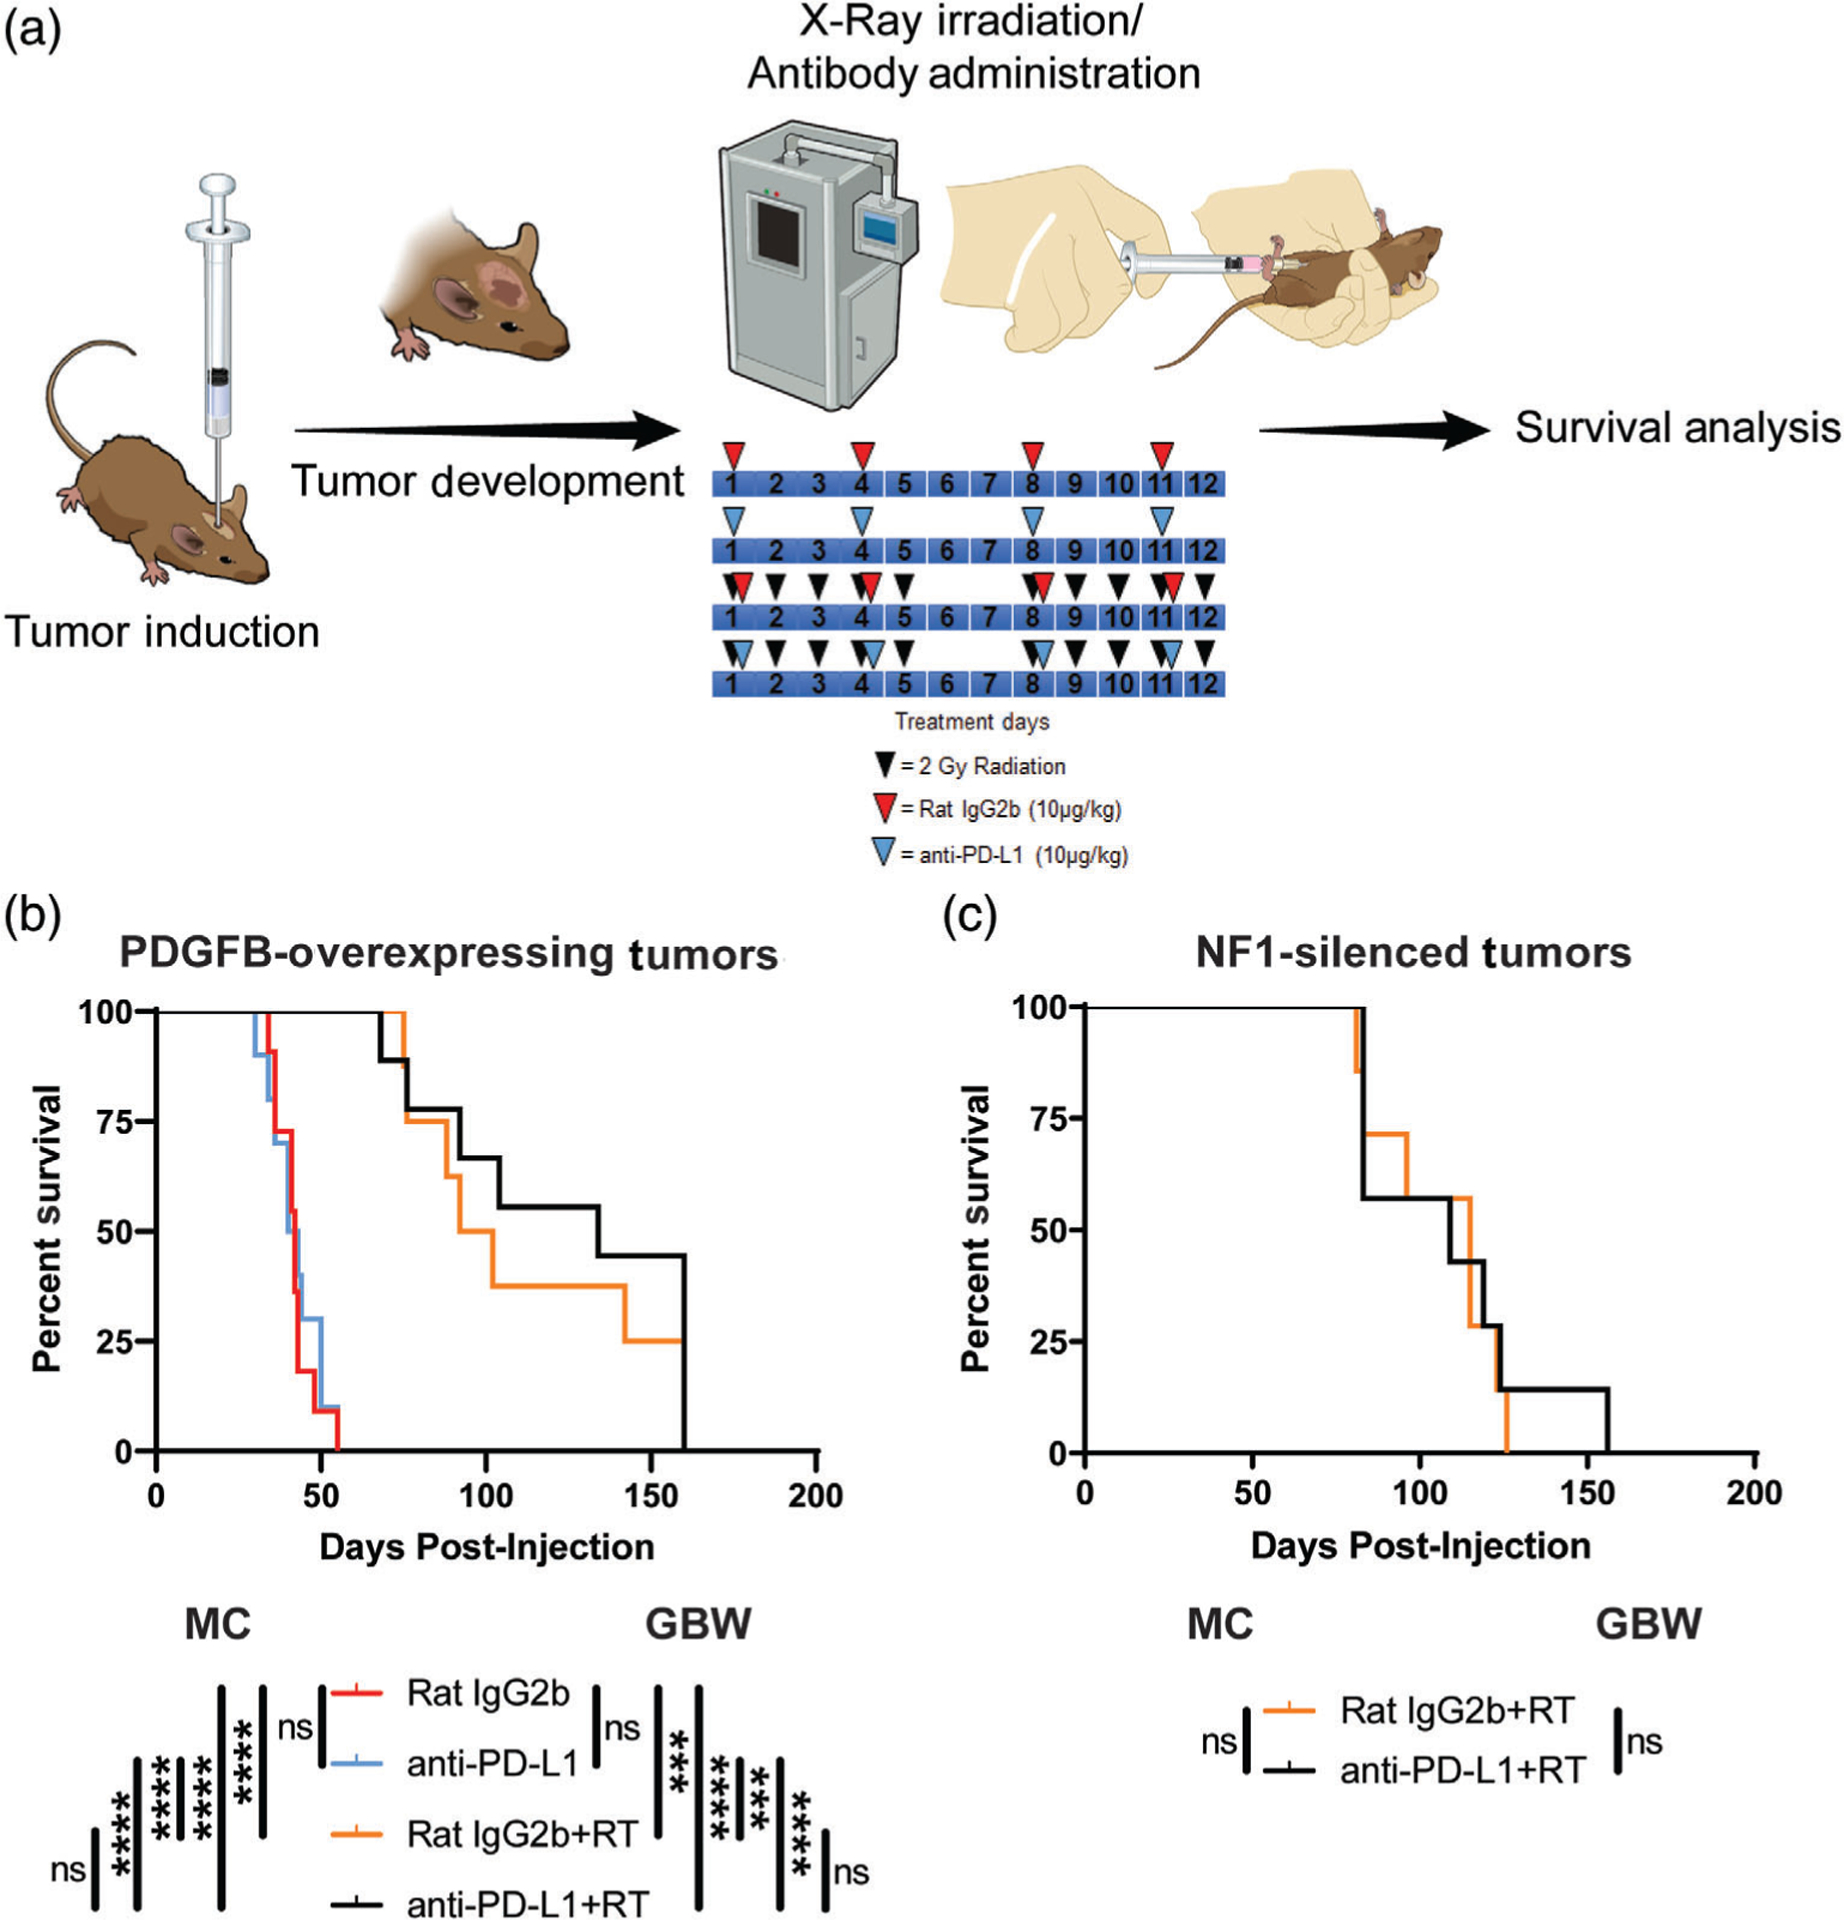
Glioblastoma (GBM) is the most aggressive primary brain tumor. In addition to being genetically heterogeneous, GBMs are also immunologically heterogeneous. However, whether the differences in immune microenvironment are driven by genetic driver mutation is unexplored. By leveraging the versatile RCAS/tv-a somatic gene transfer system, we establish a mouse model for Classical GBM by introducing EGFRvIII expression in Nestin-positive neural stem/progenitor cells in adult mice. Along with our previously published Nf1-silenced and PDGFB-overexpressing models, we investigate the immune microenvironments of the three models of human GBM subtypes by unbiased multiplex profiling. We demonstrate that both the quantity and composition of the microenvironmental myeloid cells are dictated by the genetic driver mutations, closely mimicking what was observed in human GBM subtypes. These myeloid cells express high levels of the immune checkpoint protein PD-L1; however, PD-L1 targeted therapies alone or in combination with irradiation are unable to increase the survival time of tumor-bearing mice regardless of the driver mutations, reflecting the outcomes of recent human trials. Together, these results highlight the critical utility of immunocompetent mouse models for preclinical studies of GBM, making these models indispensable tools for understanding the resistance mechanisms of immune checkpoint blockade in GBM and immune cell-targeting drug discovery.

Keywords: EGFRvIII; GEMM of GBM; PD-L1; glioblastoma; microenvironment.


Conflict of interest statement

CONFLICT OF INTEREST

The authors have no relevant competing interests to disclose.

Figures

FIGURE 1
FIGURE 1
Establishing and characterizing a murine model of CL hGBM. (a) Schematic illustration of the generation of the quadruple transgenic mouse. (b) Survival curves of murine EGFRvIII-expressing tumors with or without hTAZ expression. **p < .01 by log-rank test. (c) TAZ expression in subtypes of human GBM. **p < .01 by one-way ANOVA with Tuckey’s posthoc comparison. (d) Grading of EGFRvIII-expressing tumors with or without hTAZ. **p < .01 by Fisher’s exact test. (e) Hematoxylin and eosin (H&E) staining of CL hGBM and EGFRvIII mGBM; and immunohistochemical analysis of human EGFR in both species. (f) Immunohistochemical analysis of PTEN in EGFRvIII mGBM. Arrows indicate PTEN-positive stromal cells. Scale bars are as indicated, except the ones in inset, which represent 12.5 μm
FIGURE 2
FIGURE 2
Murine GBM models closely resemble their human counterparts. (a) A distance matrix of murine tumor expression data (N = 7 per group). (b) PCA clustering of murine (N = 7 per group) and human tumor expression data (PN: N = 87, MES: N = 137, and CL: N = 128). (c) Primary cells derived from the three subtypes of murine GBM generated with the RCAS/tv-a system were cultured in vitro and stained for the nuclear marker DAPI as well as the cellular markers EGFR, OLIG2, and CD44. Differential interference contrast microscopy (DIC) was utilized to visualize the morphology of the cells. Scale bars = 25 μm. (d) Flow cytometric plots showing cell-cycle stages as examined by EdU assay. (e) Quantification of the phases of cell cycle. **p < .01 by one-way ANOVA with Tukey’s posthoc test
FIGURE 3
FIGURE 3
Driver mutation creates unique immune microenvironments in different subtypes of mGBM. (a) t-SNE plot of the NanoString PanCancer Immune Profiling data. (b) Immune pathway function in PDGFB-overexpressing, Nf1-silenced, and EGFRvIII-expressing tumors. (c) Unsupervised hierarchical analysis of NanoString PanCancer Immune Profiling data. (d) Gene Ontology analysis of differentially enriched genes in the three mGBM subtypes. (e) IHC micrographs of IBA1 immunostaining in murine and human GBM subtypes. (f) IHC micrographs of CD31 immunostaining in murine and human GBM subtypes *p < .05, **p < .01, ***p < .001, ****p < .0001, by one-way ANOVA with Tukey’s posthoc test
FIGURE 4
FIGURE 4
Tumor-associated myeloid cell populations differ significantly between GBM subtypes. Mice were euthanized when their tumor burden reached terminal stage, and their tumors were analyzed by flow cytometry or immunohistochemistry. (a) Representative flow cytometry plots of myeloid cells in mGBM. Histograms of the key surface markers of each population are shown in the middle. (b) Percent of total myeloid cell present in each tumor subtype. (c) Percent of each type myeloid cell present in each tumor subtype. (d) Donut plot demonstrating the differential composition of TAMs in three subtypes of mGBM. (e) Immunohistochemical analyses of TAM infiltration in NSG mice. The tissue sections were stained with IBA1. (f–h) Quantification of IBA1 staining. **p < .01, ***p < .001, ****p < .0001, (ns) not significant, by one-way ANOVA with Tukey’s posthoc test (c) or unpaired t-test (f–h)
FIGURE 5
FIGURE 5
PD-L1 expression is elevated the most in tumor-associated BMDM. (a) Transcription of PD-1 and its ligands are elevated in EGFRvIII mGBM compared to other subtypes. (b) Flow cytometry analysis of PD-1 expression in tumor infiltrating lymphocytes. (c) Gating strategy as represented by CD45 and CD11b (other parameters not shown). Microglia (Mg, CD45LoCD11b+), bone marrow-derived myeloid cells (Mo, CD45HiCD11b+), non-myeloid cells in normal brain, and tumor cells (CD45CD11b) are identified in naïve or GBM brain tissues by FACS. (d) Representative off-set overlay histogram of PD-L1 expression in each cell type. (e) Quantification of mean fluorescent intensity (MFI) of PD-L1 compared to isotype control. Mg, microglia. Mo, monocytes. Oth, other normal brain cells. BMDM: bone marrow-derived macrophages. Tu: tumor cells. *p < .05, **p < .01, ***p < .001, by one-way ANOVA with Tukey’s posthoc test
FIGURE 6
FIGURE 6
LPS/IFNγ-stimulated (M1) BMDM express high levels of PD-L1 and suppress T cell proliferation in vitro. (a) M1 or M2 differentiated macrophages are equally found in all three subtypes of mGBM. (b) Schematic representation of BMDM isolation and polarization. (c) Representative off-set histograms of PD-L1 expression in polarized BMDM in vitro. (d) Quantification of PD-L1 expression in these polarized cells. (e) BMDM suppress CD8 T-cell proliferation in an E: T (effector: target) ratio-dependent manner when the T cells are stimulated with 100 nM SINNFEKL peptide. (f) M1-polarized BMDM display the highest levels of immunosuppressive markers as examined by qPCR. *p < .05, **p < .01, ***p < .001, ****p < .0001, (ns) not significant, by one-way ANOVA with Tukey’s posthoc test
FIGURE 7
FIGURE 7
Murine PDGFB-overexpressing and Nf1-silenced tumors do not respond to PD-L1 neutralizing therapy. (a) Schematic illustration of the experimental protocol. (b) Survival curves comparing mice bearing PDGFB-overexpressing tumors treated with isotype control antibody (N = 11), PD-L1 neutralizing antibody (N = 10), isotype control antibody plus x-ray irradiation (N = 8), and PD-L1 neutralizing antibody plus X-ray irradiation (N = 9). (c) Survival curves comparing mice bearing NF1-silenced tumors treated with isotype control antibody plus X-ray irradiation (N = 7) and PD-L1 neutralizing antibody plus X-ray irradiation (N = 6). Mantel-Cox (MC) and Gehan-Breslow-Wilcoxon (GBW) tests, (ns) not significant, ***p < .001, ****p < .0001. RT, X-ray radiation therapy

References

    1. Ajami B, Bennett JL, Krieger C, McNagny KM, & Rossi FM (2011). Infiltrating monocytes trigger EAE progression, but do not contribute to the resident microglia pool. Nature Neuroscience, 14(9), 1142–1149. 10.1038/nn.2887 - DOI - PubMed
    1. Aranda PS, LaJoie DM, & Jorcyk CL (2012). Bleach gel: A simple aga-rose gel for analyzing RNA quality. Electrophoresis, 33(2), 366–369. 10.1002/elps.201100335 - DOI - PMC - PubMed
    1. Berghoff AS, & Preusser M (2019). Does neoadjuvant anti-PD1 therapy improve glioblastoma outcome? Nature Reviews. Neurology, 15(6), 314–315. 10.1038/s41582-019-0178-0 - DOI - PubMed
    1. Brennan CW, Verhaak RG, McKenna A, Campos B, Noushmehr H, Salama SR, … Network TR (2013). The somatic genomic landscape of glioblastoma. Cell, 155(2), 462–477. 10.1016/j.cell.2013.09.034 - DOI - PMC - PubMed
    1. Cancer Genome Atlas Research Network. (2008). Comprehensive genomic characterization defines human glioblastoma genes and core pathways. Nature, 455(7216), 1061–1068. 10.1038/nature07385 - DOI - PMC - PubMed

Publication types

Substances