. 2021 Jan 7;137(1):61-74.
doi: 10.1182/blood.2020007156.

Expression of NrasQ61R and MYC transgene in germinal center B cells induces a highly malignant multiple myeloma in mice

Affiliations

Expression of NrasQ61R and MYC transgene in germinal center B cells induces a highly malignant multiple myeloma in mice

Zhi Wen et al. Blood. .

Abstract

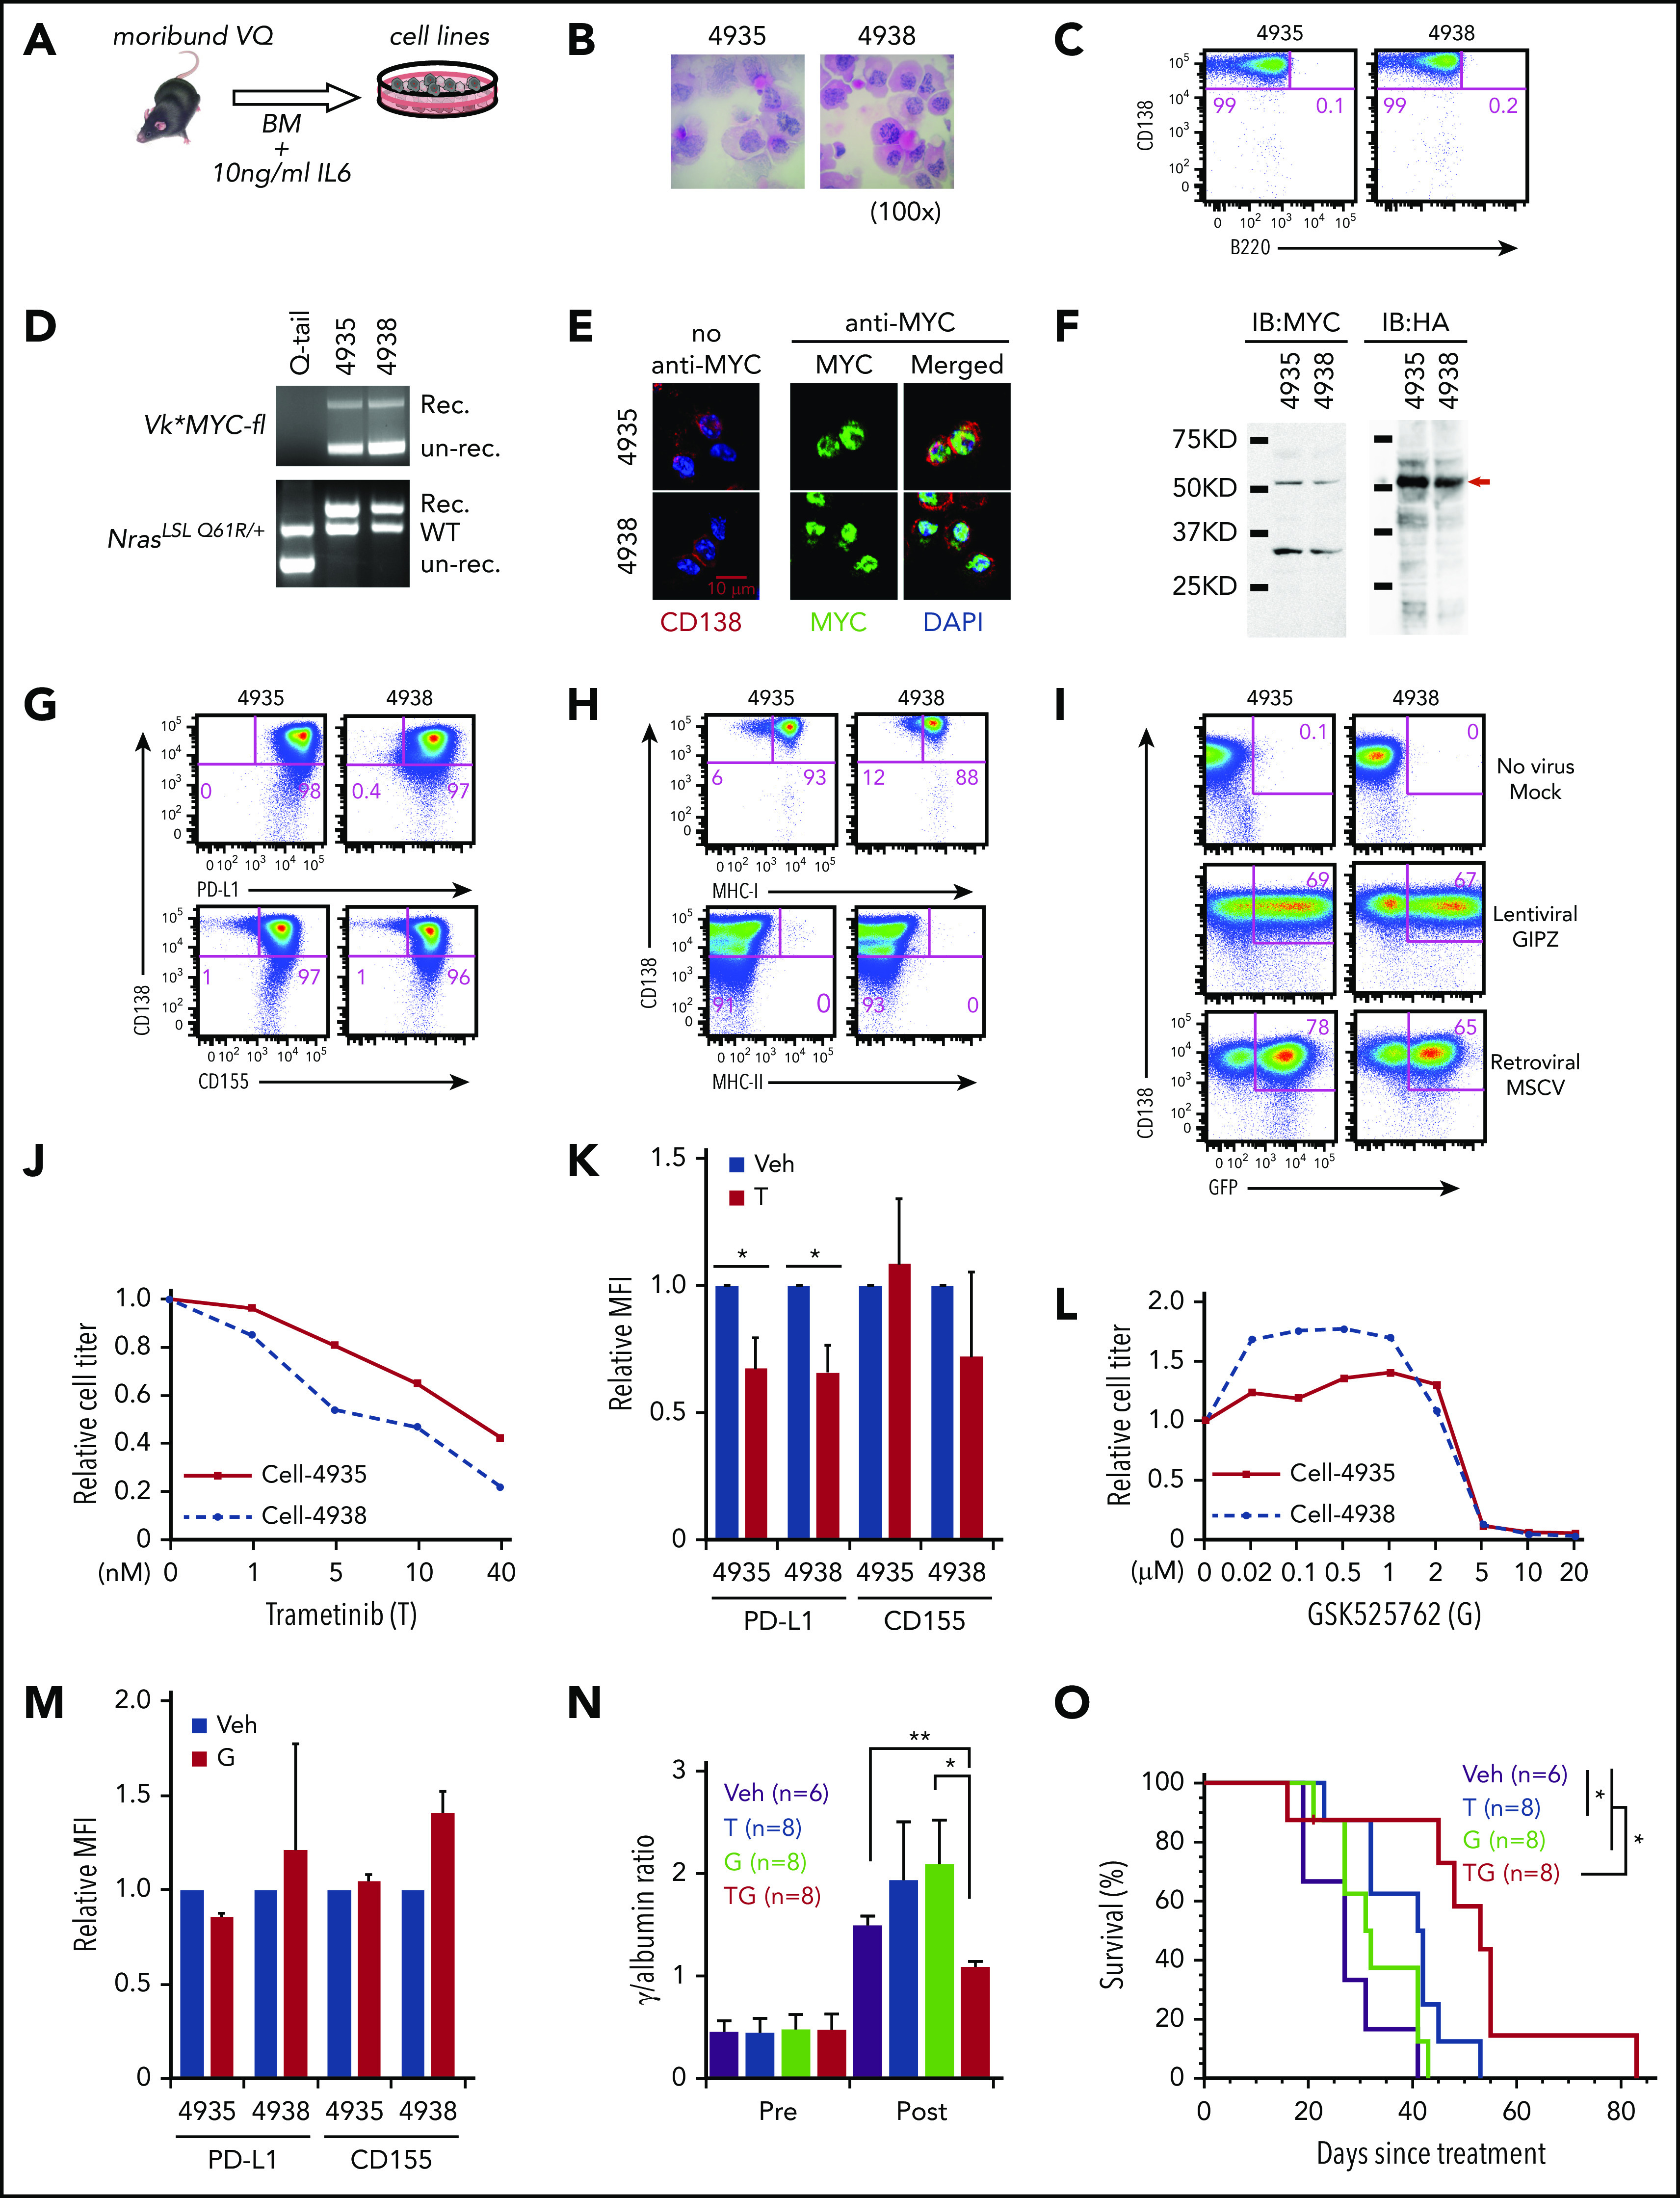
NRAS Q61 mutations are prevalent in advanced/relapsed multiple myeloma (MM) and correlate with poor patient outcomes. Thus, we generated a novel MM model by conditionally activating expression of endogenous NrasQ61R and an MYC transgene in germinal center (GC) B cells (VQ mice). VQ mice developed a highly malignant MM characterized by a high proliferation index, hyperactivation of extracellular signal-regulated kinase and AKT signaling, impaired hematopoiesis, widespread extramedullary disease, bone lesions, kidney abnormalities, preserved programmed cell death protein 1 and T-cell immunoreceptor with immunoglobulin and immunoreceptor tyrosine-based inhibition motif domain immune-checkpoint pathways, and expression of human high-risk MM gene signatures. VQ MM mice recapitulate most of the biological and clinical features of human advanced/high-risk MM. These MM phenotypes are serially transplantable in syngeneic recipients. Two MM cell lines were also derived to facilitate future genetic manipulations. Combination therapies based on MEK inhibition significantly prolonged the survival of VQ mice with advanced-stage MM. Our study provides a strong rationale to develop MEK inhibition-based therapies for treating advanced/relapsed MM.


Conflict of interest statement

Conflict-of-interest disclosure: The authors declare no competing financial interests.

Figures

None
Graphical abstract
Figure 1.
Figure 1.
A fraction of NrasQ61R/+; Vκ*MYC mice develop MM. (A) Acronyms of transgenic mouse lines and illustration of IgG1-Cre induction scheme. (B) SPEP was performed on representative mice from each group serially bled at the indicated weeks. The brackets show the γ-globulin component of the serum. (C) Kaplan-Meier survival curves (left) and disease incidences (right) of different groups of animals. MM is defined as CD138+B220 cells being >10% in BM, spleen, and/or LN along with end-organ abnormalities. (D) Flow cytometric analysis of B220 and CD138 expression on cells from BM, spleen (SP), and LN. Representative density plots from each group are shown. (E) Representative images of hematoxylin-and-eosin (H&E)-stained BM, SP, liver, LN, and kidney sections; scale bar, 40 μm. Red arrow indicates an area with protein deposition mimicking the histologic findings in myeloma kidney. (F) Complete blood count (CBC) of peripheral blood samples collected from moribund mice and age-matched control mice. (G) Clonality analysis of VQ1 and VQ2 CD138+ cells using DJH recombination polymerase chain reaction (PCR) assay. *P < .05; **P < .01; ***P < .001. Hb, hemoglobin; I.P., intraperitoneal; ns, not significant; RBC, red blood cell; WBC, white blood cell.
Figure 2.
Figure 2.
Molecular characterization of VQ myeloma cells. (A) Genotyping of NrasQ61R/+ and Vκ*MYC alleles to assess recombination efficiencies in VQ CD138+ cells. (B) hMYC expression in primary CD138+ plasma cells was detected using confocal immunofluorescence. Scale bar, 20 μm. The areas within the red rectangles were magnified (×5); original magnification ×60. (C) Quantification of Ki67+ cells in primary CD138+ cells from moribund VQ MM mice and age-matched control IgG1-Cre, V, and Q mice. (D-E) Quantification of phosphorylated ERK (pERK) (D) and pAKT levels (E) in primary CD138+ cells from moribund VQ MM mice and age-matched control IgG1-Cre, V, and Q mice. *P < .05; **P < .01; ***P < .001. DAPI, 4′,6-diamidino-2-phenylindole; Rec., recombined; un-rec., unrecombined.
Figure 3.
Figure 3.
VQ myeloma is readily transplantable to syngeneic secondary recipients. (A) Schematic illustration of VQ myeloma transplantation strategy. (B) VQ1 BM cells (8 × 10⁶; VQ-D1-BM), VQ1 splenocytes (20 × 106; VQ-D1-SP), VQ2 BM cells (5 × 10⁶; VQ-D2-BM), or VQ2 LN cells (20 × 106; VQ-D2-LN) were transplanted into individual recipients. SPEP was performed on recipient mice bled at the moribund stage. The brackets show the γ-globulin component of the serum. The donor cells were isolated from BM, spleen (SP), or LN. (C) Kaplan-Meier survival curves of VQ-D1 and VQ-D2 recipient mice, which were transplanted with VQ1 and VQ2 myeloma cells, respectively. Log-rank test was performed. **P < .01. (D) Representative radiographic images and H&E-stained sections of hind-limb bones from moribund VQ-D1 and VQ-D2 recipient mice and age-matched control mice; scale bar, 50 μm. The red arrows indicate the osteolytic lesions. (E) Representative photo of VQ-D1/D2 recipients with hind-limb paralysis. (F) Flow cytometric analysis of B220 and CD138 expression on BM, SP, and LN cells from VQ-D1 and VQ-D2 recipient mice. Representative density plots are shown. (G) Representative images of H&E-stained BM, SP, liver, LN, and kidney sections; scale bar, 40 μm.
Figure 4.
Figure 4.
PD-L1/PD1 and CD155/TIGIT immune-checkpoint pathways are preserved in the VQ myeloma model. BM cells (1 × 10⁶) from control (IgG1-Cre), VQ-D1, and VQ-D2 myeloma mice (>6 passages) were transplanted into sublethally irradiated recipients as described in Figure 3. (A-B) Flow cytometric analysis of CD138, PD-L1, PD-L2, CD155 (A), MHC-I, and MHC-II (B) on BM of VQ-D1 recipients and LN cells of VQ-D2 recipients. Representative density plots are shown. (C-D) Quantification of PD1+ and TIGIT+ T cells (CD8+ and CD4+) in BM, spleen (SP), and LN from age-matched control, VQ-D1 (C), and VQ-D2 (D) recipients. (E-F) Quantification of CD8+ and CD4+ T cells in BM, SP, and LN of control, VQ-D1 (E), and VQ-D2 (F) recipients. *P < .05; **P < .01; ***P < .001.
Figure 5.
Figure 5.
VQ myeloma cells display unique transcriptional signatures from normal plasma cells. CD138+B220 cells were sorted from age-matched control BM (Con-BM) and VQ-D2 BM and LN. scRNA-Seq analysis was performed as described in “Methods.” (A) tSNE plot depicting 749 single plasma cells derived from control and VQ-D2 mice. Each cluster is represented by a specific color and number. The top 20 genes expressed in each cluster are presented in the heatmap. (B) Samples are color-coded and projected on the tSNE plot (blue, Con-BM; red, VQ-BM; green, VQ-LN). (C) Cell-cycle phases are color-coded and projected on the tSNE plot (red, G1; green, G2/M; blue, S). (D) GSEA was performed between VQ-BM and Con-BM plasma cells. Adjusted P value (P.adj) and normalized enrichment score (NES) are shown on each plot. (E) Signature module scores were calculated for each cell based on the expression levels of genes associated with high-risk MM and the average expression profile of each cell. P value was determined using the Welch t test between VQ (BM + LN) and Con-BM. ES, enrichment score.
Figure 6.
Figure 6.
Transcriptomic profiling of normal plasma cells and MM models using bulk RNA-Seq. Bulk RNA-Seq analysis was performed using 50 000 sorted CD138+B220CD45.2+ BM cells of WT (n = 3), V (n = 3), recipients of tVk12653 (n = 2), VQ-D1 (n = 2), VQ-D4 (n = 1), and VQ-D5 (n = 2). (A) Normalized expression levels of Myc in all samples. *P < .05; **P < .01; ***P < .001. (B) Scatterplots of average (avg) log10 FPKM values of all mapped genes of V, tVk12653, or VQ samples vs WT samples. Red and blue dots represent differentially upregulated and downregulated genes, respectively, for each comparison (log2 fold change [FC] >1 or <−1, adjusted P [P.adj], <.05); r2 value calculated from Pearson correlation coefficient. (C) Volcano plots illustrating the differentially expressed genes in tVk12653 or VQ MM cells vs WT plasma cells. GSEA was performed between tVk12653 or VQ and WT plasma cells against Hallmark (D) or UAMS-70 (E) gene sets. (F) Volcano plots illustrating the differentially expressed genes in VQ vs tVk12653 MM cells. GSEA analysis was performed between VQ and tVk12653 MM cells against Hallmark (G) or C2 curated (H) gene sets. Adjusted P value and normalized enrichment score (NES) are shown on each GSEA plot.
Figure 7.
Figure 7.
Combined MEK inhibitor and pan bromodomain and extraterminal domain inhibitor ameliorate MM phenotypes and prolong the survival of VQ myeloma mice. (A-I) Two MM cell lines were established from VQ-D2 recipient mice. (A) Schematic illustration of the procedure to establish 2 VQ MM cell lines. (B) Representative images of H&E-stained 4935 and 4938 cells; original magnification ×100. (C) Flow cytometric assay of B220 and CD138 expression on the 2 cell lines. (D) Genotyping of NrasQ61R and Vκ*MYC alleles in the 2 cell lines. (E) hMYC expression in the cell lines was detected using confocal immunofluorescence. Scale bar, 10 μm. Middle and right panels: 4′,6-diamidino-2-phenylindole (DAPI) stain. (F) Hemagglutinin (HA)-tagged hMYC expression in the cell lines was validated using western blot analysis. Left, rabbit anti-Myc antibody; right, rat anti-HA antibody conjugated with horseradish peroxidase. (G-H) Flow cytometric analysis of CD138, PD-L1, CD155 (G), MHC-I, and MHC-II (H) expression on the cell lines. (I) Quantification of retroviral and lentiviral infection rate in the cell lines based on flow cytometric analysis of green fluorescent protein (GFP). (J-K) VQ MM cell lines were treated with increasing concentrations of trametinib for 48 hours. (J) Cell growth was measured using Cell TiterGlo assay. (K) Quantification of surface expression of PDL1 and CD155 in the presence of 10 nM trametinib. (L-M) VQ MM cell lines were treated with increasing concentrations of GSK525762 for 48 hours. (L) Cell growth was measured using Cell TiterGlo assay. (M) Quantification of surface expression of PDL1 and CD155 in the presence of 3 μM GSK525762. (N-O) VQ recipients were treated with vehicle or drug(s) as described in “Methods.” (N) SPEP was performed to quantify the γ/A ratios in VQ recipient mice before treatment (Pre) and at day 21 of treatment or at moribund before day 21 (Post). Note: some of the recipients were found dead and unable to be analyzed. Paired, 2-tailed Student t tests were performed. (O) Kaplan-Meier survival curves were plotted against days after treatment. Log-rank test was performed. *P < .05; **P < .01. G, GSK525762; IB, immunoblot; MFI, mean fluorescence intensity; MSCV, murine stem cell virus; T, trametinib; TG, trametinib and GSK525762; Veh, vehicle.

Comment in

Similar articles

Cited by

References

    1. Kumar SK, Rajkumar V, Kyle RA, et al. . Multiple myeloma. Nat Rev Dis Primers. 2017;3(1):17046. - PubMed
    1. Cowan AJ, Allen C, Barac A, et al. . Global burden of multiple myeloma: a systematic analysis for the Global Burden of Disease Study 2016. JAMA Oncol. 2018;4(9):1221-1227. - PMC - PubMed
    1. Richter J, Jagannath S. Society of Hematologic Oncology state of the art update and next questions: multiple myeloma. Clin Lymphoma Myeloma Leuk. 2018;18(11):693-702. - PubMed
    1. Papadas A, Asimakopoulos F. Mechanisms of resistance in multiple myeloma. Handb Exp Pharmacol. 2018;249:251-288. - PubMed
    1. Weinstock M, Aljawai Y, Morgan EA, et al. . Incidence and clinical features of extramedullary multiple myeloma in patients who underwent stem cell transplantation. Br J Haematol. 2015;169(6):851-858. - PMC - PubMed

Publication types

Substances