. 2020 Jul 7;32(1):107872.
doi: 10.1016/j.celrep.2020.107872.

Single-Cell and Population Transcriptomics Reveal Pan-epithelial Remodeling in Type 2-High Asthma

Affiliations

Single-Cell and Population Transcriptomics Reveal Pan-epithelial Remodeling in Type 2-High Asthma

Nathan D Jackson et al. Cell Rep. .

Abstract

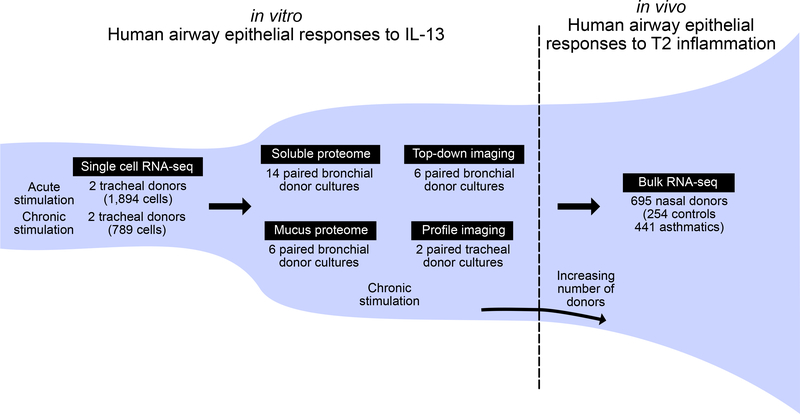
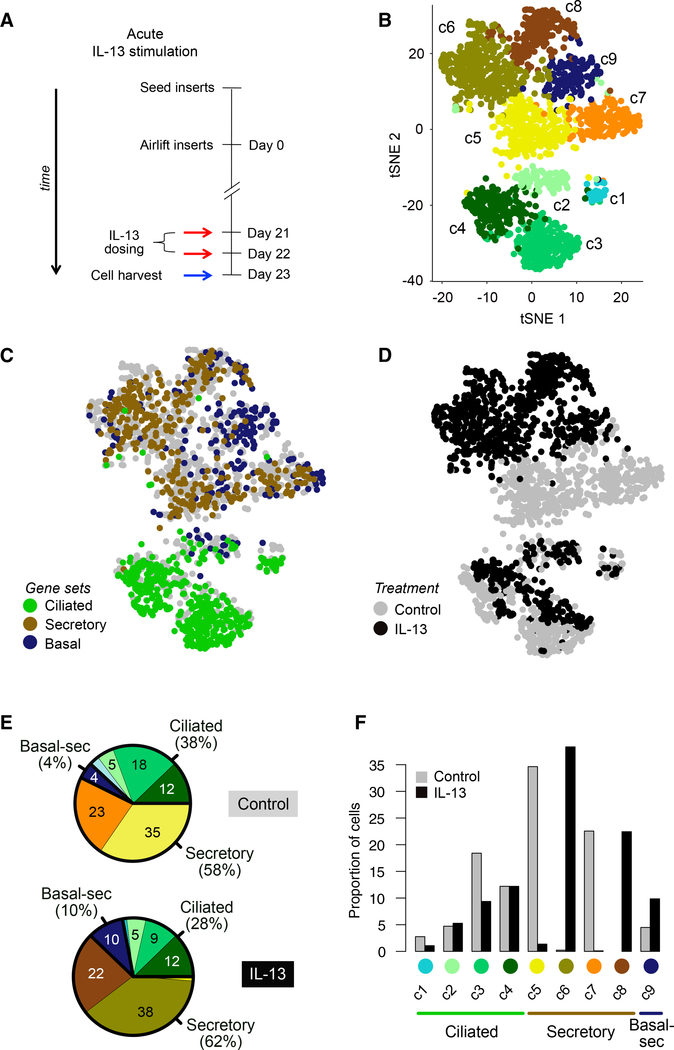
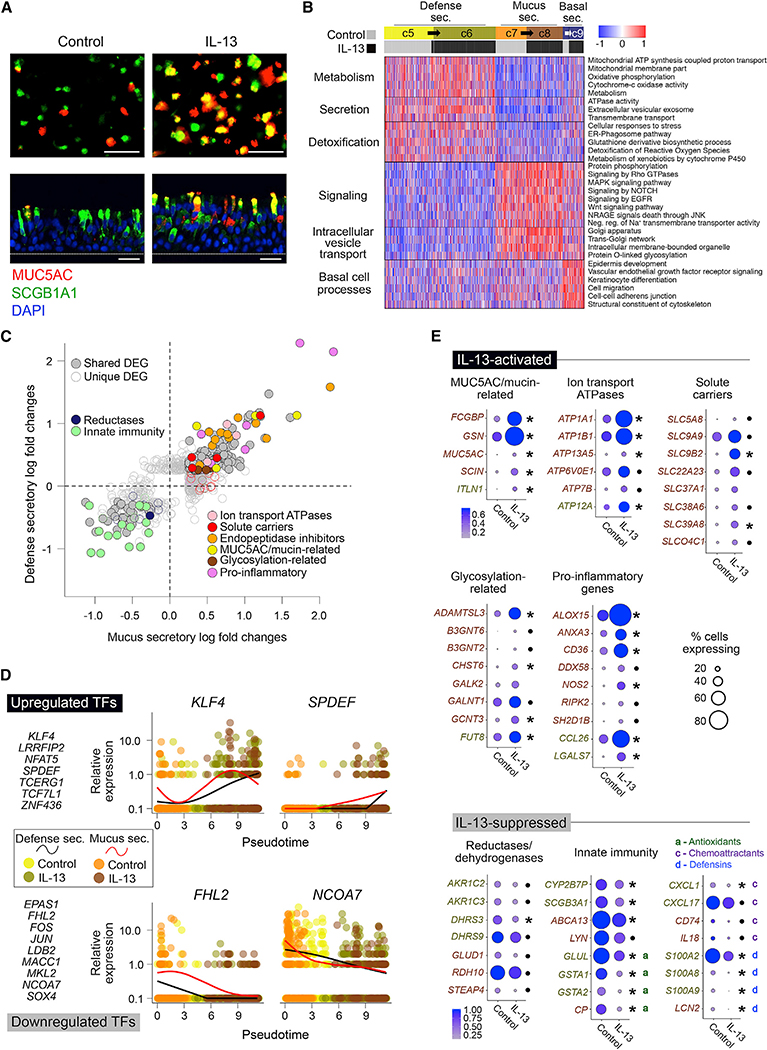
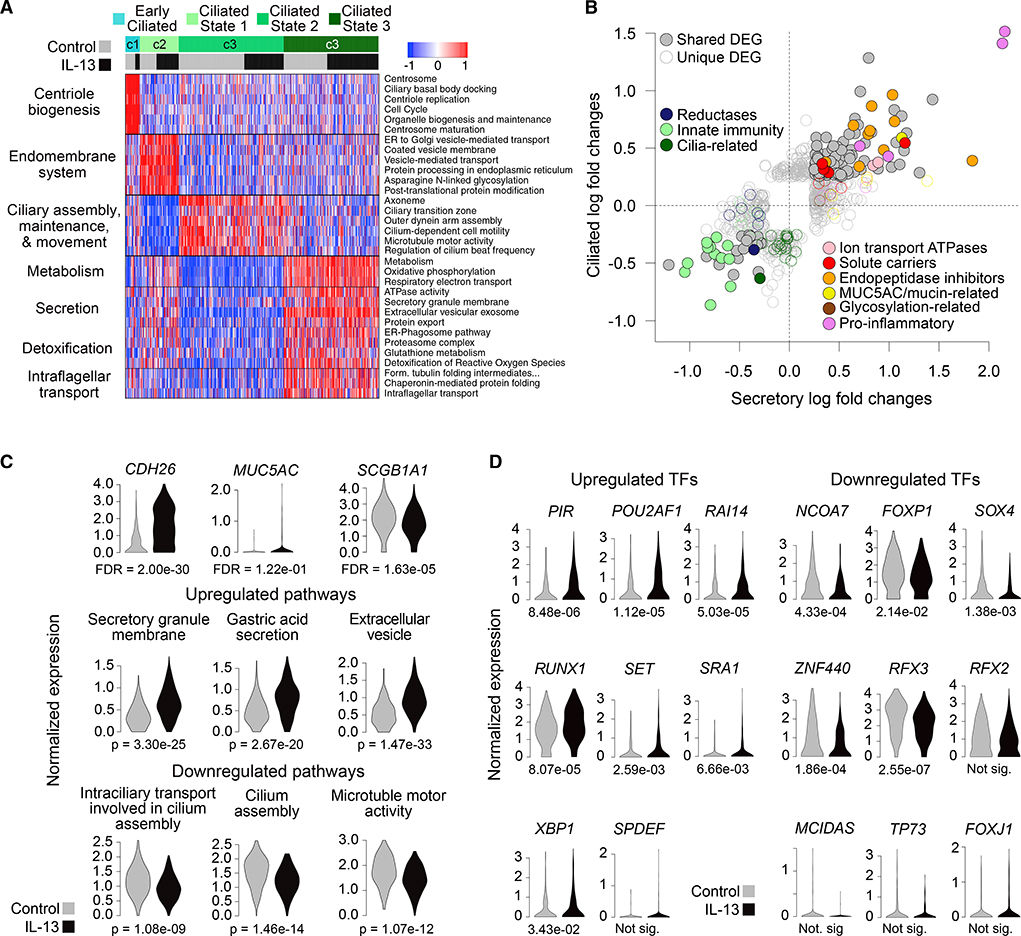
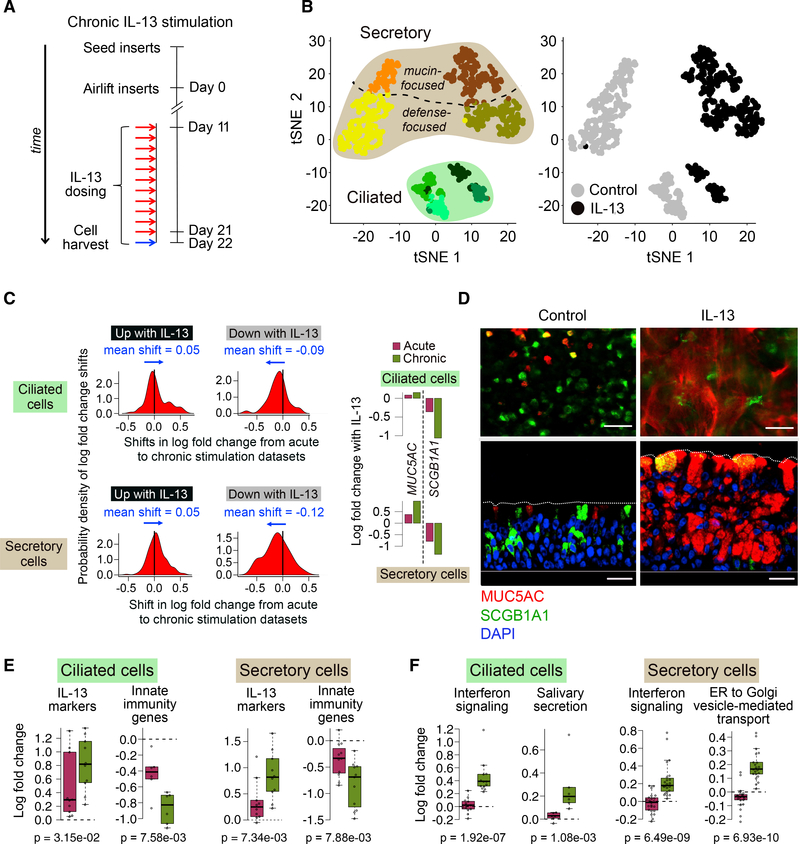
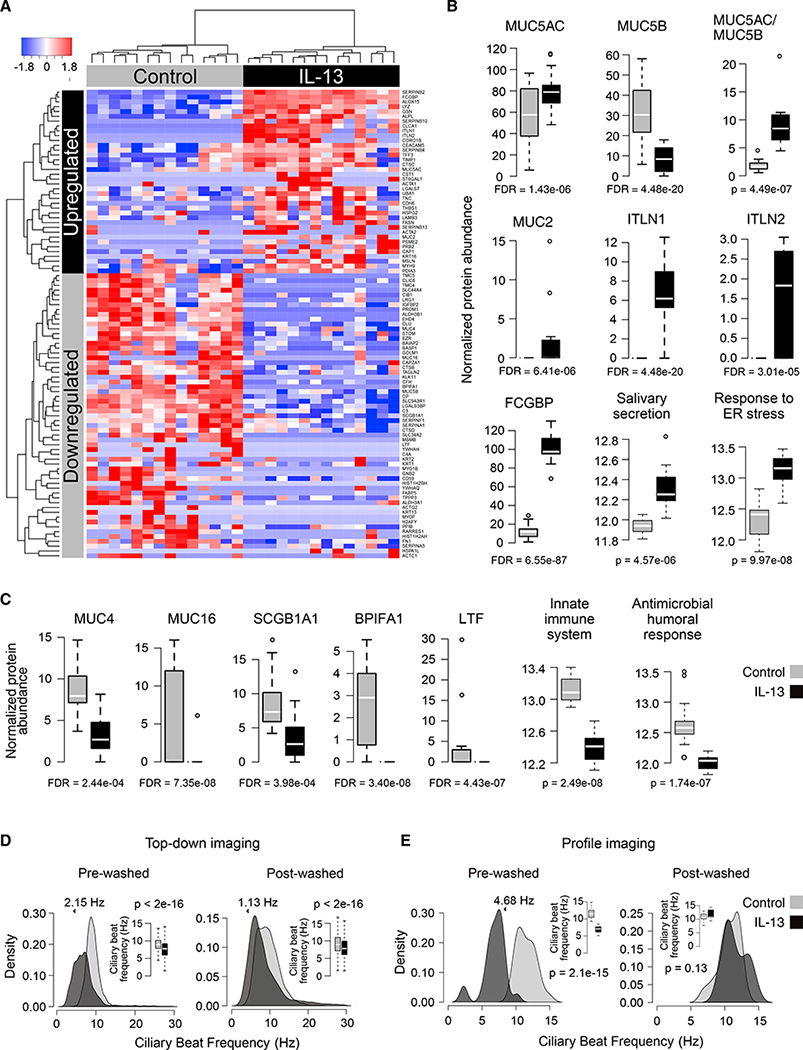
The type 2 cytokine-high asthma endotype (T2H) is characterized by IL-13-driven mucus obstruction of the airways. To further investigate this incompletely understood pathobiology, we characterize IL-13 effects on human airway epithelial cell cultures using single-cell RNA sequencing, finding that IL-13 generates a distinctive transcriptional state for each cell type. Specifically, we discover a mucus secretory program induced by IL-13 in all cell types which converts both mucus and defense secretory cells into a metaplastic state with emergent mucin production and secretion, while leading to ER stress and cell death in ciliated cells. The IL-13-remodeled epithelium secretes a pathologic, mucin-imbalanced, and innate immunity-depleted proteome that arrests mucociliary motion. Signatures of IL-13-induced cellular remodeling are mirrored by transcriptional signatures characteristic of the nasal airway epithelium within T2H versus T2-low asthmatic children. Our results reveal the epithelium-wide scope of T2H asthma and present candidate therapeutic targets for restoring normal epithelial function.

Keywords: GALA; RNA-seq; air-liquid interface; ciliary beat frequency; disease; lung; proteomics; secretome; single cell sequencing; type 2 inflammation.


Conflict of interest statement

Declaration of Interests The authors declare no competing interests.

Figures

Figure 1.
Figure 1.. Outline of the Study Design and Generated Data
The study proceeded in three in vitro phases with a fourth in vivo validation phase. In the in vitro phase, IL-13 transcriptomic effects on a cell type-specific level in human AECs were determined, effects were translated to the secreted proteome, and influences of this altered proteome on mucociliary motion and ciliary beat frequency were determined. In the in vivo phase, in vitro IL-13 effects were validated using in vivo transcriptome data from the nasal airway epithelial brushings of a large cohort of asthmatic and healthy children.
Figure 2.
Figure 2.. Acute IL-13 Stimulation Drives Cellular Remodeling of the Mucociliary Epithelium
(A) Schematic detailing human AEC ALI mucociliary differentiation followed by acute stimulation with IL-13; n = 2 human tracheal epithelial cell (HTEC) donors (T71, T72). (B) t-SNE plot of 1,894 cells depicting nine unsupervised scRNA-seq clusters. (C) t-SNE plot in (B), with cells colored by characteristic expression of ciliated, secretory, or basal cell gene signatures. See also Figures S1C–S1E. (D) t-SNE plot in (B), with cells colored by treatment. (E) Pie charts of differences in cell state proportions within major groups (ciliated, secretory, and basal-secretory) between control and IL-13-stimulated epithelia. (F) Bar-plot depiction of data in (E).
Figure 3.
Figure 3.. Normal Defense and Mucus Secretory Cells Are Reprogrammed by IL-13 into a Distinct Pathologic Mucus Secretory State
(A) Immunofluorescence (IF) labeling of ALI-differentiated human AEC cultures in top-down (top) and side (bottom) views show control cultures (left) dominated by SCGB1A1+ (green) and MUC5AC (red) cells transformed into cultures (right) with prominent co-staining (yellow) after acute IL-13. n = 3 HTEC donors (T73, T76, T79); scale bar, 30 mm; DAPI nuclei labeling (blue). (B) Heatmap shows shared functions between pairs of control and IL-13-dominant secretory populations (c5/c6, c7/c8, and c9-control/c9-IL-13). Mean scaled expression of population-defining DEGs within enriched functionally annotated sets is shown. (C) Scatterplot compares responses to IL-13 in defense (y) and mucus (x) secretory cells. Points, expression log fold changes with IL-13; filled, differentially expressed in both populations; unfilled, differentially expressed in one population; colored, belonging to specified function categories. (D) TFs whose expression significantly changes across a pseudotime trajectory transitioning from baseline to IL-13-stimulated cell states. Left: TFs increasing (top) or decreasing (bottom) across pseudotime. Right: scaled normalized expression (points) and smoothed trends (lines) for exemplar TFs across pseudotime-ordered cells. Point color, population as in (B); line color, defense-secretory (black), mucus-secretory (red). (E) Dot plots show shifts in level (dot color) and ubiquity (dot size) of expression for genes "activated" (top) or "suppressed" (bottom) by IL-13 in one or both secretory populations. Functional groups as in (C). Gene label font color: gold, defense; brown, mucus (population with strongest effect is shown). Same direction responses in both population pairs are indicated by asterisk (significant) or point (not significant). See also Figure S2.
Figure 4.
Figure 4.. Ciliated Cells Acquire Secretory Cell Expression Patterns with IL-13 at the Expense of Ciliogenic and Innate Immunity Functions
(A) Heatmap shows expression of functionally annotated gene groups distinguishing four ciliated cell populations. Mean scaled expression of population-defining DEGs within enriched functionally annotated sets is shown. (B) Scatterplot compares ciliated and secretory (defense + mucus) cell responses to IL-13. Points, expression log fold changes with IL-13; filled, differentially expressed in both populations; unfilled, differentially expressed in one population; colored; belonging to specified function categories. (C) Violin plots show expression in ciliated cells of key genes (top row) and mean expression of sets of genes up or downregulated with IL-13 that belong to enriched pathways (middle and bottom rows). FDRs are based on DE analysis; p values (p) are based on one-sided Wilcoxon tests. (D) Violin plots of expression of TFs up and downregulated with IL-13 in ciliated cells. Numbers below plots give FDRs based on DE analysis (where "not sig" denotes differences that were not significant).
Figure 5.
Figure 5.. Chronic IL-13 Completes Epithelium-wide Metaplasia and Promotes Both ER Stress and Interferon Responses in Ciliated Cells
(A) Schematic detailing human AEC ALI mucociliary differentiation followed by chronic stimulation with IL-13 of cells; n = 2 HTEC donors (T71, T72). (B) t-SNE plot overlaying cell clusters (left) or cell treatment (right) for 789 cells from experiment in (A). (C) Density plots show probability distribution (on the basis of a kernel density function) of shifts in log fold change between acute and chronic datasets for genes up (left) or downregulated (right) with IL-13 in ciliated (top) or secretory (mucus + defense) cells (bottom). All shifts significant with t test p values < 0.05. Bar plots compare log fold changes in MUC5AC and SCGB1A1 between acute and chronic IL-13. (D) Immunofluorescence (IF) labeling of ALI-differentiated human AEC cultures in top-down (top) and side (bottom) views show control cultures (left) dominated by SCGB1A1+ (green)/MUC5AC (red) cells transformed by chronic IL-13 into SCGB1A1/MUC5AC+-dominated cultures (right). Co-staining (yellow); DAPI nuclei (blue); scale bar, 30 μm; n = 3 HTEC donors (same as in Figure 3A). (E) Boxplots show mean log fold change of IL-13 markers and innate immunity genes responding significantly more strongly with chronic than acute IL-13. p values (p) are based on one-sided Wilcoxon tests. (F) Boxplots show mean log fold change of enriched annotated gene sets composed of genes exhibiting significantly stronger responses with chronic compared with acute IL-13. p values (p) are based on one-sided Wilcoxon tests. See also Figure S3.
Figure 6.
Figure 6.. The IL-13-Stimulated Epithelium Downregulates Secretion of Innate Defensive Proteins and Activates Secretion of Mucus-Related Proteins, while Decelerating Ciliary Beat Frequency and Mucociliary Transport
(A) Heatmap of normalized spectral counts for soluble apical secretome proteins significantly up- or downregulated with IL-13; n = 14 paired HBEC cultures. (B) Boxplots compare soluble apical secretome protein abundance between control and IL-13-stimulated samples for proteins or enriched terms upregulated with IL-13. FDRs are based on DE analysis; p values are based on one-sided Wilcoxon tests. (C) Same as (B) but based on proteins downregulated with IL-13. (D) Density plots and boxplots (insets) show distributional shift in CBF with chronic IL-13 on the basis of top-down imaging before (left) and after (right) apical washing. Specified shifts and p values from a linear mixed model; outliers excluded from boxplots; n = 6 paired HBEC cultures. (E) Same as (D) but based on profile imaging; n = 2 paired HTEC cultures. See also Figure S4 and Videos S1 and S2.
Figure 7.
Figure 7.. IL-13-Activated Expression and Secretion Responses of the Airway Epithelium Are Mirrored by Changes in the Airway Epithelium of T2H Children
(A) Heatmap shows functional gene groups responding to IL-13 in vitro are also differentially regulated between T2L and T2H children in vivo; n = 695. Genes and functional groups are the same as in Figures 3C, 4B, S4D, and S4E. Samples are sorted from left to right by increasing T2 inflammation signatures. (B) Boxplots show how average expression of genes coding for proteins up- or downregulated by IL-13 in the soluble apical secretome shows similar trends in T2H individuals. (C) Boxplots compare expression of key AEC genes between T2L and T2H donors. (D) Schematic summarizing metaplastic and dysregulatory transformation of the T2L human airway epithelium (top) under T2 inflammation (bottom), on the basis of both our in vitro IL-13 model and transcriptomes of a large in vivo cohort. See also Figure S5.

References

    1. Anders S, Pyl PT, and Huber W (2015). HTSeq—a Python framework to work with high-throughput sequencing data. Bioinformatics 31, 166–169. - PMC - PubMed
    1. Bao K, and Reinhardt RL (2015). The differential expression of IL-4 and IL-13 and its impact on type-2 immunity. Cytokine 75, 25–37. - PMC - PubMed
    1. Barceló B., Pons J, Fuster A, Sauleda J, Noguera A, Ferrer JM, and Agustí AGN (2006). Intracellular cytokine profile of T lymphocytes in patients with chronic obstructive pulmonary disease. Clin. Exp. Immunol. 145, 474–479. - PMC - PubMed
    1. Barretto KT, Brockman-Schneider RA, Kuipers I, Basnet S, Bochkov YA, Altman MC, Jarjour NN, Gern JE, and Esnault S (2020). Human airway epithelial cells express a functional IL-5 receptor. Allergy. - PMC - PubMed
    1. Beisswenger C, Kandler K, Hess C, Garn H, Felgentreff K, Wegmann M, Renz H, Vogelmeier C, and Bals R (2006). Allergic airway inflammation inhibits pulmonary antibacterial host defense. J. Immunol. 177, 1833–1837. - PubMed

Publication types

MeSH terms