. 2020 Jul 7;32(1):107874.
doi: 10.1016/j.celrep.2020.107874.

Regulatory T Cells Play a Role in a Subset of Idiopathic Preterm Labor/Birth and Adverse Neonatal Outcomes

Affiliations

Regulatory T Cells Play a Role in a Subset of Idiopathic Preterm Labor/Birth and Adverse Neonatal Outcomes

Nardhy Gomez-Lopez et al. Cell Rep. .

Abstract

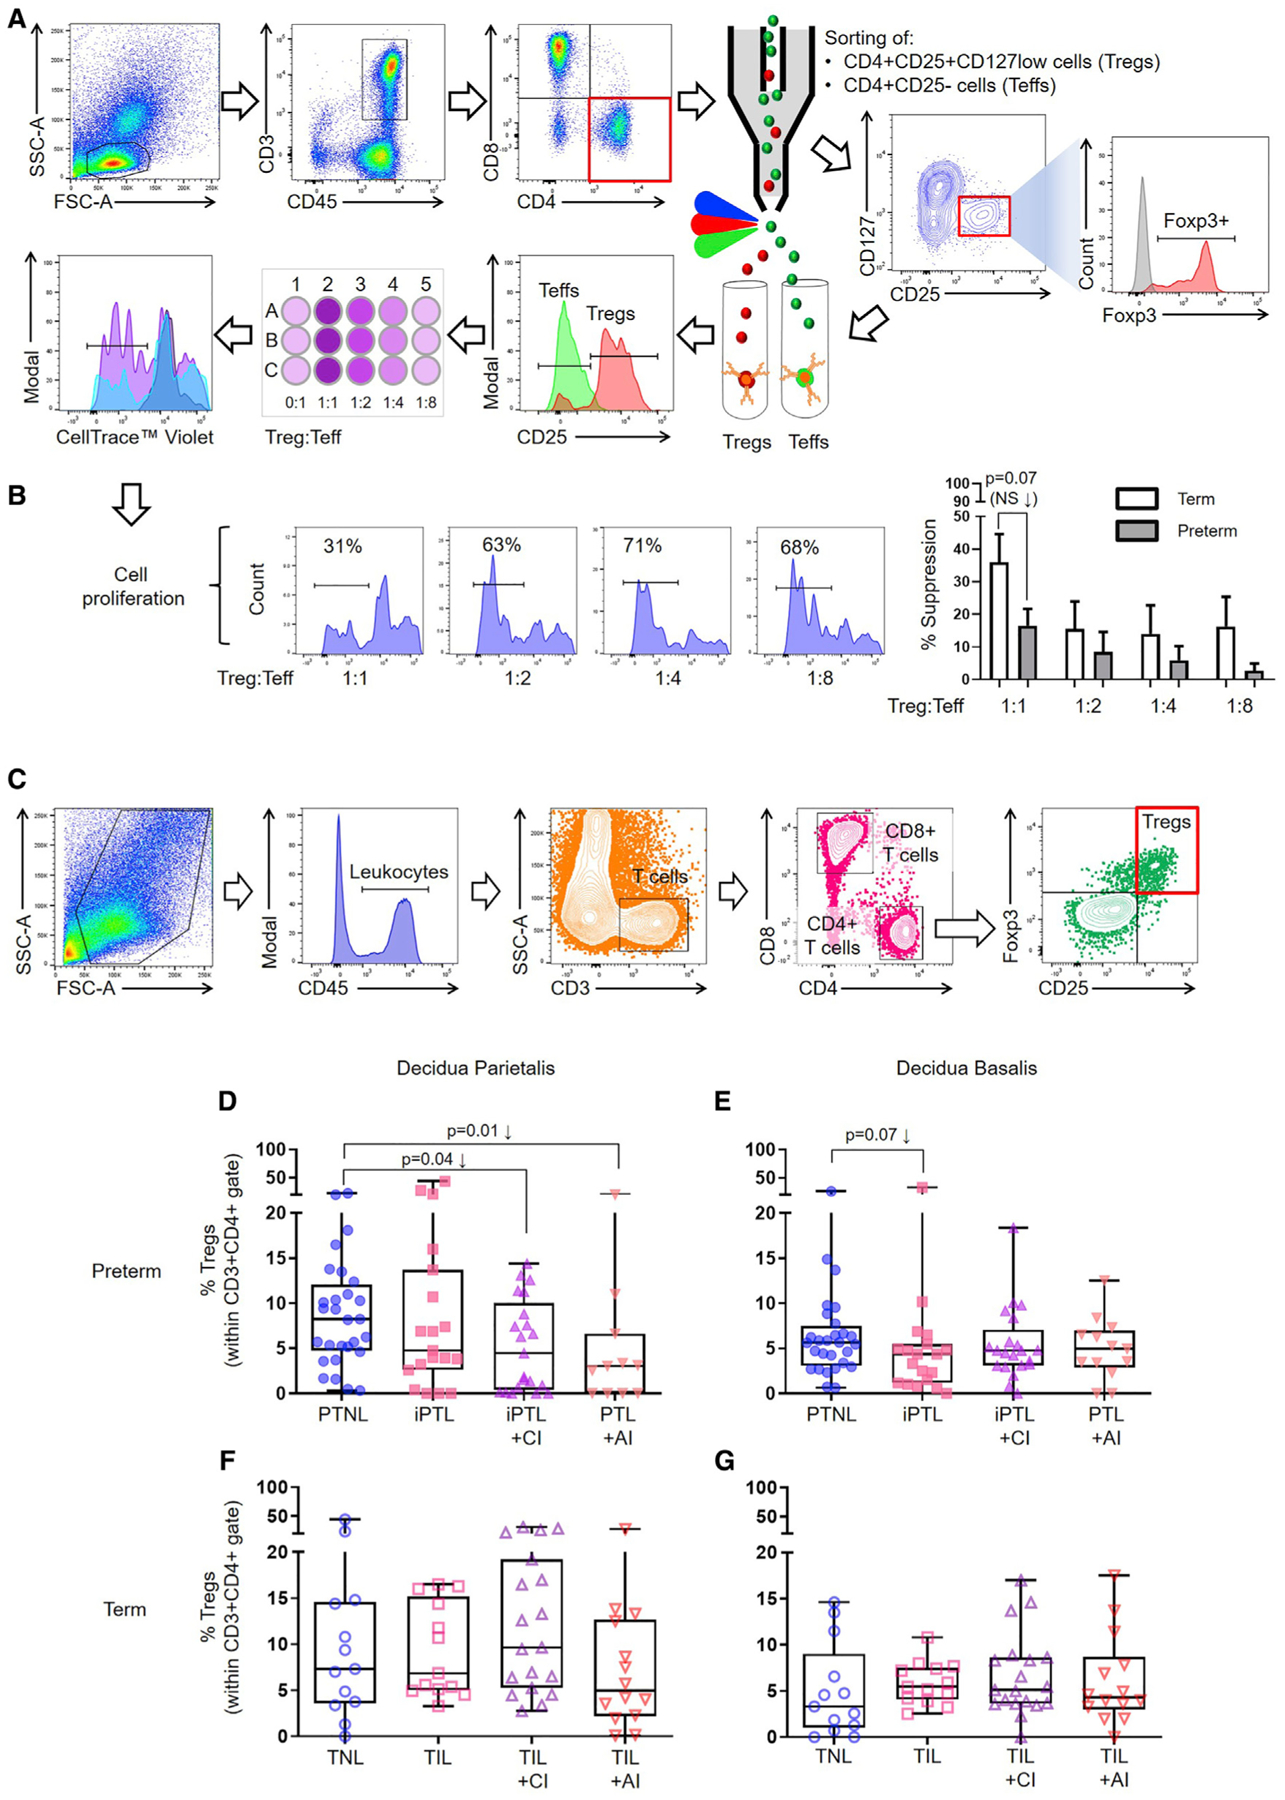
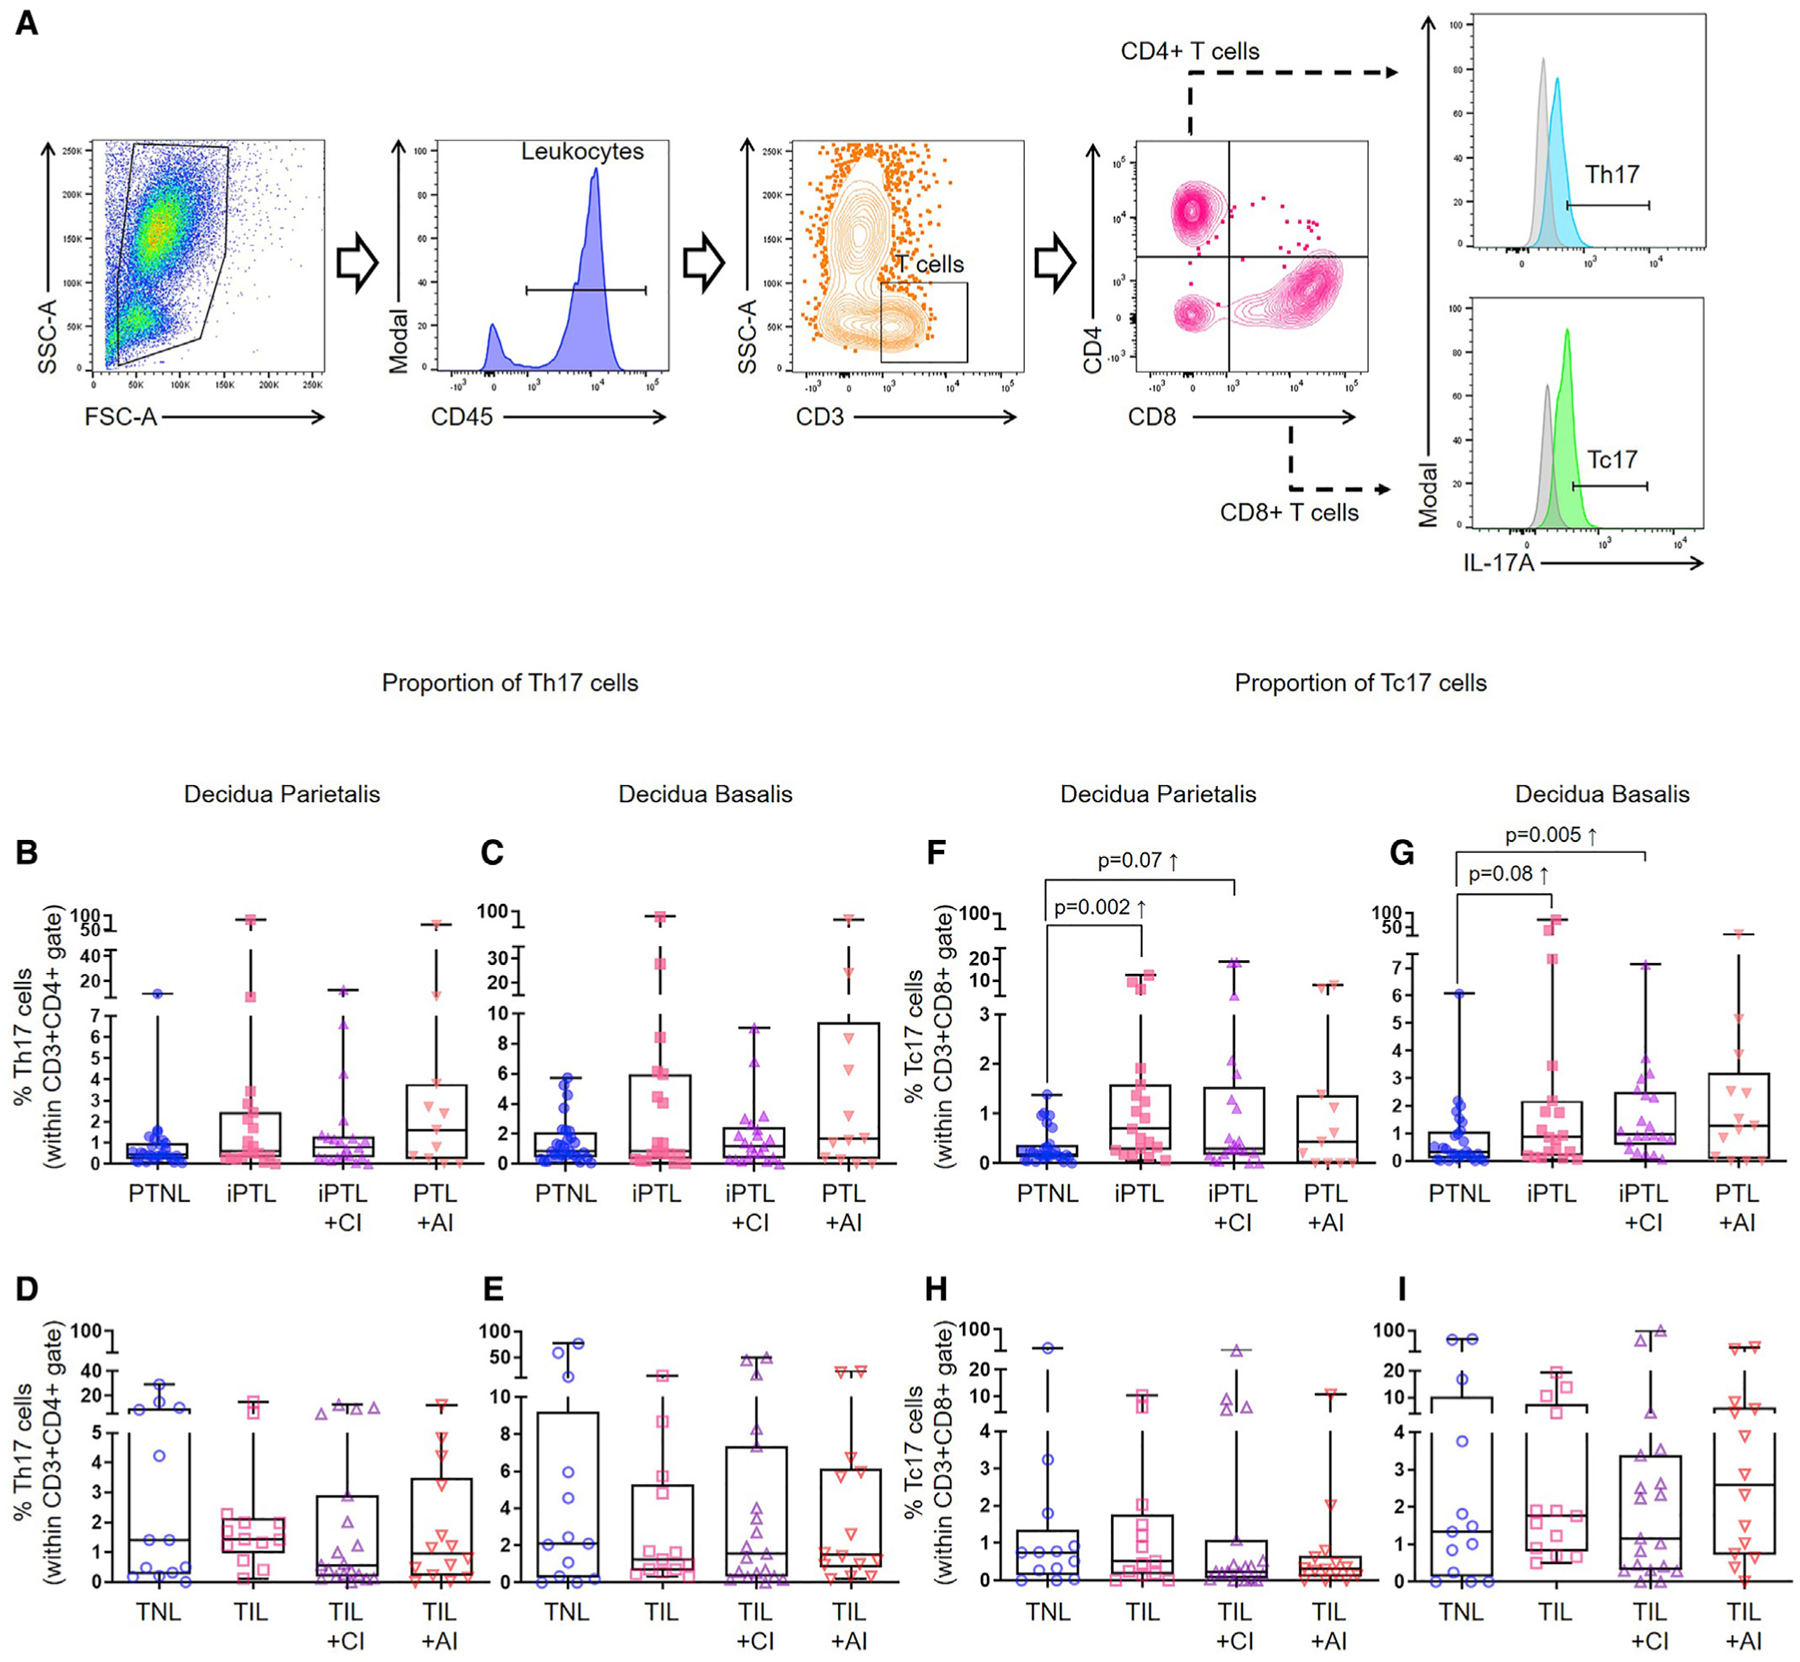
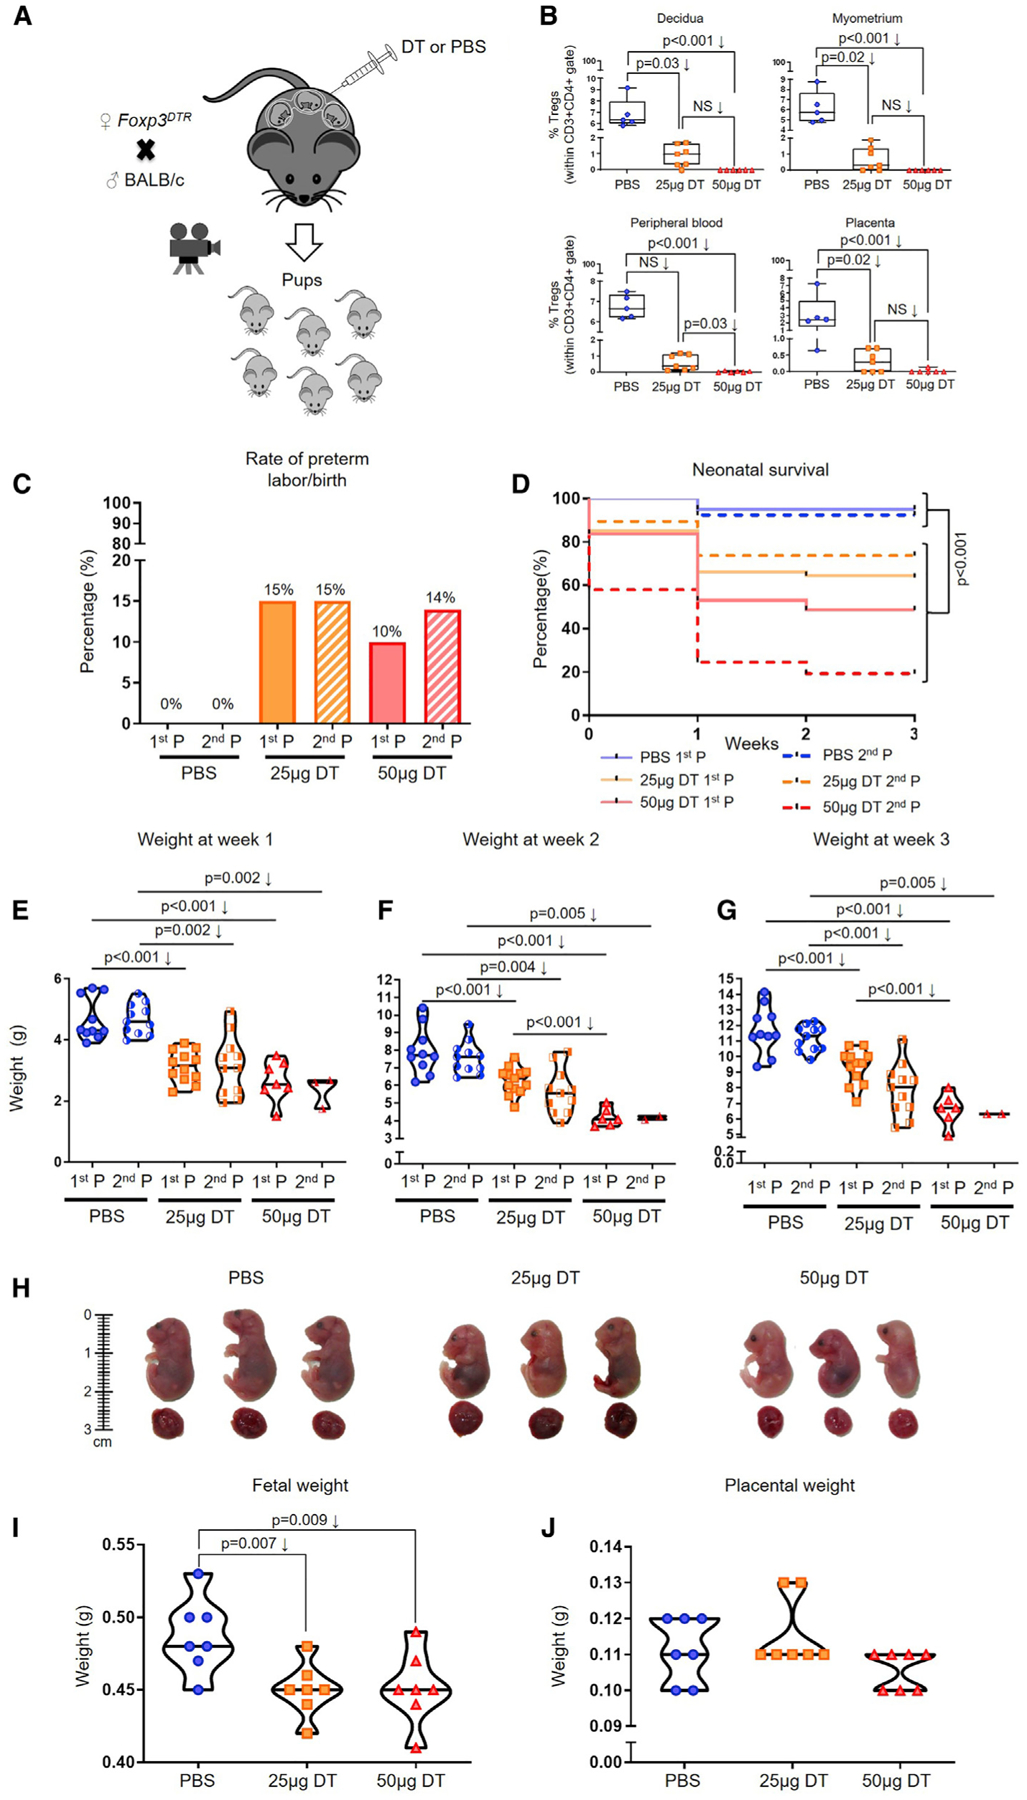
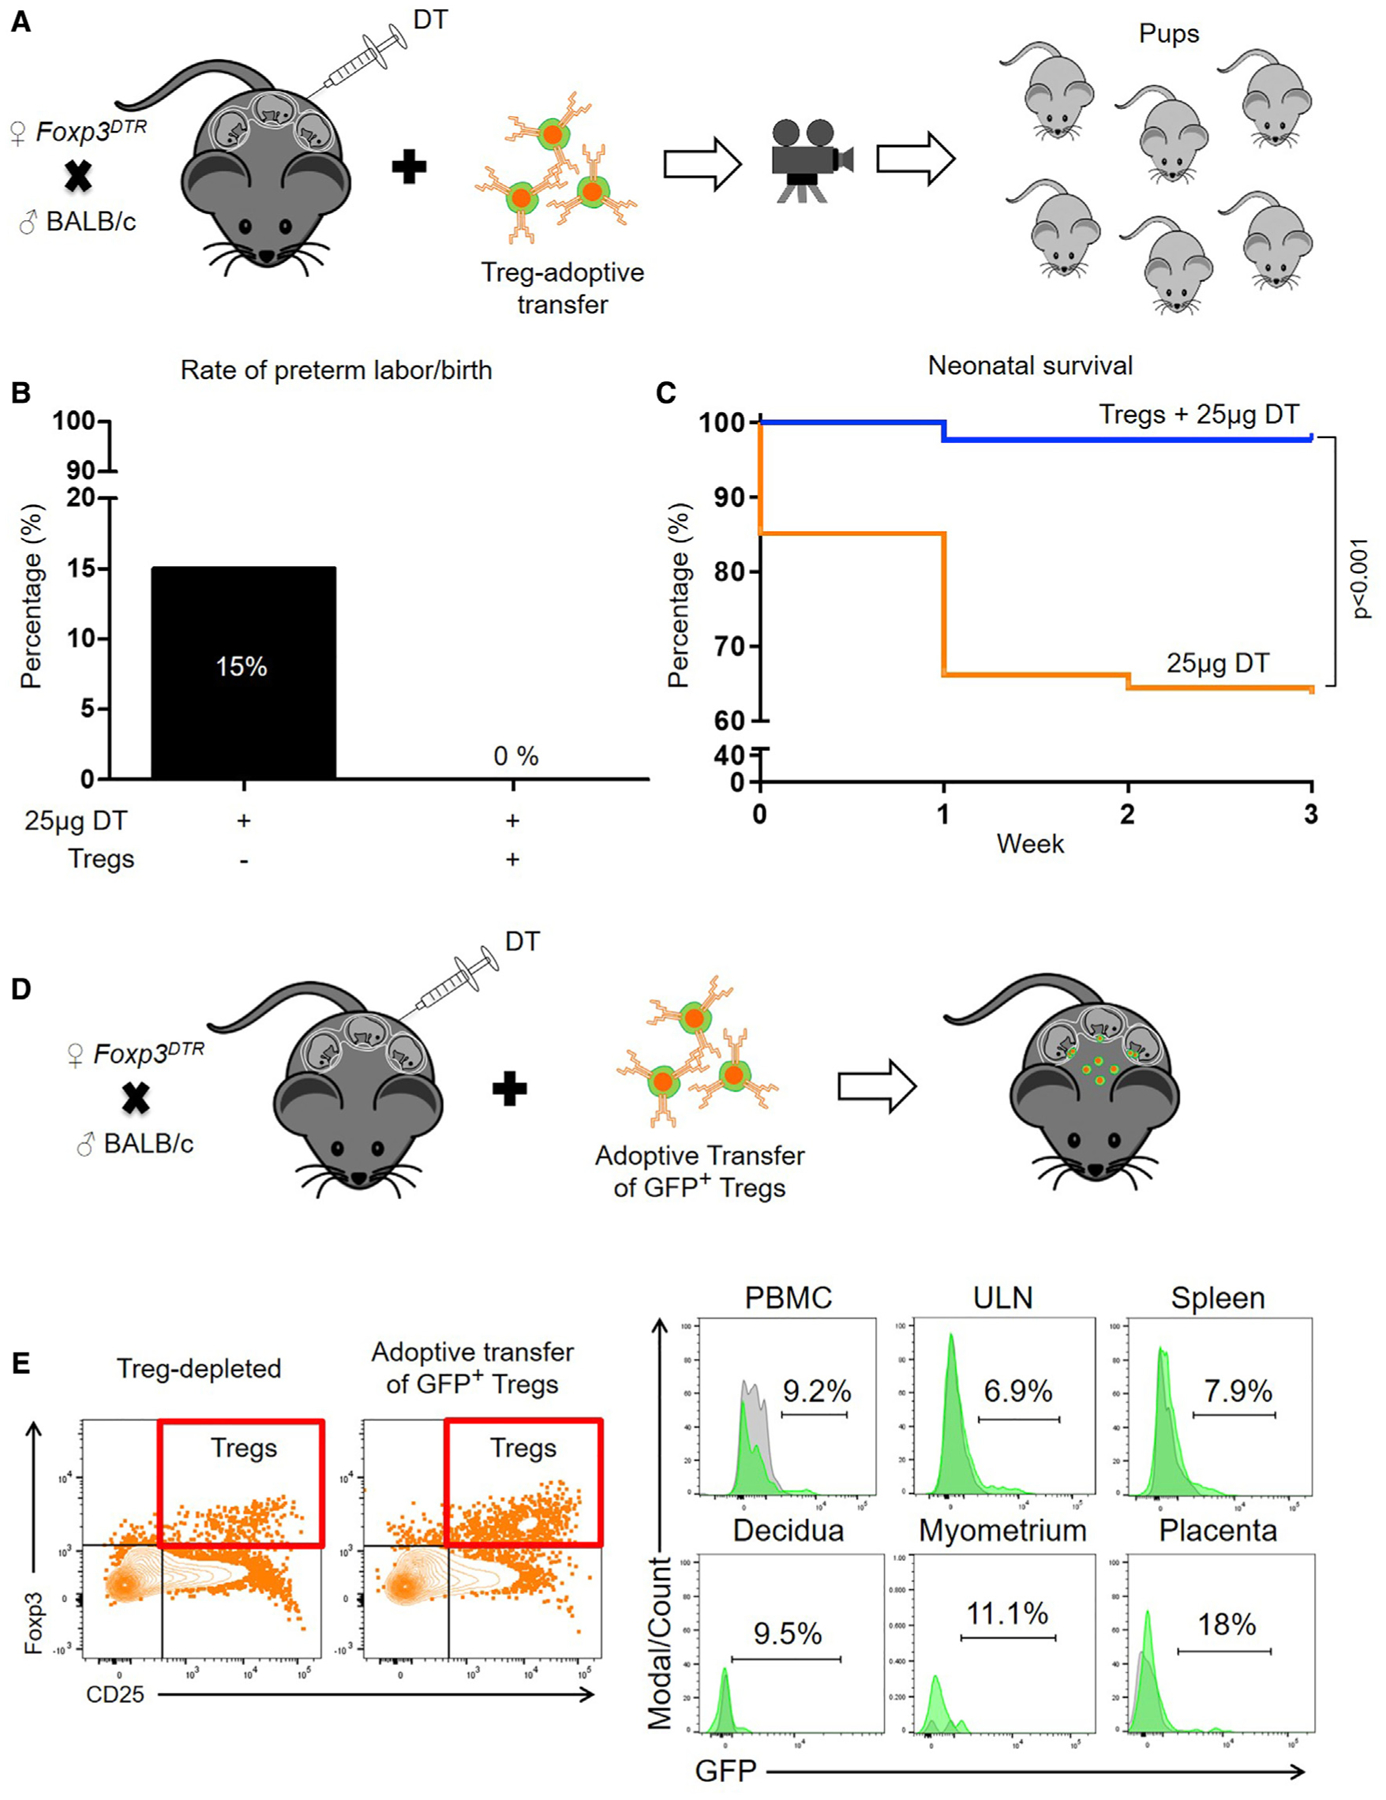
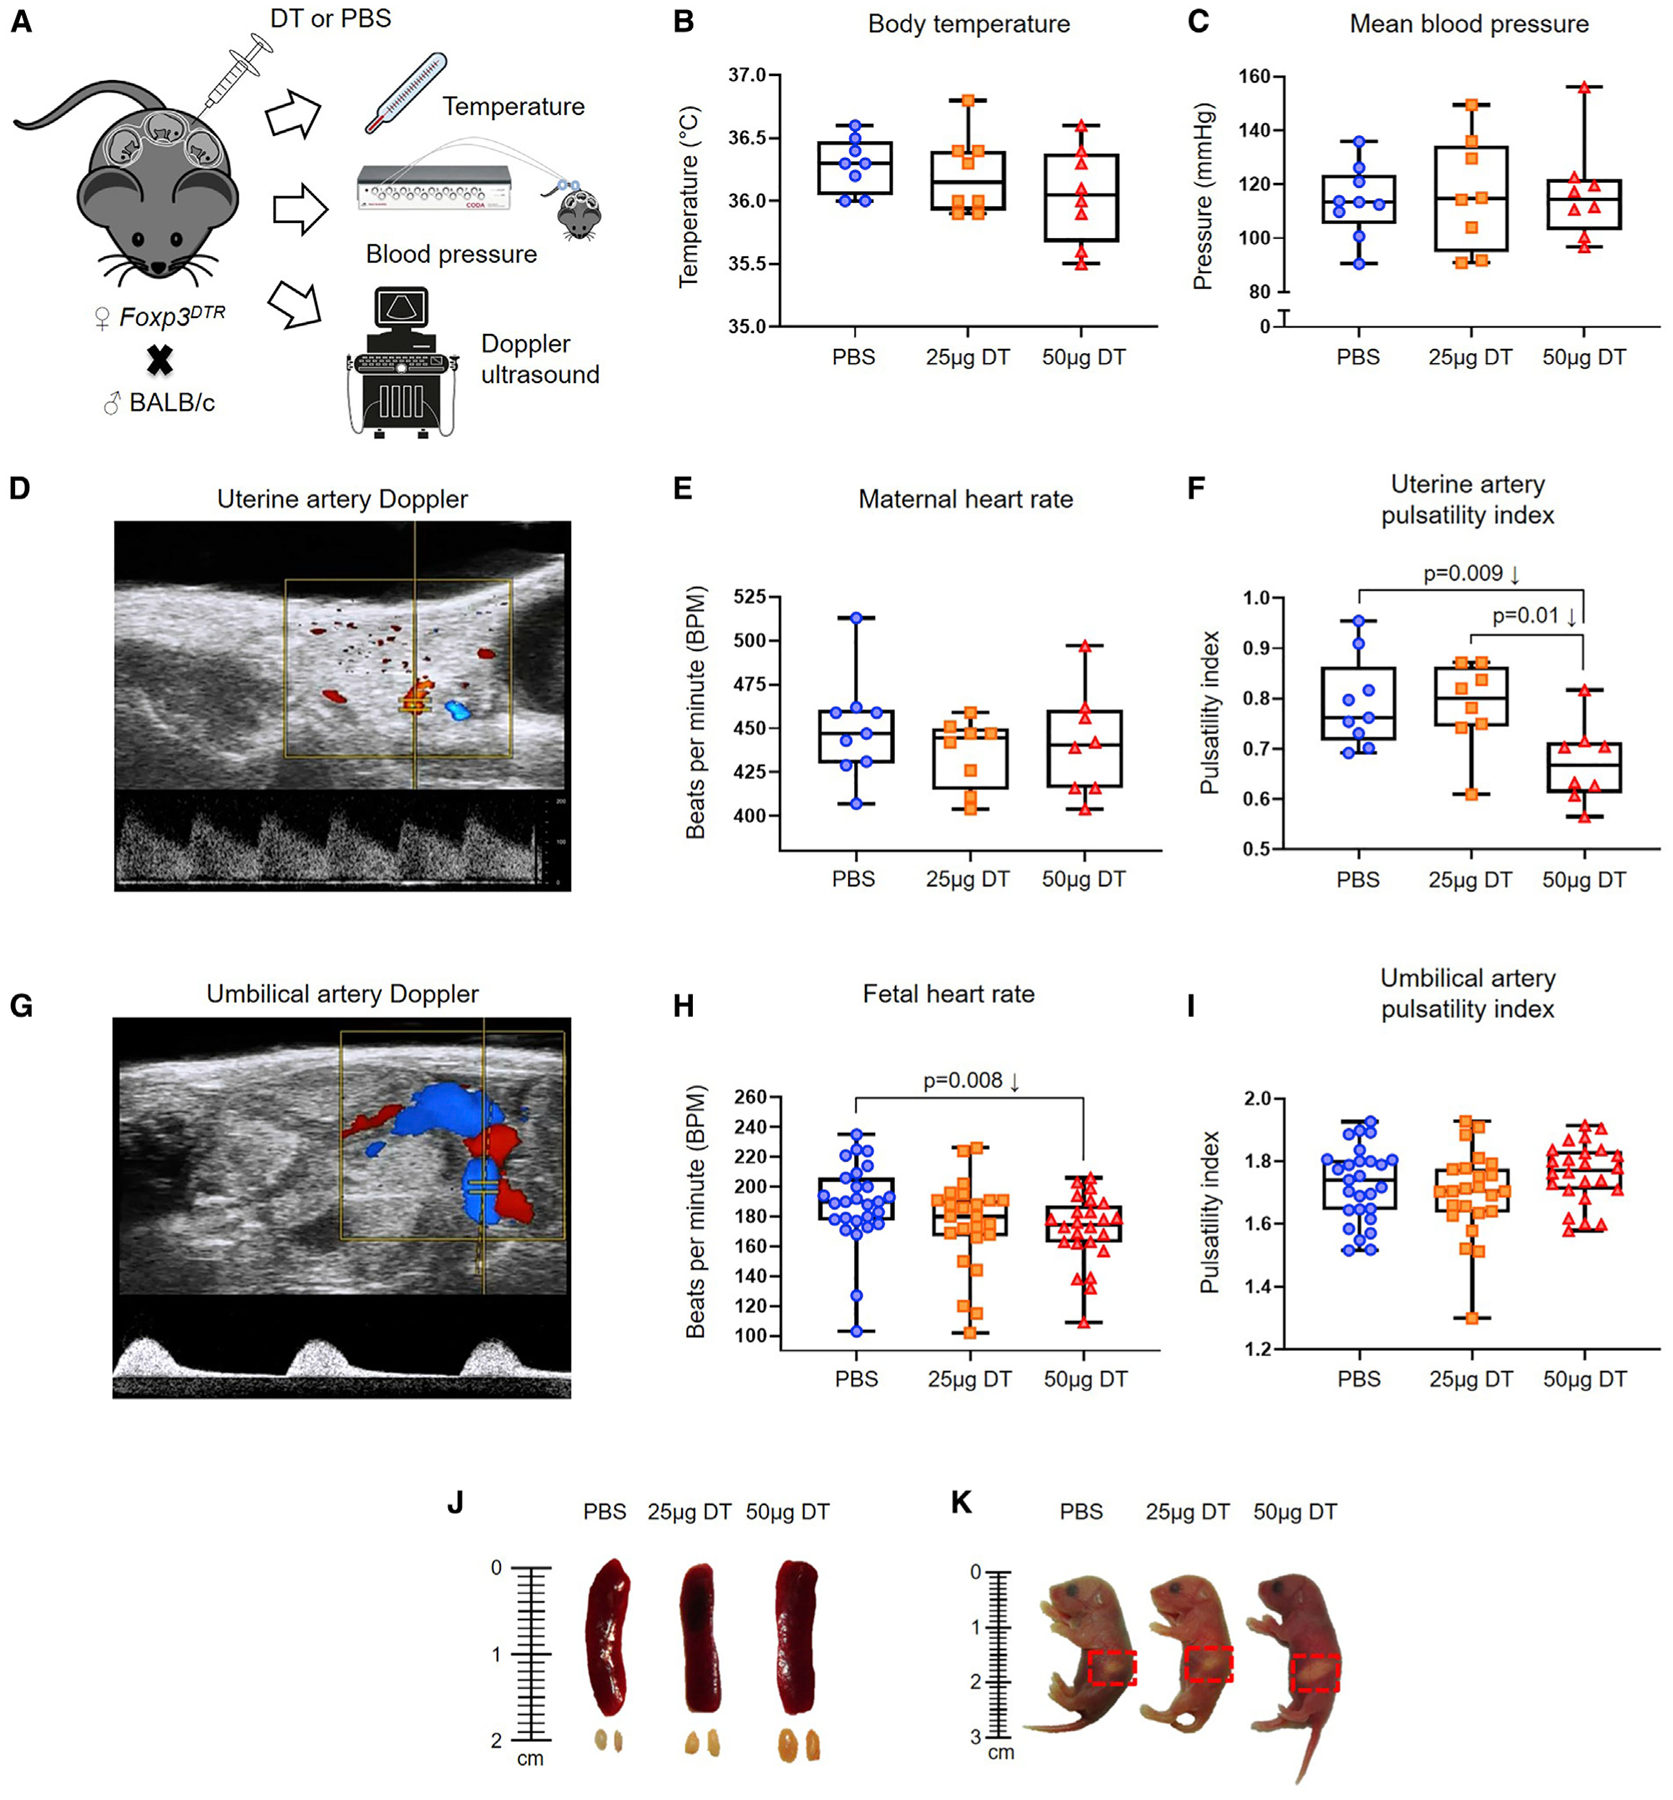
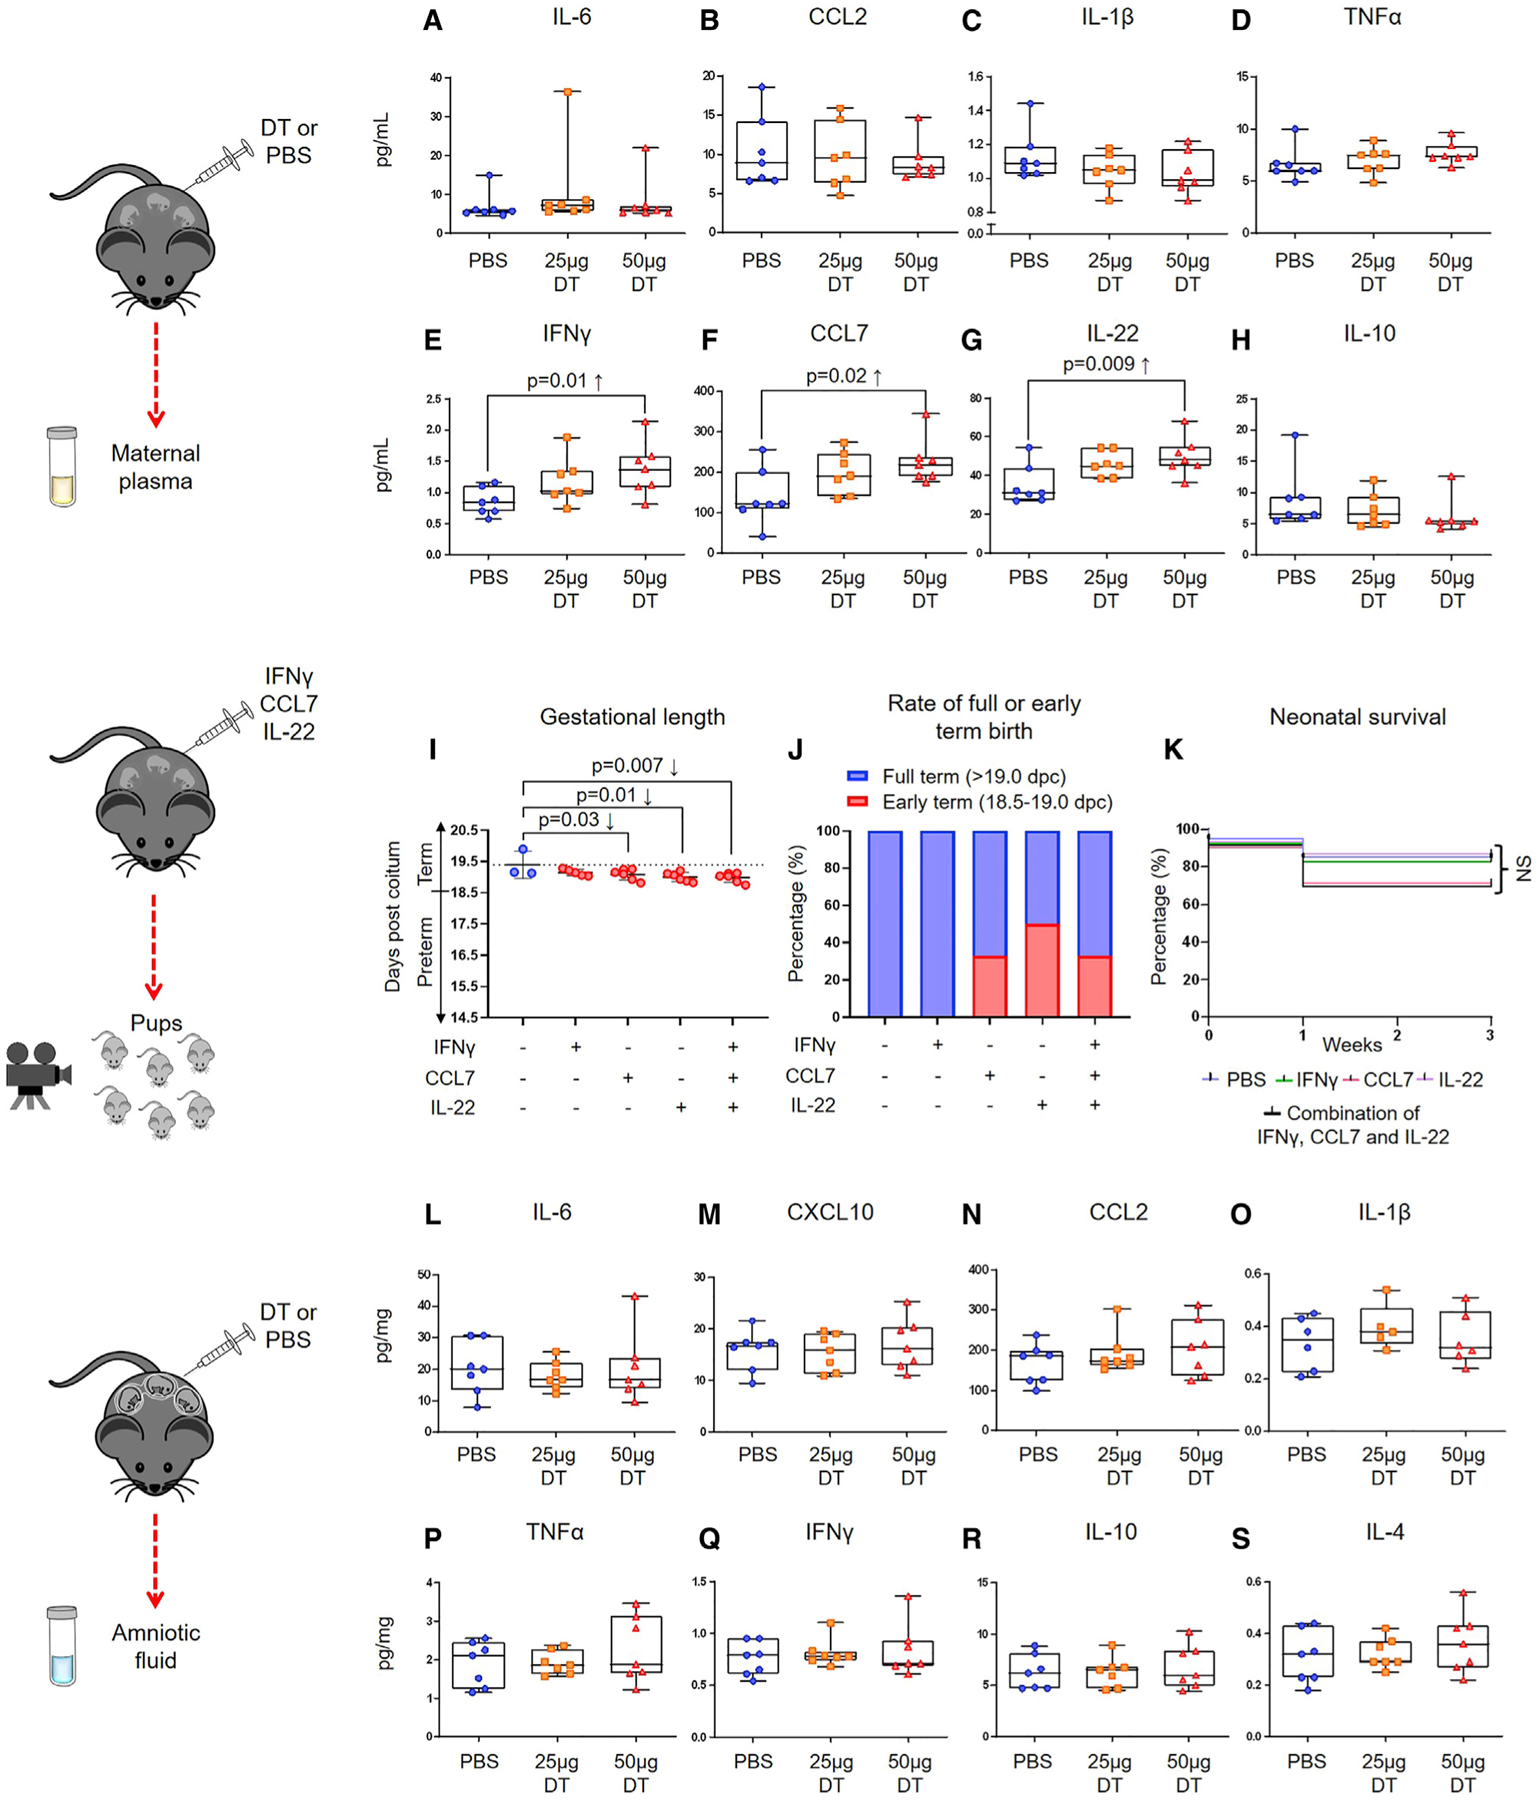
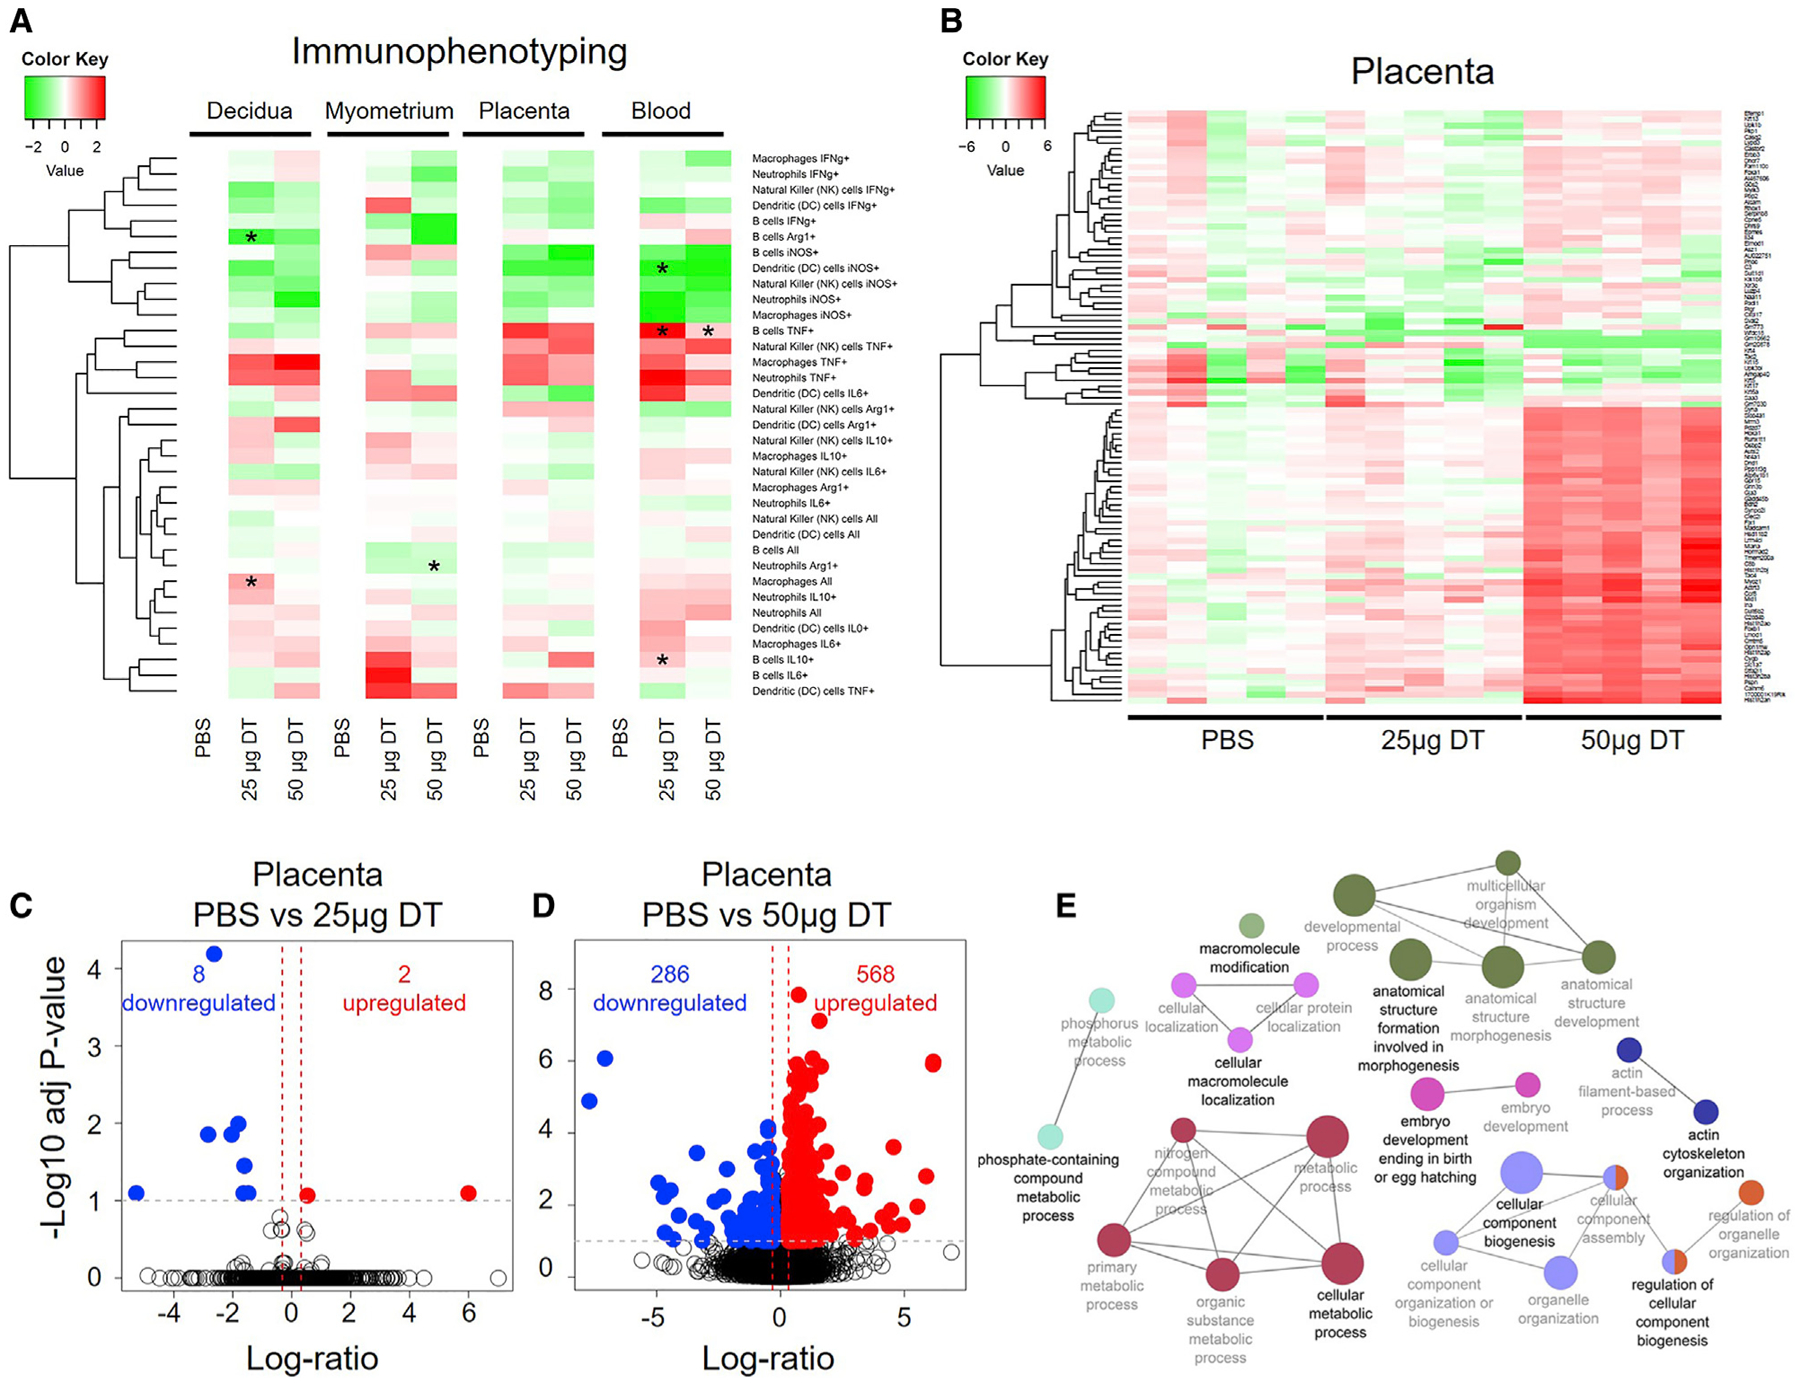
Regulatory T cells (Tregs) have been exhaustively investigated during early pregnancy; however, their role later in gestation is poorly understood. Herein, we report that functional Tregs are reduced at the maternal-fetal interface in a subset of women with idiopathic preterm labor/birth, which is accompanied by a concomitant increase in Tc17 cells. In mice, depletion of functional Tregs during late gestation induces preterm birth and adverse neonatal outcomes, which are rescued by the adoptive transfer of such cells. Treg depletion does not alter obstetrical parameters in the mother, yet it increases susceptibility to endotoxin-induced preterm birth. The mechanisms whereby depletion of Tregs induces adverse perinatal outcomes involve tissue-specific immune responses and mild systemic maternal inflammation, together with dysregulation of developmental and cellular processes in the placenta, in the absence of intra-amniotic inflammation. These findings provide mechanistic evidence supporting a role for Tregs in the pathophysiology of idiopathic preterm labor/birth and adverse neonatal outcomes.

Keywords: T cells; amniotic fluid; decidua; fetal growth restriction; maternal-fetal interface; myometrium; neonate; parturition; placenta; prematurity.


Conflict of interest statement

Declaration of Interests The authors declare no competing interests.

Figures

Figure 1.
Figure 1.. Functional Tregs Are Reduced at the Human Maternal-Fetal Interface in a Subset of Idiopathic PTL and birth
(A) Representative gating strategy used to sort Tregs and Teffs from the decidua. Tregs were co-cultured with Teffs, and Teff proliferation was measured by flow cytometry using CellTrace violet. (B) Representative plots showing the proliferation of Teffs, with the percentage of decidual Treg suppression of Teffs from preterm and term pregnancies. Suppression data are shown as means ± SEM. n = 6–8 per group. (C) Representative gating strategy used to identify Tregs in the decidua parietalis and decidua basalis. (D and E) Frequency of Tregs in the (D) decidua parietalis (n = 11–28 per group) or (E) decidua basalis (n = 13–28 per group) of women with PTNL, iPTL, iPTL+CI, or PTL+AI. (F and G) Frequency of Tregs in the (F) decidua parietalis (n = 13–19 per group) or (G) decidua basalis (n = 13–19 per group) of women with TNL, TIL, TIL+CI, or TIL+AI. Data are represented as medians with interquartile and minimum/maximum ranges. Statistical analysis was performed using the Mann-Whitney U-test. Demographic and clinical characteristics of the study population are shown in Tables S1 and S2.
Figure 2.
Figure 2.. Tc17 Cells Are Increased at the Human Maternal-Fetal Interface in Idiopathic PTL and birth
(A) Representative gating strategy used to identify Th17 cells and Tc17 cells in the decidua parietalis and decidua basalis. (B and C) Frequency of Th17 cells in the (B) decidua parietalis (n = 11–28 per group) or (C) decidua basalis (n = 13–28 per group) of women with PTNL, iPTL, iPTL+CI, or PTL+AI. (D and E) Frequency of Th17 cells in the (D) decidua parietalis (n = 13–19 per group) or (E) decidua basalis (n = 13–19 per group) of women with TNL, TIL, TIL+CI, or TIL+AI. (F and G) Frequency of Tc17 cells in the (F) decidua parietalis (n = 11–28 per group) or (G) decidua basalis (n = 13–28 per group) of women with PTNL, iPTL, iPTL+CI, or PTL+AI. (H and I) Frequency of Tc17 cells in the (H) decidua parietalis (n = 13–19 per group) or (I) decidua basalis (n = 13–19 per group) of women with TNL, TIL, TIL+CI, or TIL+AI. Data are represented as medians with interquartile and minimum/maximum ranges. Statistical analysis was performed using the Mann-Whitney U-test. Demographic and clinical characteristics of the study population are shown in Table S2.
Figure 3.
Figure 3.. Depletion of Tregs Induces a Fraction of Preterm Births and Adverse Neonatal Outcomes
(A) Foxp3DTR dams underwent partial or total Treg depletion. Controls were injected with sterile 13 PBS. After the first pregnancy (P), a subset of Foxp3DTR dams underwent a second P and were again partially or totally Treg-depleted or were injected with sterile 13 PBS. (B) Frequencies of Tregs in the decidua, myometrium, peripheral blood, and placenta of partially or totally Treg-depleted Foxp3DTR dams (n = 5–7 per group). Data are represented as medians with interquartile and minimum/maximum ranges. (C) Preterm birth rates of non-Treg-depleted-, partially Treg-depleted-, and totally Treg-depleted-Foxp3DTR dams (1st or 2nd P, n = 9–20 per group). Data are represented as means of percentages. (D) Percentage of survival from birth until 3 weeks postpartum for neonates born to non-Treg-depleted-, partially Treg-depleted-, and totally Treg-depleted-Foxp3DTR dams (1st or 2nd P, n = 7–18 per group). (E–G) Weights of neonates born to non-Treg-depleted-, partially Treg-depleted-, and totally Treg-depleted-Foxp3DTR dams at weeks (E) 1, (F) 2, and (G) 3 postpartum (1st or 2nd P, n = 2–12 litters per group). Data are represented as violin plots with medians and minimum/maximum ranges. (H) Representative images of fetuses (and their placentas) from non-Treg-depleted-, partially Treg-depleted-, and totally Treg-depleted-Foxp3DTR dams (n = 8–9 per group). (I and J) Weights of (I) fetuses and (J) their placentas from non-Treg-depleted-, partially Treg-depleted-, and totally Treg-depleted-Foxp3DTR dams (n = 7 litters per group). Statistical analysis was performed using the Mantel-Cox test for survival curves, and Kruskal-Wallis or ANOVA tests with correction for multiple comparisons. See also Figures S1–S4.
Figure 4.
Figure 4.. The Adoptive Transfer of Tregs Prevents Preterm Birth and Adverse Neonatal Outcomes
(A) Foxp3DTR dams underwent partial Treg depletion. On 14.5 and 16.5 dpc, Foxp3DTR dams received an adoptive transfer of Tregs from wild-type mice. (B) Preterm birth rates of partially Treg-depleted Foxp3DTR dams without or with the adoptive transfer of Tregs (n = 6–20 per group). Data are represented as means of percentages. (C) Percentage of survival from birth until 3 weeks postpartum for neonates born to partially Treg-depleted Foxp3DTR dams without or with the adoptive transfer of Tregs (n = 6–20 per group). (D) Foxp3DTR dams underwent partial Treg depletion. On 14.5 and 16.5 dpc, Foxp3DTR dams received an adoptive transfer of Tregs from EGFP mice. (E) Representative gating and histograms showing adoptively transferred GFP+ Tregs in the decidua, myometrium, placenta, and peripheral tissues (peripheral blood mononuclear cells [PBMCs], uterine-draining lymph nodes [ULNs], and spleen) of recipient Treg-depleted dams. Statistical analysis was performed using the Mantel-Cox test for survival curves.
Figure 5.
Figure 5.. Maternal-Fetal Obstetrical Parameters upon Partial or Total Treg Depletion
(A) Foxp3DTR dams underwent partial or total Treg depletion until 17.5 dpc on which body temperature, blood pressure, and Doppler determinations were performed (n = 8–9 per group). (B and C) Body temperature (B) and mean blood pressure (C) of non-Treg-depleted-, partially Treg-depleted-, and totally Treg-depleted-Foxp3DTR dams (n = 8–9 per group). (D–F) Representative Doppler image of the uterine artery (D), which was used to determine (E) maternal heart rate, and (F) uterine artery pulsatility index of non-Treg-depleted-, partially Treg-depleted-, and totally Treg-depleted-Foxp3DTR dams (n = 8–9 per group). (G–I) Representative Doppler image of the umbilical artery (G), which was used to determine (H) fetal heart rate, and (I) umbilical artery pulsatility index in fetuses of non-Treg-depleted-, partially Treg-depleted-, and totally Treg-depleted-Foxp3DTR dams (n = 24–27 per group). (J) Representative images of the spleens and ULNs from non-Treg-depleted-, partially Treg-depleted-, and totally Treg-depleted-Foxp3DTR dams (n = 3 per group). (K) Representative images of neonates born to non-Treg-depleted-, partially Treg-depleted-, and totally Treg-depleted-Foxp3DTR dams on the day of birth (n = 3 per group). Red dotted squares indicate the presence of the milk band. Statistical analysis was performed using the Kruskal-Wallis or ANOVA tests with correction for multiple comparisons.
Figure 6.
Figure 6.. Depletion of Tregs Induces a Mild Systemic Inflammatory Response in the Absence of Intra-Amniotic Inflammation
(A–H) Foxp3DTR dams underwent partial or total Treg depletion. Controls were injected with sterile 13 PBS. Mice were euthanized approximately 4 h after the second DT or PBS injection, and maternal plasma samples and amniotic fluid were collected. Concentrations of (A) IL-6, (B) CCL2, (C) IL-1β, (D) TNF-α, (E) IFNγ, (F) CCL7, (G) IL-22, and (H) IL-10 in the maternal plasma (n = 7 per group). Data are shown as medians with interquartile ranges and minimum/maximum ranges. C57BL/6 dams were intravenously injected with recombinant mouse IFNγ (1.4 pg/100 μL), CCL7 (218 pg/100 μL), IL-22 (48 pg/100 μL), or a combination of all three. Controls were injected with 100 μL of sterile 13 PBS alone. (I) Gestational length of cytokine-injected dams. Data are shown as means with standard deviations (n = 3–6 per group). (J) Rate of early-term or full-term delivery of cytokine-injected dams (n = 3–6 per group). (K) Percentage of survival from birth until 3 weeks postpartum for neonates born to cytokine-injected dams (n = 3–6 litters per group). (L–S) Concentrations of (L) IL-6, (M) CXCL10, (N) CCL2, (O) IL-1β, (P) TNF-α, (Q) IFNγ, (R) IL-10, and (S) IL-4 in the amniotic fluid (n = 5–7 per group). Data are shown as medians with interquartile ranges and minimum/maximum ranges. Statistical analysis was performed using the Mantel-Cox test for survival curves, and Kruskal-Wallis or ANOVA tests with correction for multiple comparisons. See also Figure S5.
Figure 7.
Figure 7.. Depletion of Tregs Is Associated with Altered Systemic and Local Cellular Immune Responses and Dysregulation of Developmental and Cellular Processes in the Placenta
Foxp3DTR dams underwent partial or total Treg depletion. Controls were injected with sterile 13 PBS. Mice were euthanized approximately 4 h after the second injection and the decidua, myometrium, placenta, and peripheral blood were collected for flow cytometry (all tissues, n = 5–7 per group) or for RNA-seq analysis (placenta only, n = 5 per group). (A) Heatmap visualization of changes in the log2-transformed frequencies of immune cell subsets in the decidua, myometrium, placenta, and peripheral blood of partially and totally Treg-depleted Foxp3DTR dams relative to controls. Red and green indicate increased and reduced abundance, respectively, relative to PBS controls. (B) Heatmap visualization of changes in gene expression in the placentas of partially and totally Treg-depleted Foxp3DTR dams and controls. Red indicates gene upregulation and green indicates gene downregulation relative to the average value in the PBS group. (C) Volcano plot showing genes differentially expressed between placentas from partially Treg-depleted Foxp3DTR dams and those from control dams. (D) Volcano plot showing genes differentially expressed between placental tissues from totally Treg-depleted Foxp3DTR dams and those from control dams. (E) Network of biological processes dysregulated in the placentas of totally Treg-depleted Foxp3DTR dams. Statistical analysis was performed using t-tests with false discovery rate adjustment. Asterisks indicate significant differences compared to controls after adjustment. See also Figure S6 and Tables S3, S4, S5, S6, S7, and S8.

References

    1. Aluvihare VR, Kallikourdis M, and Betz AG (2004). Regulatory T cells mediate maternal tolerance to the fetus. Nat. Immunol 5, 266–271. - PubMed
    1. Anders S, McCarthy DJ, Chen Y, Okoniewski M, Smyth GK, Huber W, and Robinson MD (2013). Count-based differential expression analysis of RNA sequencing data using R and Bioconductor. Nat. Protoc 8, 1765–1786. - PubMed
    1. Arck PC, and Hecher K (2013). Fetomaternal immune cross-talk and its consequences for maternal and offspring’s health. Nat. Med 19, 548–556. - PubMed
    1. Arenas-Hernandez M, Sanchez-Rodriguez EN, Mial TN, Robertson SA, and Gomez-Lopez N (2015). Isolation of Leukocytes from the Murine Tissues at the Maternal-Fetal Interface. J. Vis. Exp 99, e52866. - PMC - PubMed
    1. Arenas-Hernandez M, Romero R, St Louis D, Hassan SS, Kaye EB, and Gomez-Lopez N (2016). An imbalance between innate and adaptive immune cells at the maternal-fetal interface occurs prior to endotoxin-induced preterm birth. Cell. Mol. Immunol 13, 462–473. - PMC - PubMed

Publication types

MeSH terms