. 2020 Jul 14;53(1):115-126.e5.
doi: 10.1016/j.immuni.2020.06.009. Epub 2020 Jul 7.

Interferon-Independent Activities of Mammalian STING Mediate Antiviral Response and Tumor Immune Evasion

Affiliations

Interferon-Independent Activities of Mammalian STING Mediate Antiviral Response and Tumor Immune Evasion

Jianjun Wu et al. Immunity. .

Abstract

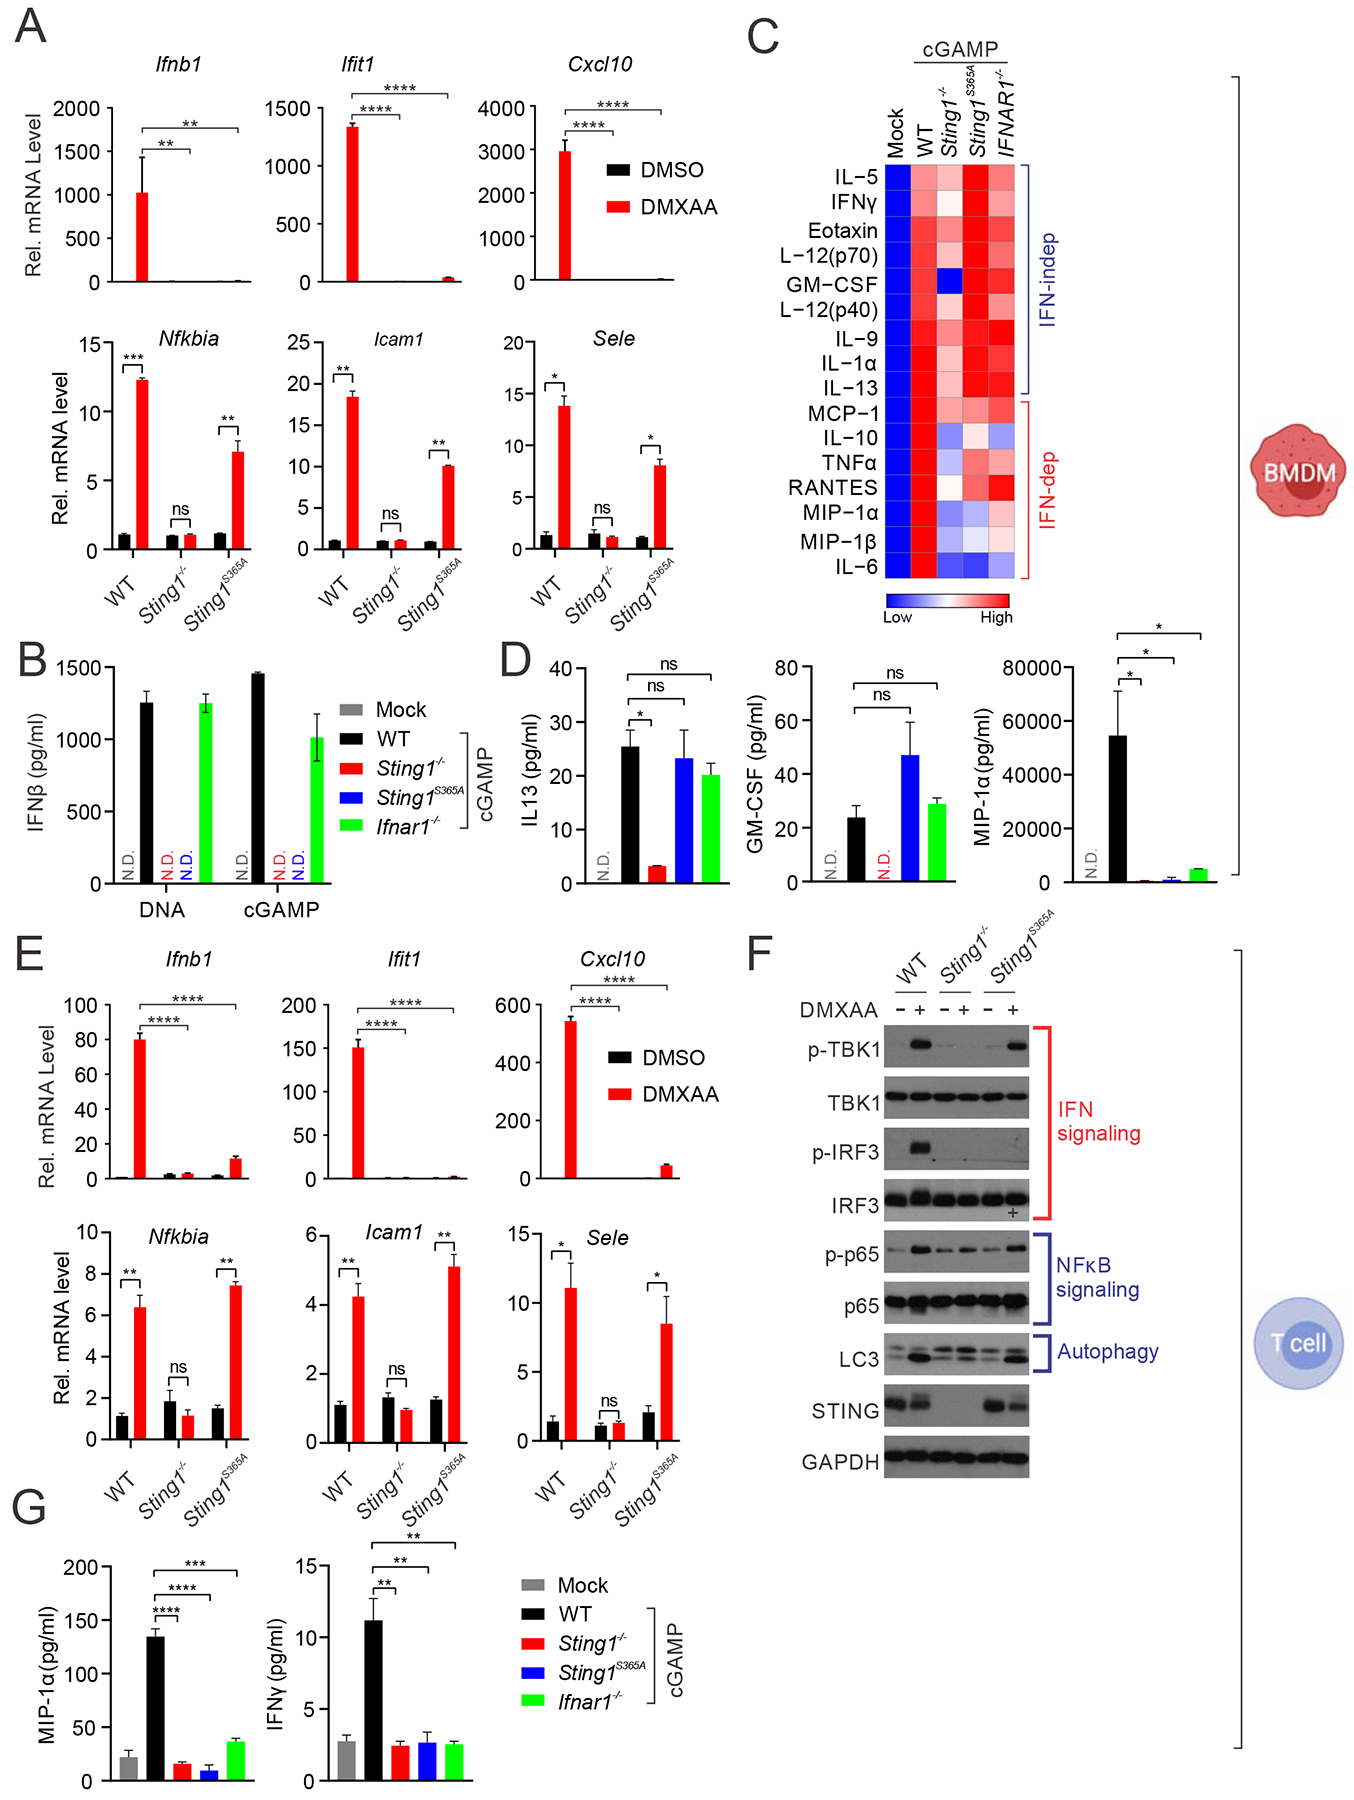
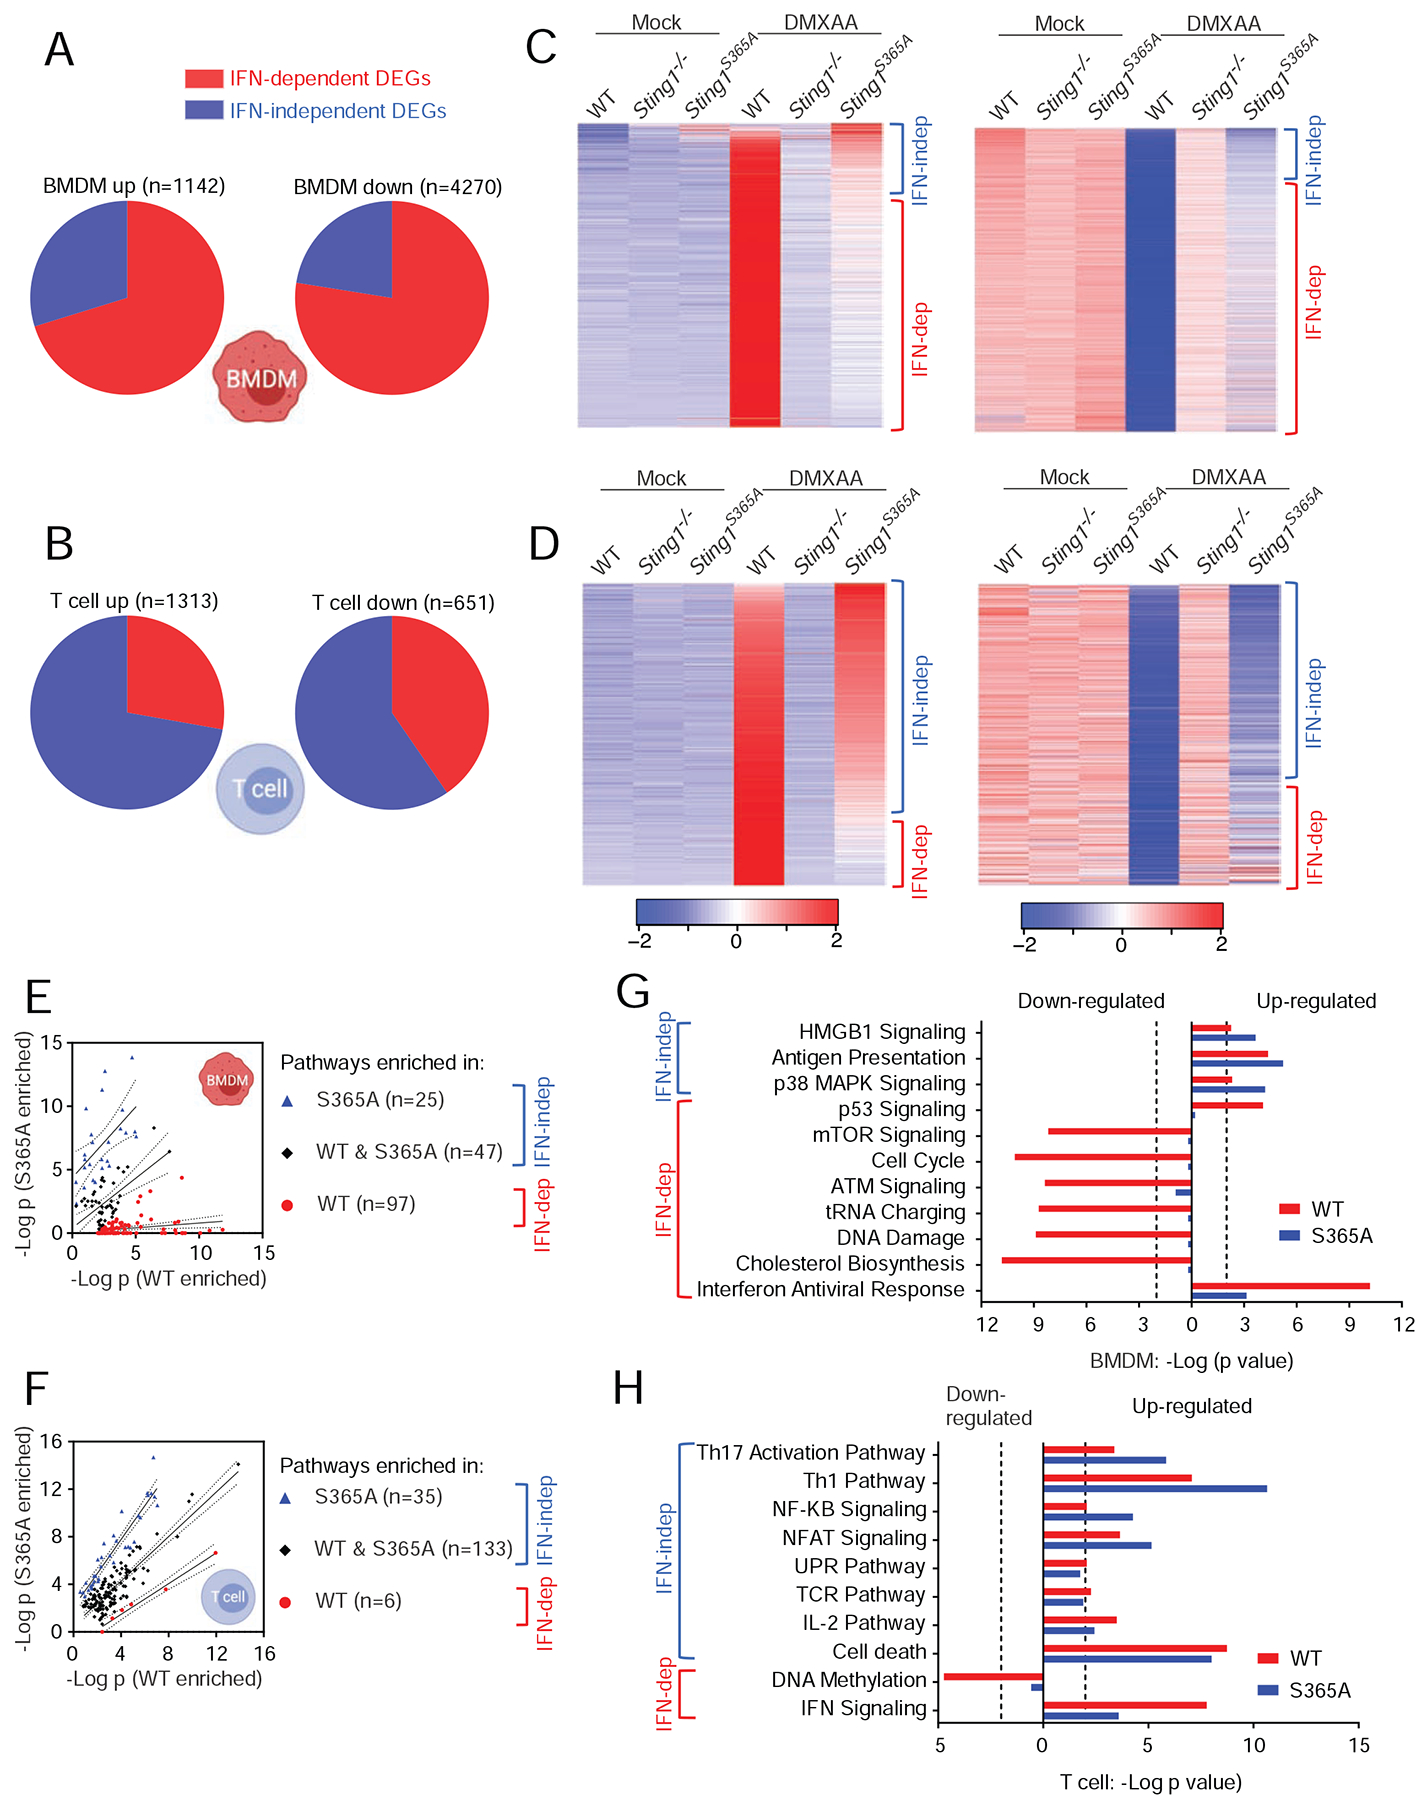
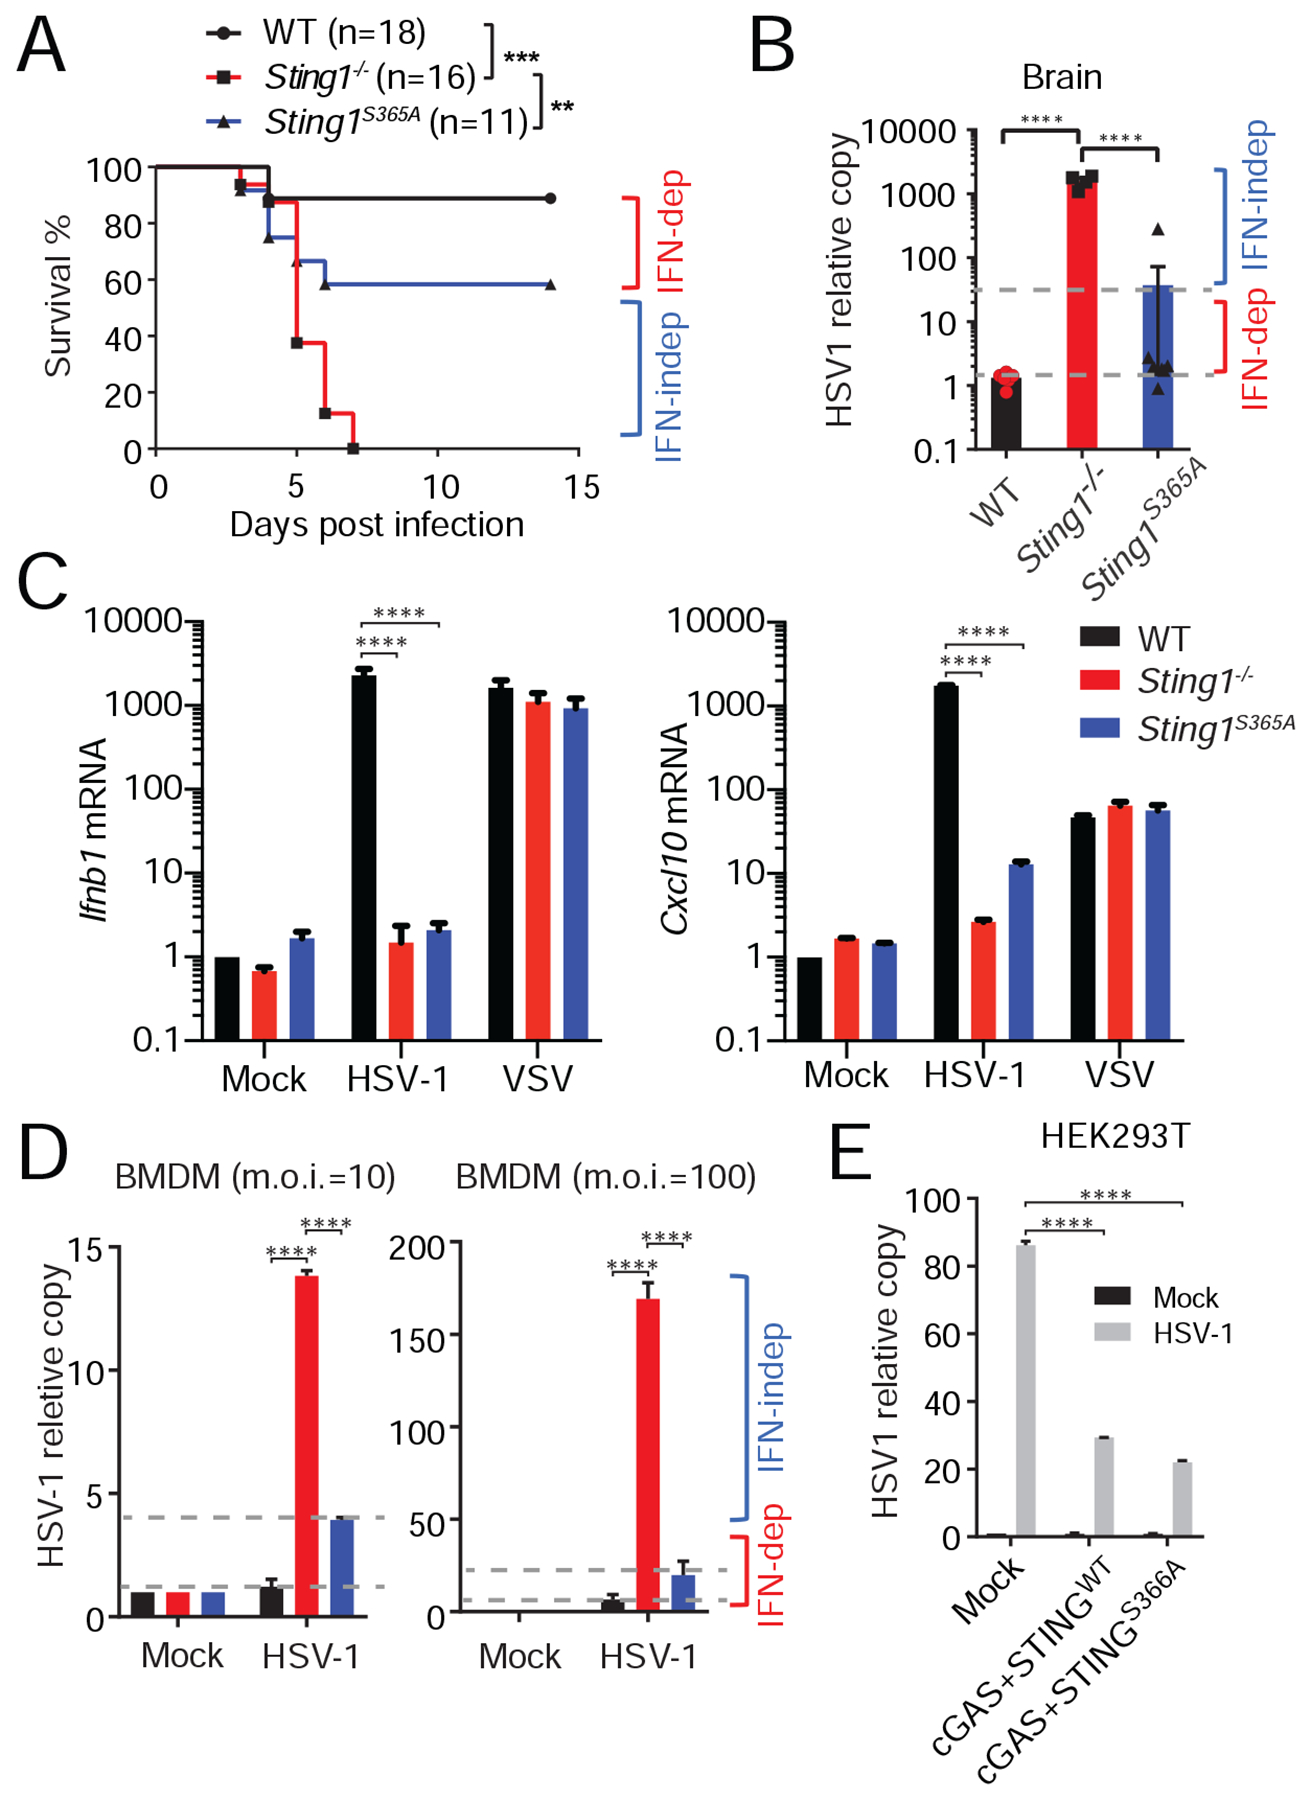
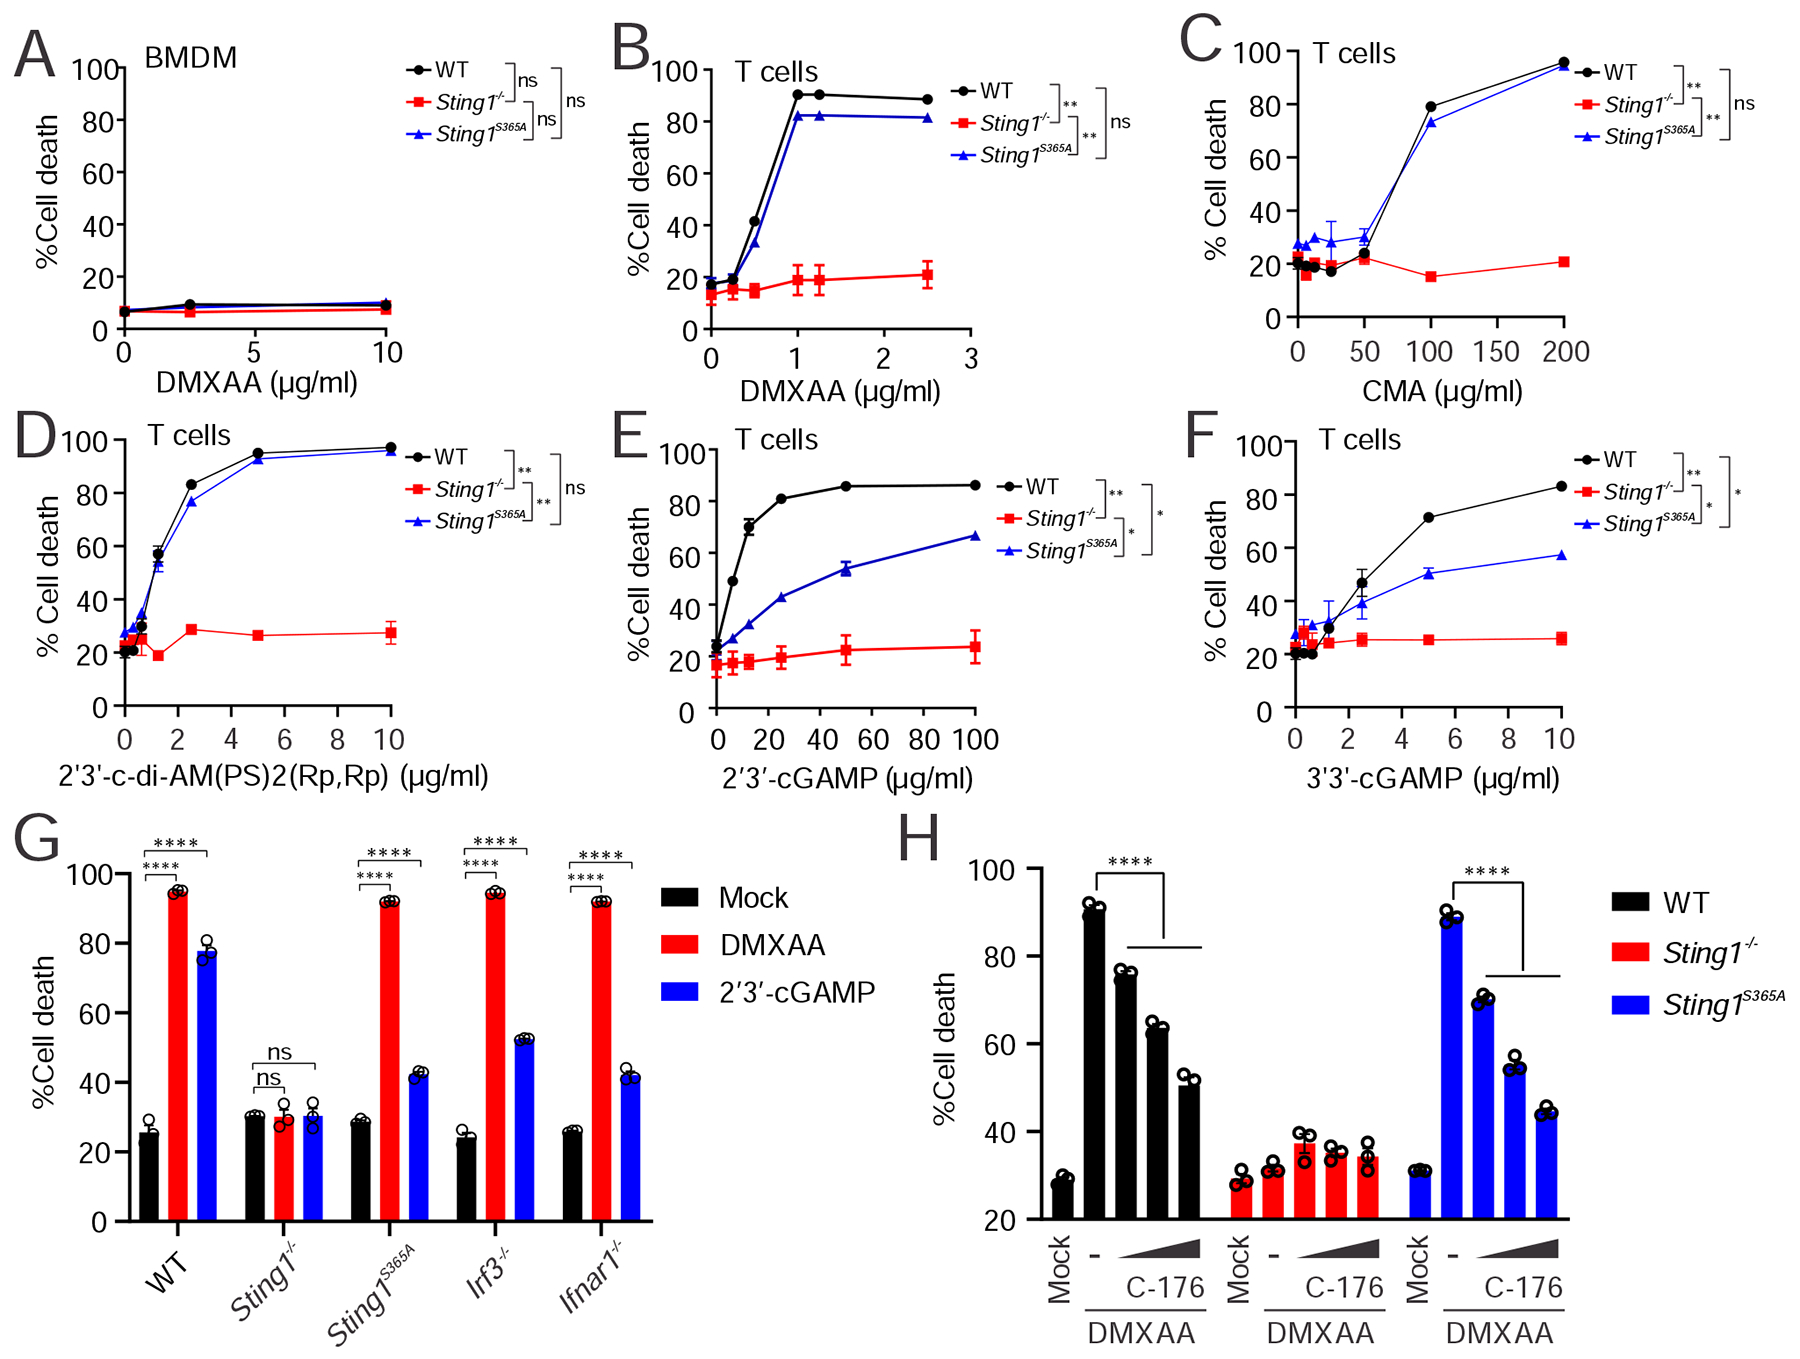
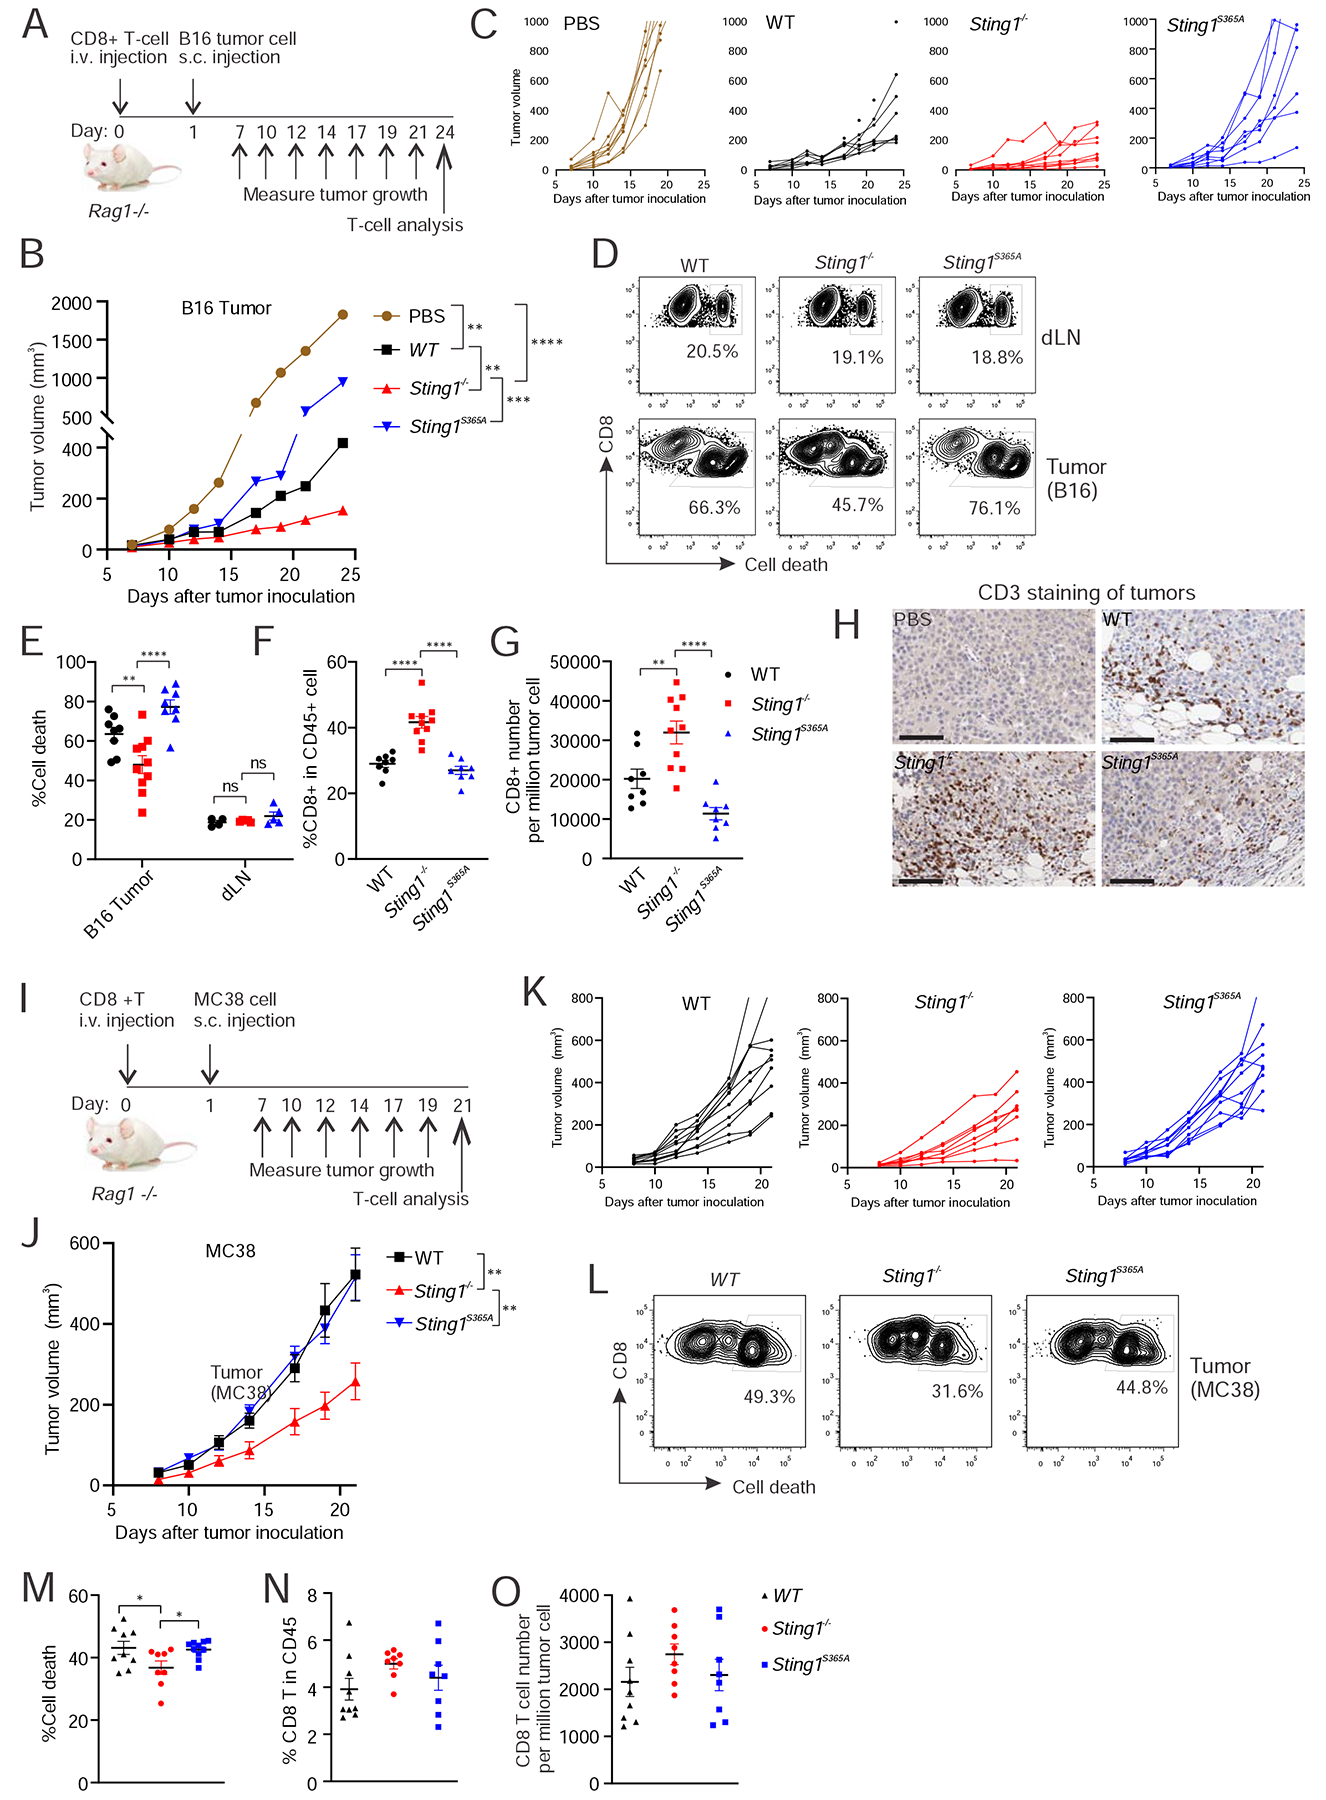
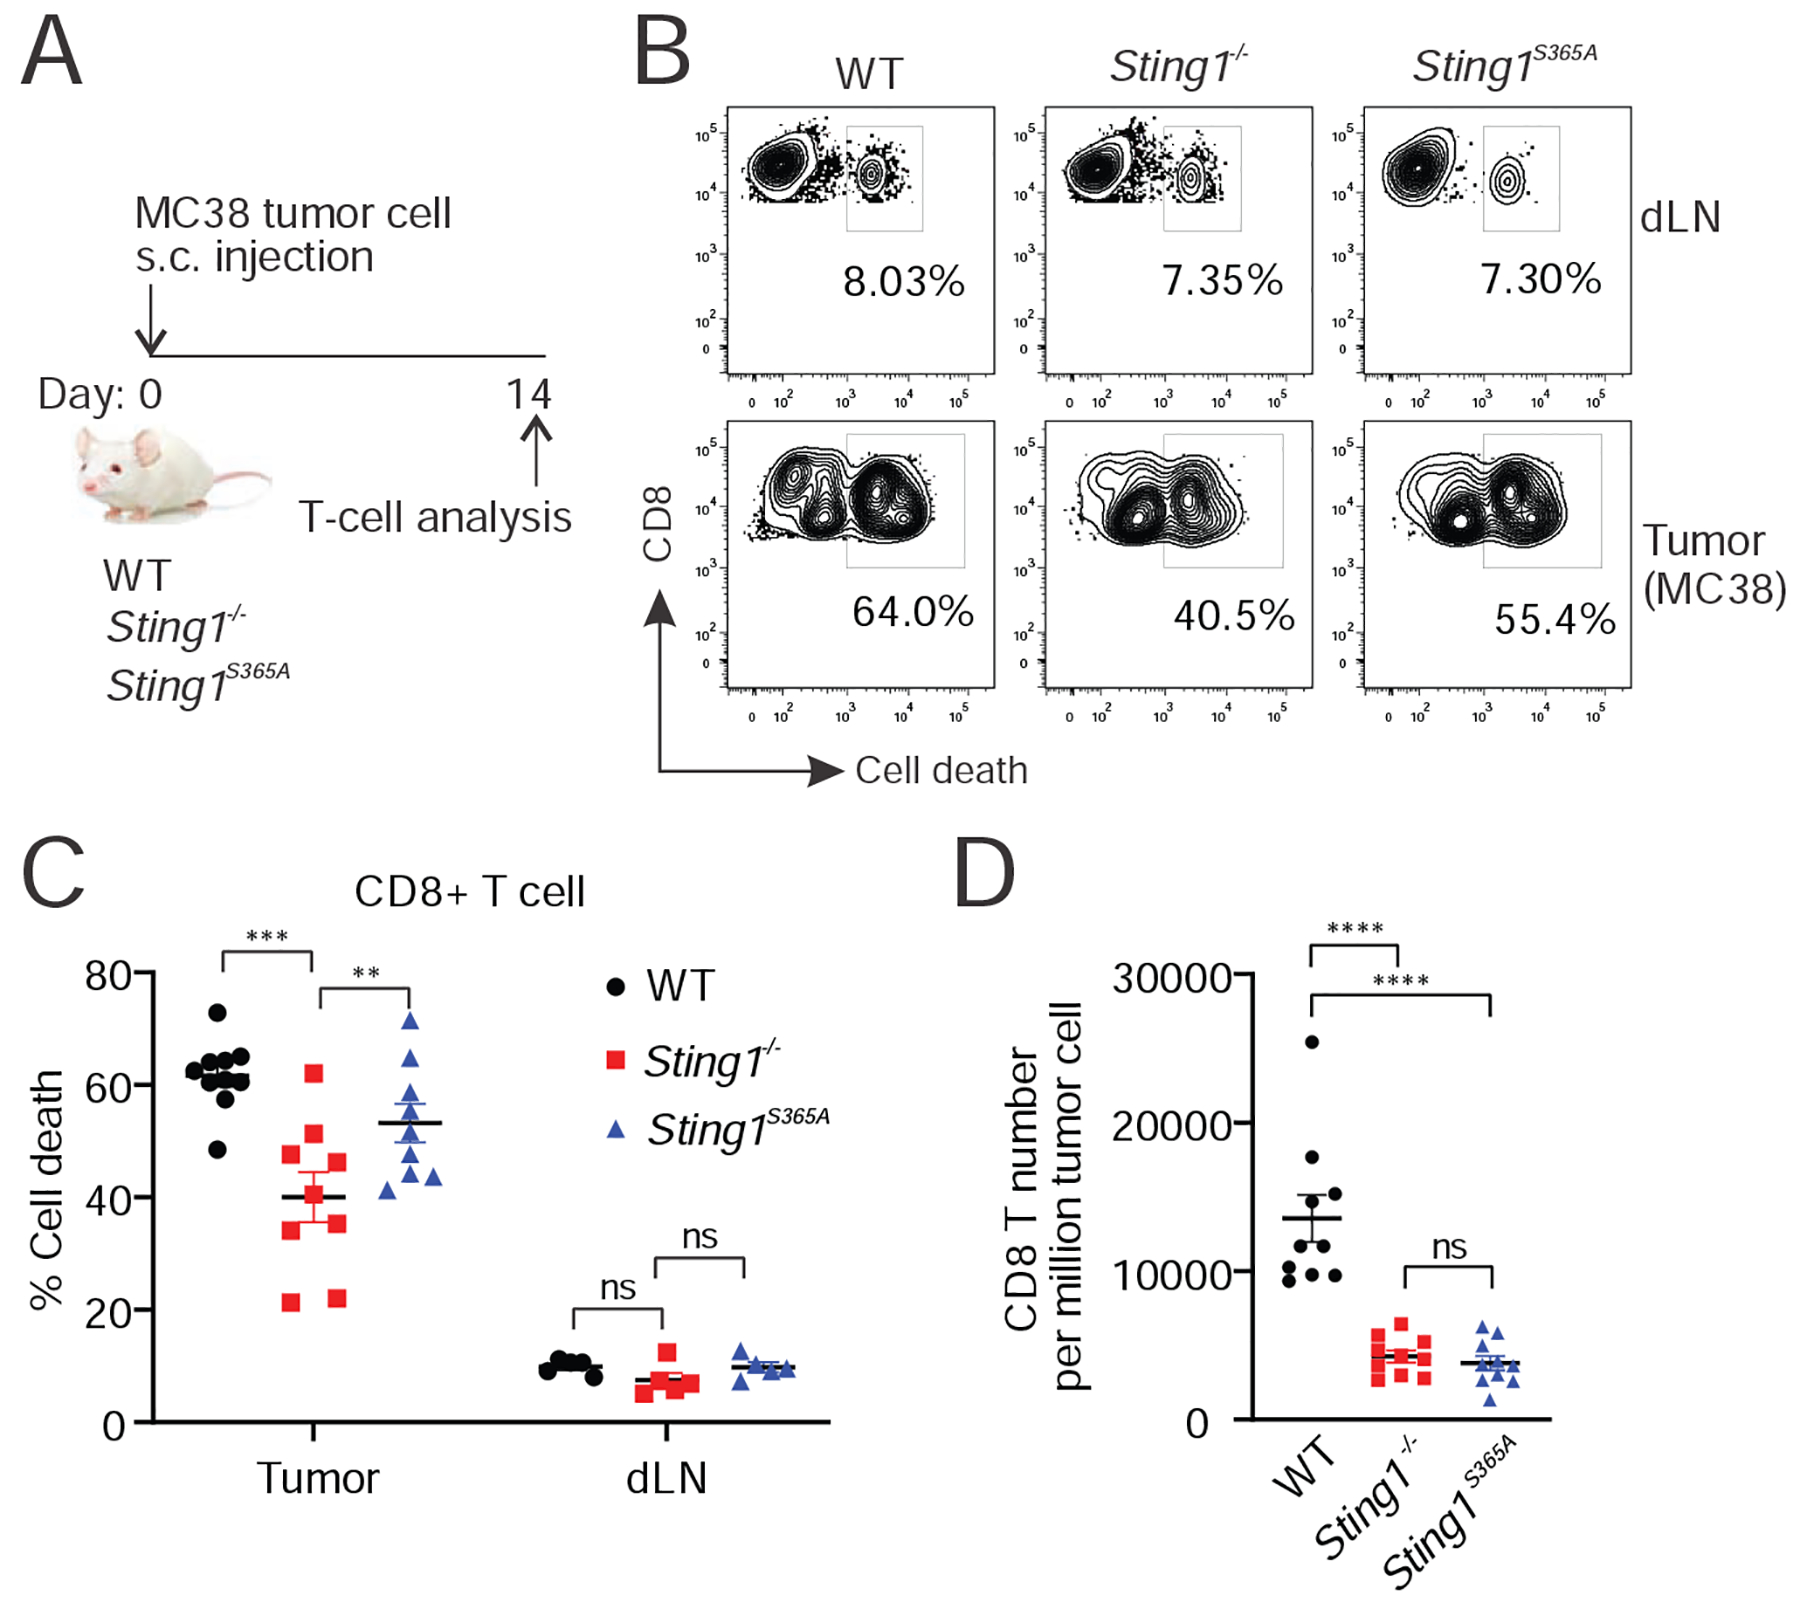
Type I interferon (IFN) response is commonly recognized as the main signaling activity of STING. Here, we generate the Sting1S365A/S365A mutant mouse that precisely ablates IFN-dependent activities while preserving IFN-independent activities of STING. StingS365A/S365A mice protect against HSV-1 infection, despite lacking the STING-mediated IFN response. This challenges the prevailing view and suggests that STING controls HSV-1 infection through IFN-independent activities. Transcriptomic analysis reveals widespread IFN-independent activities of STING in macrophages and T cells, and STING activities in T cells are predominantly IFN independent. In mouse tumor models, T cells in the tumor experience substantial cell death that is in part mediated by IFN-independent activities of STING. We found that the tumor induces STING-mediated cell death in T cells to evade immune control. Our data demonstrate that mammalian STING possesses widespread IFN-independent activities that are important for restricting HSV-1 infection, tumor immune evasion and likely also adaptive immunity.

Keywords: HSV-1; IFN; STING; T cells; antiviral response; cancer immunology.


Conflict of interest statement

Declaration of Interests The authors declare no competing interests.

Figures

Figure 1:
Figure 1:. Sting-S365A mutation specifically abrogates IFN signaling.
(A) Quantitative RT-PCR analysis of IFN- and NFκB-stimulated genes in BMDMs from WT, Sting1−/− or Sting1S365A/S365A mice (Sting1S365A, same throughout). Cells were stimulated with DMXAA (10 μg/ml) for 5 h in vitro followed by qRT-PCR analysis of indicated mRNA (on top). **, p < 0.01; ***, p < 0.001; and ****, p < 0.0001. Error bars, SEM. Two-way ANOVA test. (B) ELISA analysis of IFNβ production in BMDMs stimulated with DNA or 2’3’-cGAMP (cGAMP below) for 24 h. (C, D) Cytokine array analysis of BMDMs stimulated with cGAMP for 24 h. A heatmap summarizing all the data is showing in C. Representative cytokines are showing in D. (E) Quantitative RT-PCR analysis of IFN or NFκB-stimulated gene expression in T cell. Cells were stimulated with DMXAA (2 μg/ml) for 5 h followed by qRT-PCR analysis of indicated mRNAs (on top). **, p < 0.01; ***, p < 0.001; and ****, p < 0.0001. Error bars, SEM. Two-way ANOVA test. (F) Immunoblot analysis of signaling pathways activated by STING. Splenic T cells were stimulated with DMXAA (10 μg/ml) for 6 h in vitro. Cell lysates were analyzed for proteins indicated on the left. Known signaling pathways are indicated on the right. (G) Cytokine protein levels in T cells of indicated genotype after cGAMP stimulation. Data are representative of at least three independent experiments.independent experiments. See also Figure S1.
Figure 2.
Figure 2.. Transcriptomic discovery of IFN-dependent and IFN-independent activities of STING.
(A, B) Pie charts showing percentages of differentially expressed genes (DEGs) that are either IFN-dependent or IFN-independent in BMDMs (A) or T cells (B). Total numbers of DEGs are defined in Figure S2B. Also see STAR Methods for more details. (C, D) Heatmaps showing gene expression patterns of up-regulated (left) or down-regulated (right) DEGs in BMDMs (C) and T cells (D). (E, F) Scatter plots of enriched pathways in BMDMs (E) and T cells (F). Pathways enriched only in wild type DMXAA vs. Mock are considered IFN-dependent. Pathways enriched in S365A DMXAA vs. Mock or in both are considered IFN-independent (see STAR Methods). Pathways are categorized into 3 group based on enrichment p values (WT, −log10(PWT-PS365A)≥2; S365A, −log10(PWT-PS365A)≤−2; both, −2< −log10(PWT-PS365A)<2). (G, H) Top enriched pathways in BMDMs (G) and T cells (H). See also Figure S2 and Figure S3.
Figure 3.
Figure 3.. STING protects mice from HSV-1 infection independently of IFN signaling
(A) Survival study of HSV-1 infection in WT, Sting1−/− or Sting1S365A/S365A mice (Sting1S365A, same throughout). Mice were infected with HSV-1 by i.v. injection, then monitored for survival. n=11–18. **, p < 0.01; ***, p < 0.001. Log-rank test. (B) HSV-1 titer in the brain 6 d post infection. HSV-1 DNA was quantified by qPCR. (C) Quantitative RT-PCR analysis of IFN response in WT, Sting1−/− or Sting1S365A BMDMs infected with HSV-1 or VSV. BMDMs were mock infected or infected with HSV-1 or VSV (m.o.i.=10) for 5 h followed by qRT-PCR analysis. (D) HSV-1 replication in WT, Sting1−/− or Sting1S365A BMDMs. BMDMs were infected with HSV-1 at indicated m.o.i. for 16 h, Viral DNA copy was determined by qPCR. (E) HSV-1 replication in HEK293T cells expressing empty Vector, cGAS and wild type human STING or cGAS and human STING-S366A mutant. Cells were transiently transfected with indicated plasmids for 12 h, then infected with HSV-1 at m.o.i.=10 for 12 h. HSV-1 DNA was quantified by qPCR. For panels B-E, ***, p < 0.001; ****, p < 0.0005. Error bars, SEM. Two-way ANOVA test. Data are representative of at least two independent experiments. See also Figure S4.
Figure 4.
Figure 4.. STING agonists show differential dependency on S365/IFN in inducing T cell death.
(A) Cell death analysis of BMDMs. BMDMs were treated with indicated dose of DMXAA for 16 h followed by Annexin V staining and FACS analysis of cell death. (B-F) Cell death analysis of splenic T cells isolated from WT, Sting1−/− or Sting1S365A/S365A mice. T cells were treated with increasing dose of indicated STING agonists (bottom) for 16 h. Cell death was quantified by Annexin V staining and FACS analysis. (G) Cell death analysis of splenic T cells from mice of different genotypes. Splenic T cell isolated from WT, Sting1−/−, Sting1S365A, Irf3−/−, Ifnar1−/− were treated with DMXAA or cGAMP followed by Annexin V staining and FACS analysis. (H) STING palmytoilation inhibitor C-176 blocks T cell death. Splenic T cells were stimulated with DMXAA (2 μM) in the presence or absence of increasing dose of STING inhibitor C-176 (20 nm, 100 nM and 500 nM) followed by cell death analysis. Data are representative of at least two independent experiments. See also Figure S5.
Figure 5.
Figure 5.. Tumor induces STING-mediated T cell death to evade immune control in the adoptive transfer T-cell model.
(A) A diagram of the B16 tumor experiment in C-H (also see STAR Methods). n=8–10. B and C, B16 tumor growth curves in Rag1−/− mice adoptively transferred with CD8+ T cell of indicated genotype. Average growth curve (B) and individual tumor growth curves (C) are shown. D-G, FACS analysis of T cells in the tumor and draining lymph node (dLN). Single cell suspension from B16 tumor or dLN were stained with cell death marker and T cell surface antibody followed by FACS analysis (see STAR Method). Gating strategy are shown in Figure S6A. Representative FACS plots are shown in D. Dot plots are shown for percentage of CD8+ T cell death (E), percentage of CD8+ T cells in CD45+ population (F) and number of CD8+ T cells in tumor (G). H, immunohistochemistry analysis of T cells (CD3 staining) in tumor. Scale bar, 100 μm. (I) A diagram of the MC38 tumor experiment in J-O. n=8. J and K, MC38 tumor growth curves in Rag1−/− mice adoptively transferred with CD8+ T cell of indicated genotype. Average growth curve (J) and individual tumor growth curves (K) are shown. L-O, FACS analysis of T cells in the tumor. Single cell suspension from MC38 tumor were stained with cell death marker and T cell surface antibody followed by FACS analysis. Representative FACS plots are shown in L. Dot plots are shown for percentage of CD8+ T cell death in tumor (M), percentage of CD8+ T cells in CD45+ population (N) and number of CD8+ T cells in tumor (O). *, p < 0.05; **, p < 0.01; ***, p < 0.001, ****, p < 0.0001. ns, not significant. Error bars, SEM. Two-way ANOVA test. Data are reprehensive of at least three independent experiments. See also Figure S6.
Figure 6.
Figure 6.. Tumor induces STING-mediated T cell death in the endogenous T-cell model.
(A) A diagram of the experiment. n=8–10. (B-D) FACS analysis of T cells in the tumor and dLN. MC38 cells were implanted subcutaneously in WT, Sting1−/− or Sting1S365A/S365A mice for 14 d. T cells in tumor and dLN were analyzed by FACS for cell death. Representative FACS plot are shown in B. Dot plots are shown for percentage of CD8+ T cell death (C) and number of CD8+ T cells in tumor (D). *, p < 0.05; **, p < 0.01; ***, p < 0.001, ****, p < 0.0001. ns, not significant. Error bars, SEM. Two-way ANOVA test. Data are representative of at least three independent experiments.

Comment in

References

    1. Bouis D, Kirstetter P, Arbogast F, Lamon D, Delgado V, Jung S, Ebel C, Jacobs H, Knapp A-M, Jeremiah N, et al. (2018). Severe combined immunodeficiency in Sting V154M/WT mice. The Journal of allergy and clinical immunology. - PubMed
    1. Cerboni S, Jeremiah N, Gentili M, Gehrmann U, Conrad C, Stolzenberg M-C, Picard C, Neven B, Fischer A, Amigorena S, et al. (2017). Intrinsic antiproliferative activity of the innate sensor STING in T lymphocytesSTING inhibits T cell proliferation. The Journal of Experimental Medicine 214, jem.20161674. - PMC - PubMed
    1. Dis EV, Sogi KM, Rae CS, Sivick KE, Surh NH, Leong ML, Kanne DB, Metchette K, Leong JJ, Bruml JR, et al. (2018). STING-Activating Adjuvants Elicit a Th17 Immune Response and Protect against Mycobacterium tuberculosis Infection. Cell reports 23, 1435 1447. - PMC - PubMed
    1. Dobbs N, Burnaevskiy N, Chen D, Gonugunta VK, Alto NM, and Yan N (2015). STING Activation by Translocation from the ER Is Associated with Infection and Autoinflammatory Disease. Cell Host Microbe 18, 157–168. - PMC - PubMed
    1. Franz KM, Neidermyer WJ, Tan Y-J, Whelan SPJ, and Kagan JC (2018). STING-dependent translation inhibition restricts RNA virus replication. Proceedings of the National Academy of Sciences of the United States of America 12, 201716937. - PMC - PubMed

Publication types

MeSH terms