. 2020 Oct 15:220:117129.
doi: 10.1016/j.neuroimage.2020.117129. Epub 2020 Jul 5.

Longitudinal ComBat: A method for harmonizing longitudinal multi-scanner imaging data

Affiliations

Longitudinal ComBat: A method for harmonizing longitudinal multi-scanner imaging data

Joanne C Beer et al. Neuroimage. .

Abstract

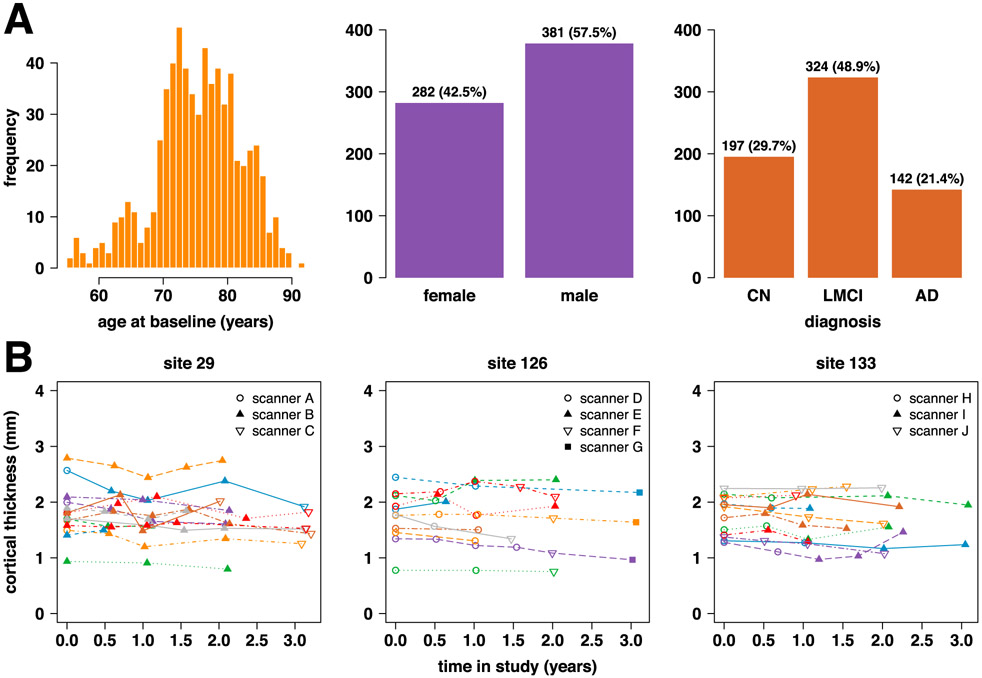
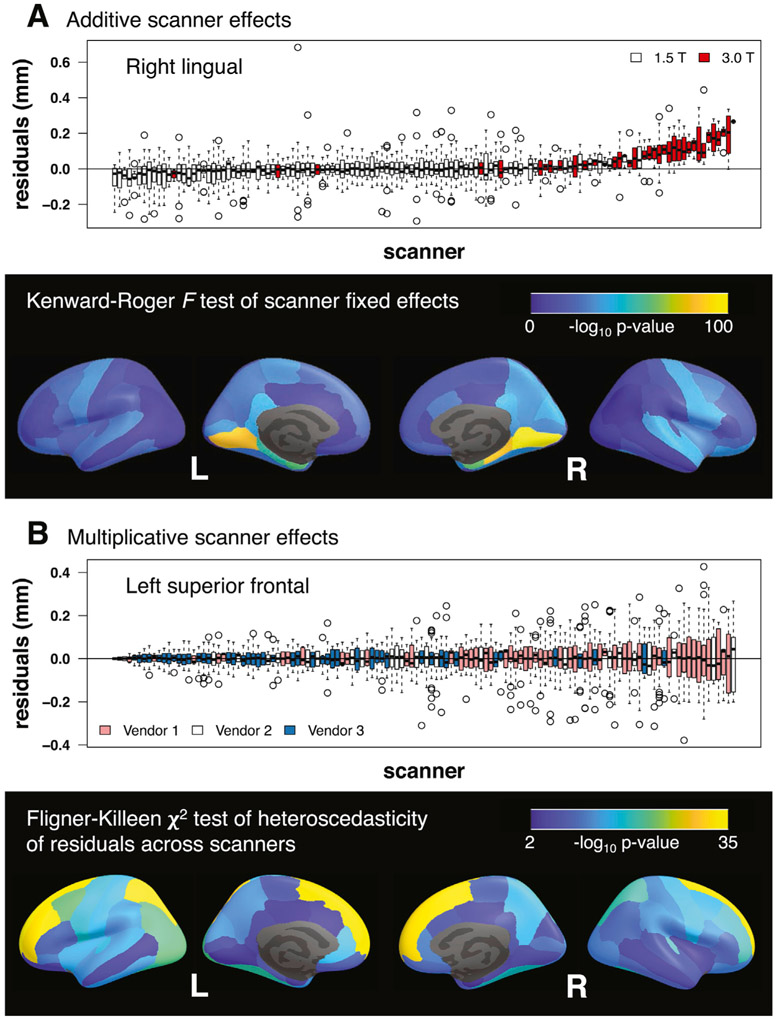
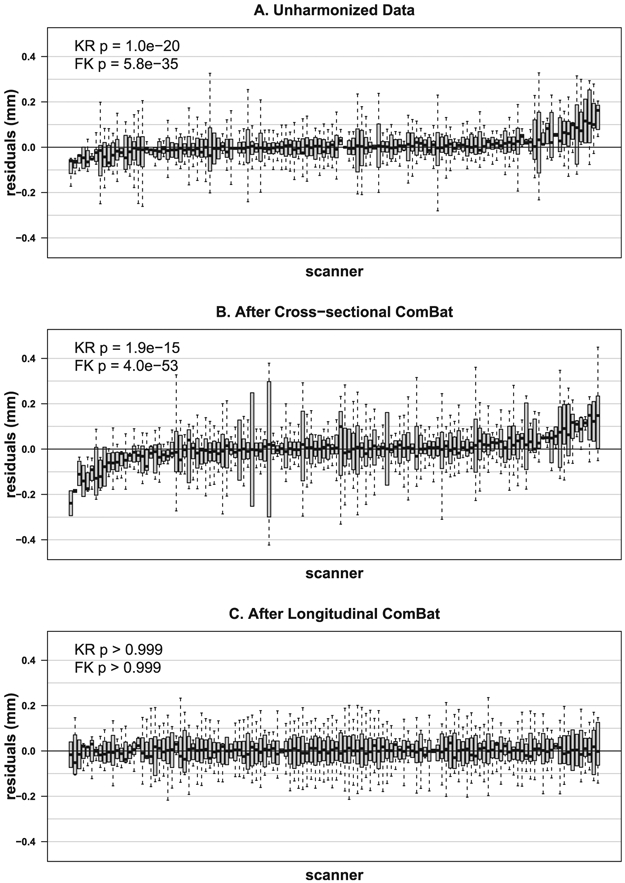
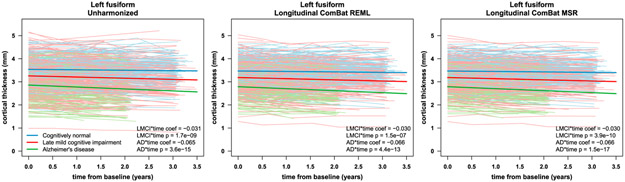
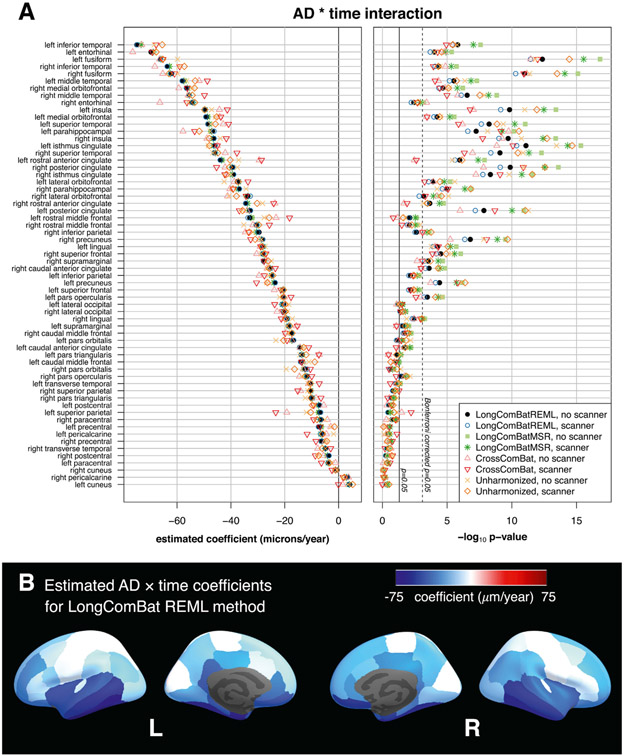
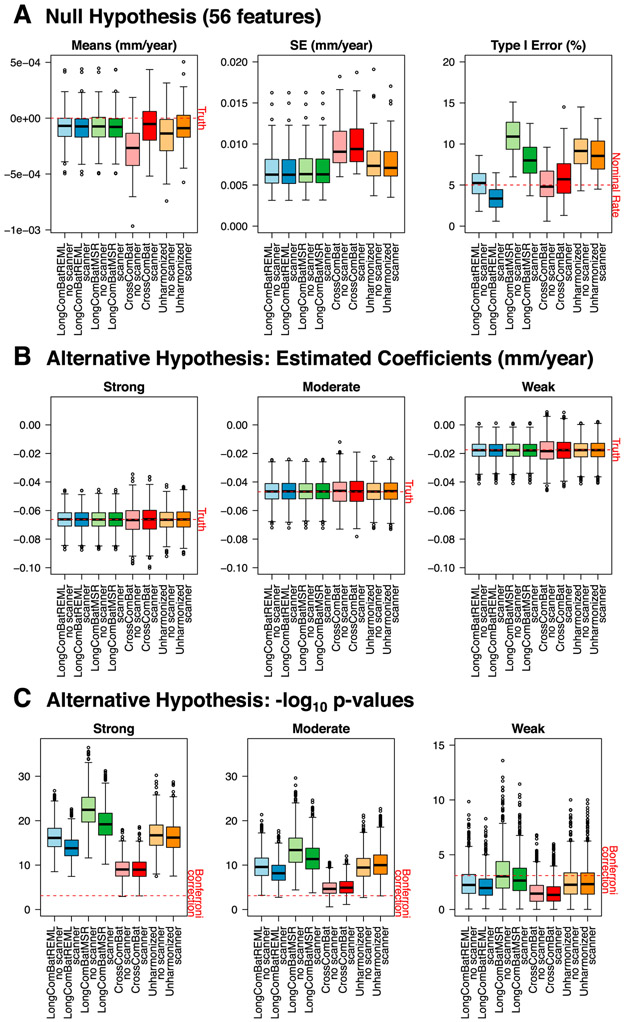
While aggregation of neuroimaging datasets from multiple sites and scanners can yield increased statistical power, it also presents challenges due to systematic scanner effects. This unwanted technical variability can introduce noise and bias into estimation of biological variability of interest. We propose a method for harmonizing longitudinal multi-scanner imaging data based on ComBat, a method originally developed for genomics and later adapted to cross-sectional neuroimaging data. Using longitudinal cortical thickness measurements from 663 participants in the Alzheimer's Disease Neuroimaging Initiative (ADNI) study, we demonstrate the presence of additive and multiplicative scanner effects in various brain regions. We compare estimates of the association between diagnosis and change in cortical thickness over time using three versions of the ADNI data: unharmonized data, data harmonized using cross-sectional ComBat, and data harmonized using longitudinal ComBat. In simulation studies, we show that longitudinal ComBat is more powerful for detecting longitudinal change than cross-sectional ComBat and controls the type I error rate better than unharmonized data with scanner included as a covariate. The proposed method would be useful for other types of longitudinal data requiring harmonization, such as genomic data, or neuroimaging studies of neurodevelopment, psychiatric disorders, or other neurological diseases.

Keywords: ADNI; Alzheimer’s; ComBat; Cortical thickness; Harmonization; MRI.


Figures

Fig. 1.
Fig. 1.
(A) Characteristics of n = 663 ADNI-1 participants. (B) Example trajectories for left superior frontal cortical thickness at 3 ADNI sites. Each line represents the trajectory for one participant at the given site, and each data point represents the cortical thickness in mm derived from the given scan using the ANTs Longitudinal-SST pipeline.
Fig. 2.
Fig. 2.
(A) Additive scanner effects. Boxplots show distributions of residuals across scanners after fitting a model with baseline age, sex, diagnosis, time, and diagnosis × time fixed effects and a subject-specific random intercept. Right lingual cortex was the region with the largest additive scanner effects according to the Kenward-Roger F-test; parahippocampal and entorhinal cortical regions also showed large effects. 3.0 T scanners tended to produce larger estimates of cortical thickness than 1.5 T scanners. (B) Multiplicative scanner effects. Boxplots show distributions of residuals across scanners after fitting a model with baseline age, sex, diagnosis, time, scanner, and diagnosis × time fixed effects and a subject-specific random intercept. Left superior frontal cortex was the region with the largest multiplicative scanner effects according to the Fligner-Killeen χ2-test. Vendor 1 scanners tended to have larger, while vendor 3 scanners had smaller, residual variability.
Fig. 3.
Fig. 3.
Distributions of left superior frontal cortical thickness residuals across scanners before harmonization (A), after cross-sectional ComBat (B), and after longitudinal ComBat (REML method) (C). Residuals are derived from linear mixed effects models including explanatory variables baseline age, sex, diagnosis, time, diagnosis × time interaction, and a subject-level random intercept. Scanners are ordered left to right by increasing residual means (red dots). Kenward-Roger (KR) test for additive scanner effects and Fligner-Killeen (FK) test for multiplicative scanner effects were significant for unharmonized and cross-sectional ComBat-harmonized data, but not for longitudinal ComBat harmonized data, confirming that longitudinal ComBat successfully removed scanner effects.
Fig. 4.
Fig. 4.
Left fusiform cortical thickness trajectories before harmonization (left), after longitudinal ComBat REML (center), and after longitudinal ComBat MSR (right). Individual subject trajectories and linear mixed effects model fit for the fixed effects are shown for the different diagnostic groups. Scanner was included as a fixed effect covariate for unharmonized data. Fitted lines are for females at the mean baseline age of 75.3 years. Estimated coefficients (coef) for late mild cognitive impairment (LMCI) by time interaction and Alzheimer’s disease (AD) by time interaction, and Kenward-Roger (KR) test p-values, are displayed in lower right corners.
Fig. 5.
Fig. 5.
Comparison of data harmonization methods for the ADNI cortical thickness dataset. (A) Estimated coefficients and – log10p-values for the AD × time coefficients. Plots show results for each harmonization method, with and without scanner included as a fixed effect covariate in the final models. Features are sorted by coefficient magnitude for longitudinal ComBat (REML method) with no scanner covariate in the final model. (B) Estimates obtained from data harmonized using longitudinal ComBat (REML method, no scanner in final model) are displayed on the inflated cortical surface. AD: Alzheimer’s disease.
Fig. 6.
Fig. 6.
Simulation study results for 8 harmonization methods, each without or with scanner fixed effect covariates in the model. (A) Boxplots show distributions of the mean AD × time coefficient estimates over 1000 simulations for the 56 null features (left), the standard errors of the estimates (center), and the percentage of p-values < 0.05 from the Kenward-Roger test (right). (B) Distributions of the AD × time coefficient estimates over 1000 simulations for one strong, one moderate, and one weak effect size. (C) Distributions of the corresponding −log10 Kenward-Roger p-values. AD: Alzheimer’s disease; LongComBatREML: longitudinal ComBat, restricted maximum likelihood method; LongComBatMSR: longitudinal ComBat, mean squared residuals method; CrossComBat: Cross-sectional ComBat.

References

    1. Bakkour A, Morris JC, Dickerson BC, 2009. The cortical signature of prodromal AD: regional thinning predicts mild AD dementia. Neurology 72 (12), 1048–1055. - PMC - PubMed
    1. Bates D, Mächler M, Bolker B, Walker S, 2015. Fitting linear mixed-effects models using lme4. J. Stat. Software 67 (1), 1–48.
    1. Conover WJ, Johnson ME, Johnson MM, 1981. A comparative study of tests for homogeneity of variances, with applications to the outer continental shelf bidding data. Technometrics 23 (4), 351–361.
    1. Dewey BE, Zhao C, Reinhold JC, Carass A, Fitzgerald KC, Sotirchos ES, Saidha S, Oh J, Pham DL, Calabresi PA, et al., 2019. DeepHarmony: a deep learning approach to contrast harmonization across scanner changes. Magn. Reson. Imag 64, 160–170. - PMC - PubMed
    1. Dickerson BC, Bakkour A, Salat DH, Feczko E, Pacheco J, Greve DN, Grodstein F, Wright CI, Blacker D, Rosas HD, et al., 2008. The cortical signature of Alzheimer’s disease: regionally specific cortical thinning relates to symptom severity in very mild to mild AD dementia and is detectable in asymptomatic amyloid-positive individuals. Cerebr. Cortex 19 (3), 497–510. - PMC - PubMed

Publication types

MeSH terms