

Investigating REPAIRv2 as a Tool to Edit CFTR mRNA with Premature Stop Codons
- PMID: 32640650
- PMCID: PMC7369808
- DOI: 10.3390/ijms21134781
Investigating REPAIRv2 as a Tool to Edit CFTR mRNA with Premature Stop Codons
Abstract
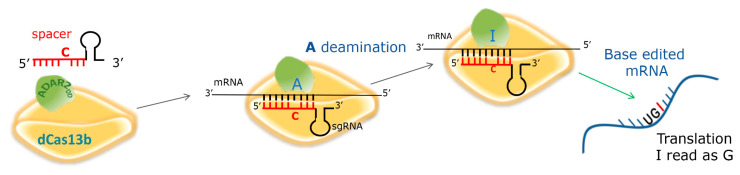
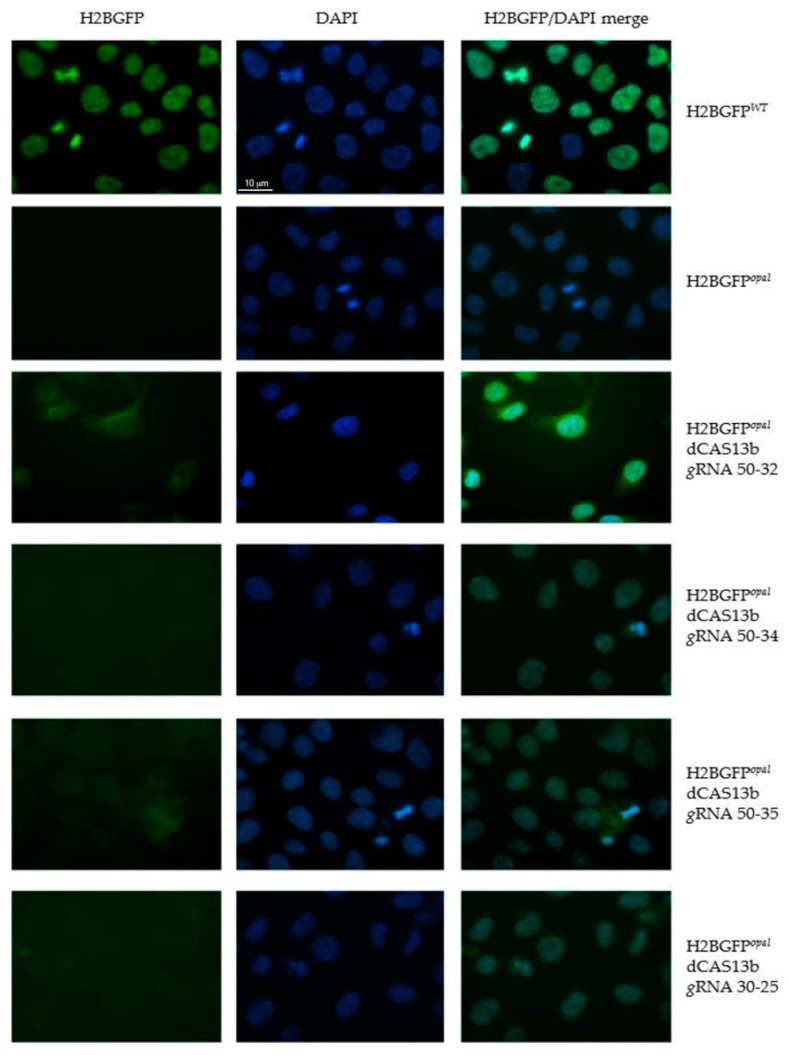
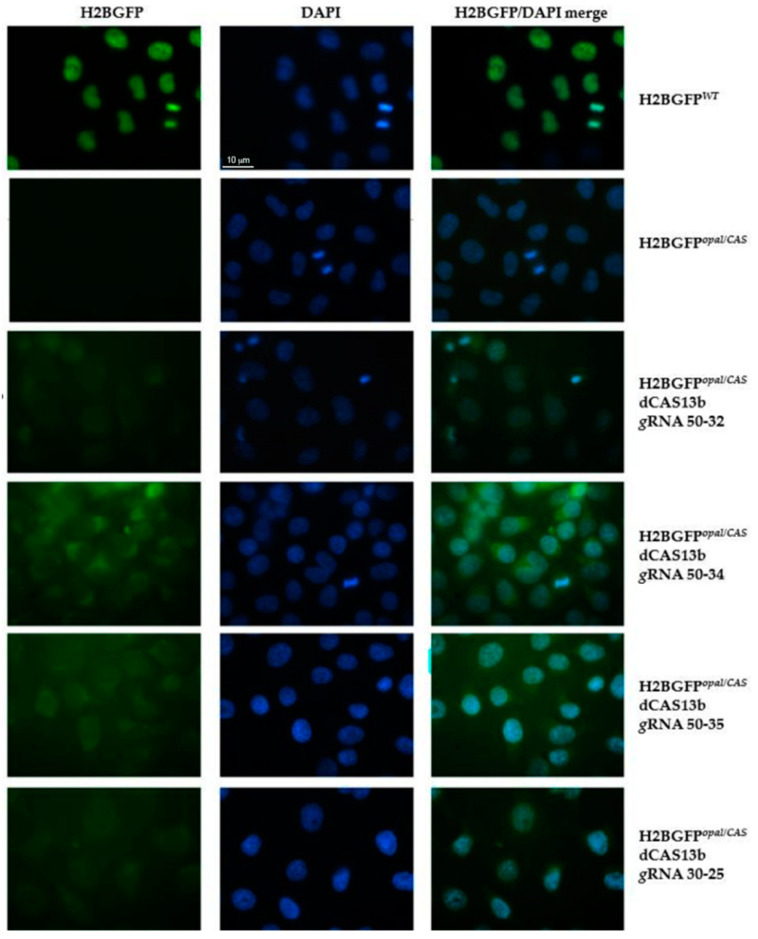
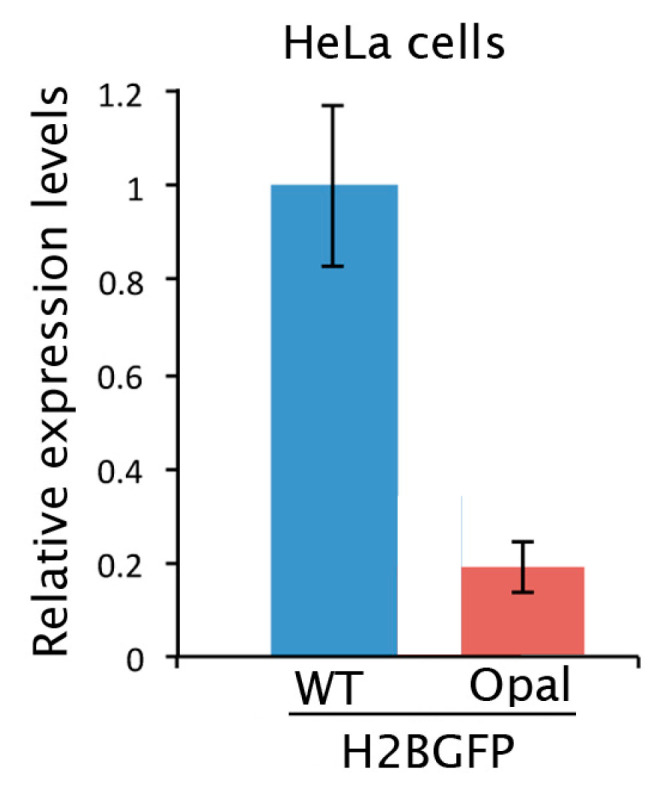
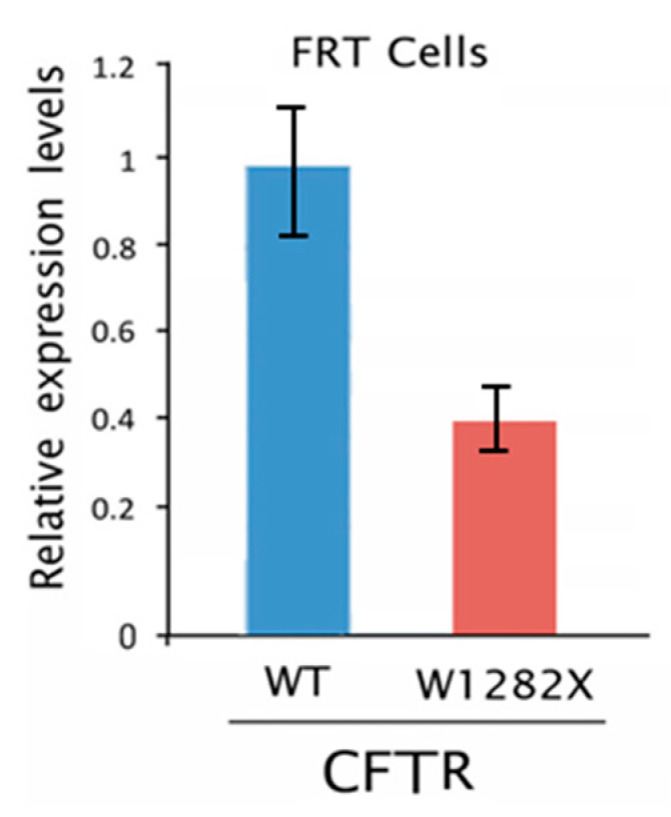
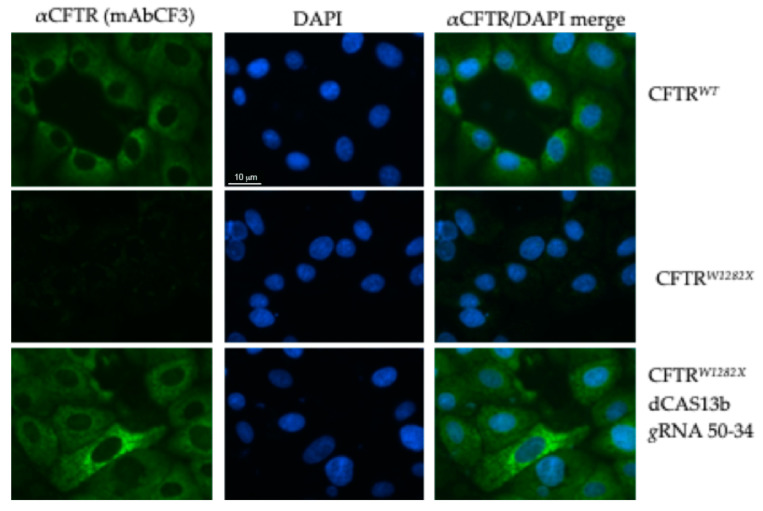
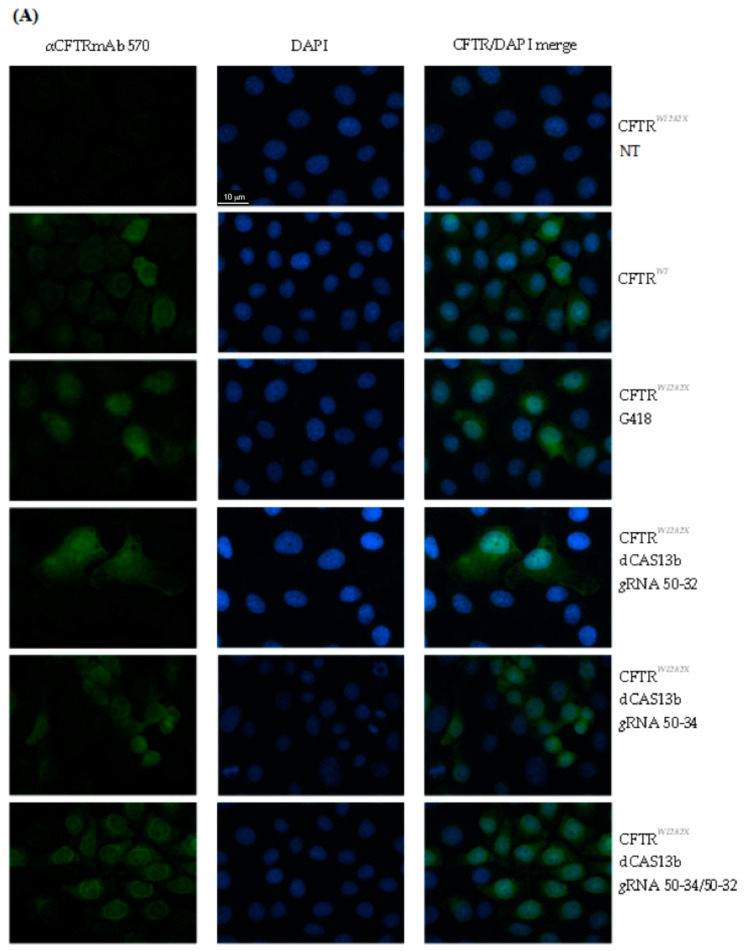
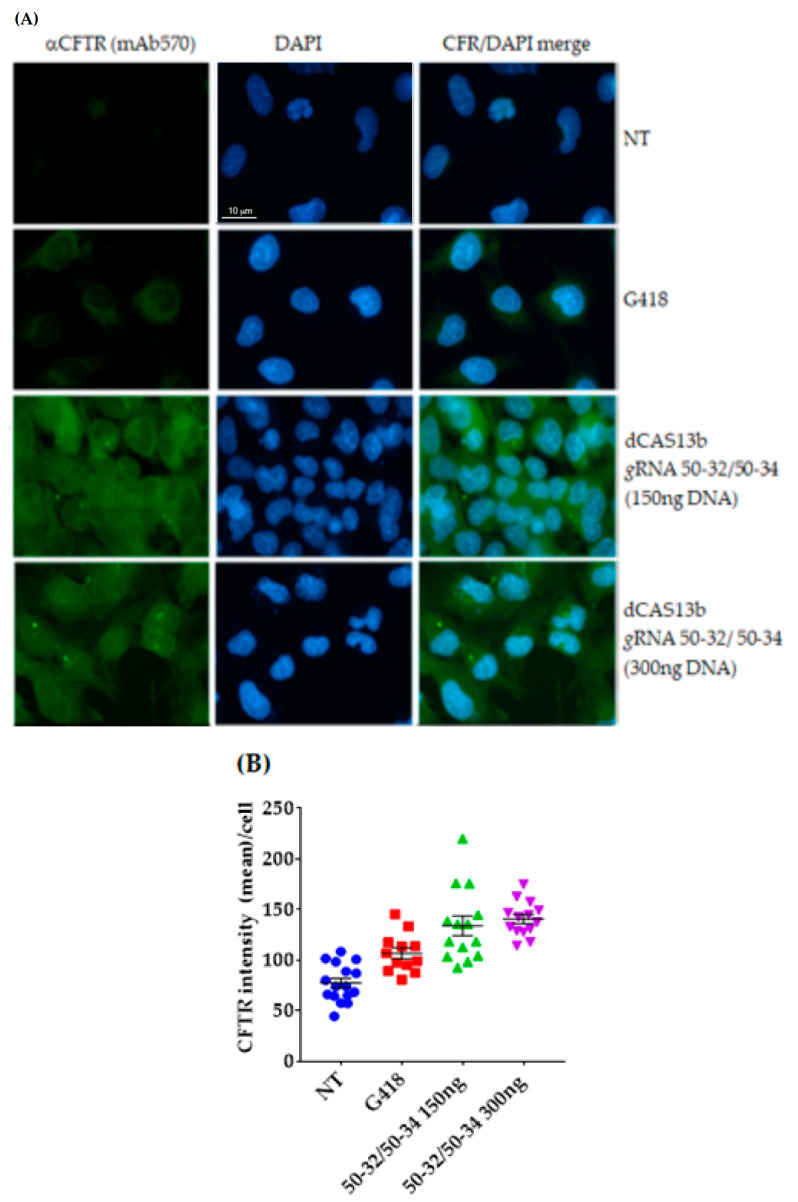
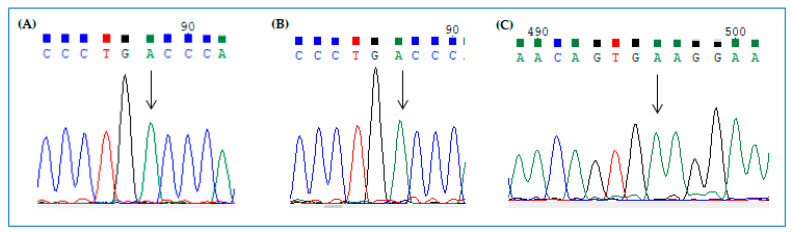
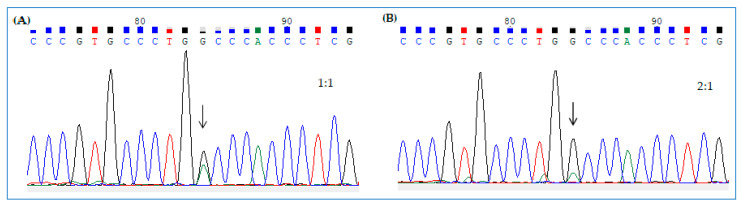
Cystic fibrosis (CF) is caused by mutations in the gene encoding the transmembrane conductance regulator (CFTR) protein. Some CF patients are compound heterozygous or homozygous for nonsense mutations in the CFTR gene. This implies the presence in the transcript of premature termination codons (PTCs) responsible for a truncated CFTR protein and a more severe form of the disease. Aminoglycoside and PTC124 derivatives have been used for the read-through of PTCs to restore the full-length CFTR protein. However, in a precision medicine framework, the CRISPR/dCas13b-based molecular tool "REPAIRv2" (RNA Editing for Programmable A to I Replacement, version 2) could be a good alternative to restore the full-length CFTR protein. This RNA editing approach is based on the targeting of the deaminase domain of the hADAR2 enzyme fused to the dCas13b protein to a specific adenosine to be edited to inosine in the mutant mRNA. Targeting specificity is allowed by a guide RNA (gRNA) complementarily to the target region and recognized by the dCas13b protein. Here, we used the REPAIRv2 platform to edit the UGA PTC to UGG in different cell types, namely IB3-1 cells, HeLa, and FRT cells engineered to express H2BGFPopal and CFTRW1282X, respectively.
Keywords: CRISPR/dCas13b; RNA editing; cystic fibrosis; premature termination codons (PTCs).
Conflict of interest statement
The authors declare no conflict of interest. The funders had no role in the design of the study; in the collection, analyses, or interpretation of data; in the writing of the manuscript; or in the decision to publish the results.
Figures

Similar articles
-
Site-Specific RNA Editing of Stop Mutations in the CFTR mRNA of Human Bronchial Cultured Cells.Int J Mol Sci. 2023 Jun 30;24(13):10940. doi: 10.3390/ijms241310940. Int J Mol Sci. 2023. PMID: 37446121 Free PMC article.
-
Enhancement of premature stop codon readthrough in the CFTR gene by Ataluren (PTC124) derivatives.Eur J Med Chem. 2015 Aug 28;101:236-44. doi: 10.1016/j.ejmech.2015.06.038. Epub 2015 Jun 21. Eur J Med Chem. 2015. PMID: 26142488
-
RNA editing applied to cystic fibrosis: RESTORE can target G542X CFTR mRNA and revert the nonsense mutation.Gene. 2025 Jun 5;951:149384. doi: 10.1016/j.gene.2025.149384. Epub 2025 Mar 5. Gene. 2025. PMID: 40054708
-
Pharmacological induction of CFTR function in patients with cystic fibrosis: mutation-specific therapy.Pediatr Pulmonol. 2005 Sep;40(3):183-96. doi: 10.1002/ppul.20200. Pediatr Pulmonol. 2005. PMID: 15880796 Review.
-
Pharmacologic therapy for stop mutations: how much CFTR activity is enough?Curr Opin Pulm Med. 2004 Nov;10(6):547-52. doi: 10.1097/01.mcp.0000141247.22078.46. Curr Opin Pulm Med. 2004. PMID: 15510065 Review.
Cited by
-
One Size Does Not Fit All: The Past, Present and Future of Cystic Fibrosis Causal Therapies.Cells. 2022 Jun 8;11(12):1868. doi: 10.3390/cells11121868. Cells. 2022. PMID: 35740997 Free PMC article. Review.
-
Molecular Approaches Fighting Nonsense.Int J Mol Sci. 2021 Nov 3;22(21):11933. doi: 10.3390/ijms222111933. Int J Mol Sci. 2021. PMID: 34769359 Free PMC article.
-
Site-Specific RNA Editing of Stop Mutations in the CFTR mRNA of Human Bronchial Cultured Cells.Int J Mol Sci. 2023 Jun 30;24(13):10940. doi: 10.3390/ijms241310940. Int J Mol Sci. 2023. PMID: 37446121 Free PMC article.
-
Proteasome-independent K63 polyubiquitination selectively regulates ATP levels and proteasome activity during fear memory formation in the female amygdala.Mol Psychiatry. 2023 Jun;28(6):2594-2605. doi: 10.1038/s41380-023-02112-0. Epub 2023 May 17. Mol Psychiatry. 2023. PMID: 37198264 Free PMC article.
-
Phosphorylation of RPT6 Controls Its Ability to Bind DNA and Regulate Gene Expression in the Hippocampus of Male Rats during Memory Formation.J Neurosci. 2024 Jan 24;44(4):e1453232023. doi: 10.1523/JNEUROSCI.1453-23.2023. J Neurosci. 2024. PMID: 38124005 Free PMC article.
References
-
- Roy B., Friesen W.J., Tomizawa Y., Leszyk J.D., Zhuo J., Johnson B., Dakka J., Trotta C.R., Xue X., Mutyam V., et al. Ataluren stimulates ribosomal selection of near-cognate tRNAs to promote nonsense suppression. Proc. Natl. Acad.Sci. USA. 2016;113:12508–12513. doi: 10.1073/pnas.1605336113. - DOI - PMC - PubMed
MeSH terms
Substances
Grants and funding
LinkOut - more resources
Full Text Sources
Medical
