. 2020 Sep;40(9):2244-2264.
doi: 10.1161/ATVBAHA.120.314875. Epub 2020 Jul 9.

Low-Level Nanog Expression in the Regulation of Quiescent Endothelium

Affiliations

Low-Level Nanog Expression in the Regulation of Quiescent Endothelium

Jugajyoti Baruah et al. Arterioscler Thromb Vasc Biol. 2020 Sep.

Abstract

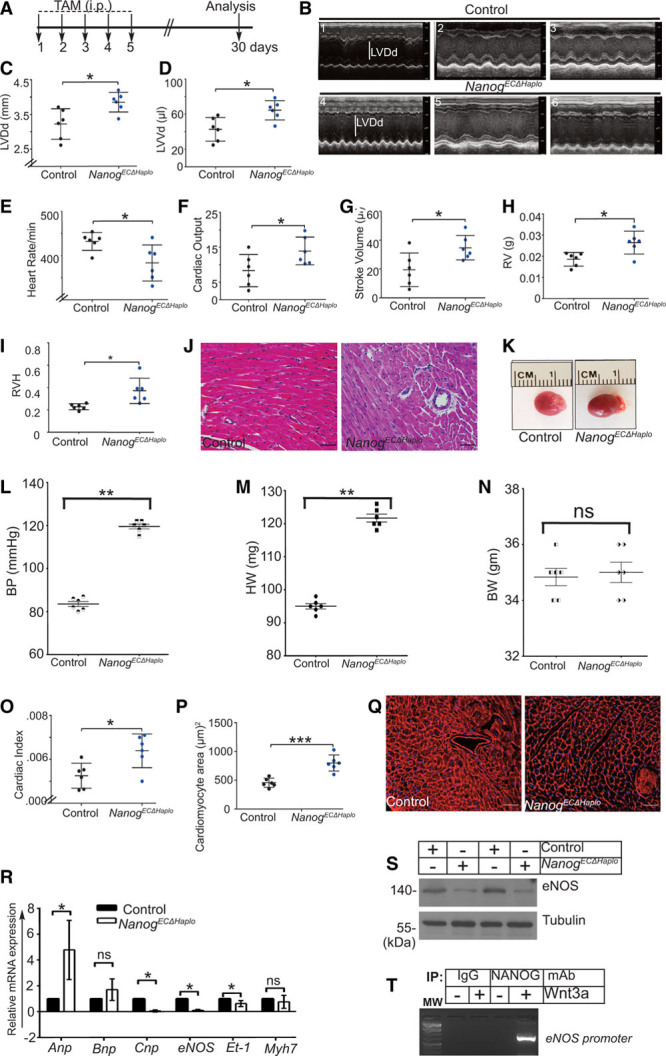
Objective: Nanog is expressed in adult endothelial cells (ECs) at a low-level, however, its functional significance is not known. The goal of our study was to elucidate the role of Nanog in adult ECs using a genetically engineered mouse model system. Approach and Results: Biochemical analyses showed that Nanog is expressed in both adult human and mouse tissues. Primary ECs isolated from adult mice showed detectable levels of Nanog, Tert (telomerase reverse transcriptase), and eNos (endothelial nitric oxide synthase). Wnt3a (Wnt family member 3A) increased the expression of Nanog and hTERT (human telomerase reverse transcriptase) in ECs and increased telomerase activity in these cells. In a chromatin immunoprecipitation experiment, Nanog directly bound to the hTERT and eNOS promoter/enhancer DNA elements, thereby regulating their transcription. Administration of low-dose tamoxifen to ROSAmT/mG::Nanogfl/+::Cdh5CreERT2 mice induced deletion of a single Nanog allele, simultaneously labeling ECs with green fluorescent protein and resulting in decreased Tert and eNos levels. Histological and morphometric analyses of heart tissue sections prepared from these mice revealed cell death, microvascular rarefaction, and increased fibrosis in cardiac vessels. Accordingly, EC-specific Nanog-haploinsufficiency resulted in impaired EC homeostasis and angiogenesis. Conversely, re-expression of cDNA encoding the hTERT in Nanog-depleted ECs, in part, restored the effect of loss of Nanog.

Conclusions: We showed that low-level Nanog expression is required for normal EC homeostasis and angiogenesis in adulthood.

Keywords: cardiac hypertrophy; coronary vessels; endothelial cells; haploinsufficiency; quiescence; tamoxifen; telomerase.


Conflict of interest statement

None.

Figures

Figure 1.
Figure 1.
Expression analyses of Nanog. A, Commercially available, premade Western blot (WB) prepared from indicated multiple tissues (50+ years old male) were analyzed with an anti-Nanog antibody. The numbers below the top indicate signal intensities. B, Relative protein sample loading was verified by the expression of the Grb2 protein. The data are representative of 3 independent experiments. C, Total protein extracts prepared from adult mice (3 mo old, male and female pooled) tissues were analyzed with an anti-Nanog antibody. The numbers below represent signal intensities. D, Protein loading was verified by the expression of β-Tubulin protein. The data are representative of 3 independent experiments. E, Protein extracts prepared from CD31+/CD45 endothelial cells (ECs) at passage 3 from indicated tissues (H, heart, L, lung, and B, brain) obtained from 2, 6, 10, and 14 wk old mice were analyzed by WB with indicated antibodies. Nanog is expressed in all 3 tissues examined and the EC-specific Nanog can be detected until 14 wk. Tert (telomerase reverse transcriptase) in ECs declined beginning week 10, while the expression of eNos declined very moderately after week 14. There was no change in VE-cadherin and Gapdh levels. Experiments were repeated at least 3×. The numbers below the WB panels indicate relative signal intensities. F, Representative images of EC characteristics of mouse ECs obtained from indicated tissues were determined by anti-mouse VE-cadherin (Texas red) staining; nuclear Propidium iodide (green). Magnification, 40×; scale bar, 150 μm.
Figure 2.
Figure 2.
Wnt3a (Wnt family member 3A) induces increased Nanog, hTERT (human telomerase reverse transcriptase), and eNOS (endothelial nitric oxide synthase) expressions, and telomerase activity in human umbilical vein endothelial cells (HUVECs). A, Timeline of HUVECs stimulation and quantitative reverse transcription polymerase chain reaction (qRT-PCR) analysis. Total mRNA prepared from control HUVECs and HUVECs stimulated with Wnt3a (50 ng/mL) for 6 h was subjected to qRT-PCR analyses for Nanog, hTERT, and eNOS expression, which revealed a significant increase in mRNA expression after Wnt3a stimulation relative to control. *P<0.05 and ***P<0.001. P values are from Student t-tests. Data are shown as mean±SD obtained from n=3 independent experiments. B, Total cell lysates prepared from control and Wnt3a-stimulated endothelial cells (Ecs) were analyzed by Western blot (WB) with the indicated antibodies. Wnt3a stimulation increased the expression of Nanog, hTERT and eNOS by 6 h, together with that of β-cadherin, used as a positive control. GAPDH was used as the loading control. The numbers below the top 4 represent WB signal intensities in arbitrary units, obtained following NIH-ImageJ analyses. C, Control (top) and Wnt3a-stimulated (bottom) HUVECs were subjected to anti-hTERT (red) and anti-VE-cadherin (green) staining; the images (40× magnification) show increased nuclear accumulation of hTERT. D, HUVECs receiving Wnt3a for 6 h showed increased telomerase activity (arrows); the telomerase activities declined by 12 h, whereas control ECs showed no activity. For optimal resolution and clarity of telomerase-amplified products, we have provided an inverted image (D). E, Unaltered image of the ethidium bromide-stained agarose gel showing PCR products obtained as a result of telomerase activities; experiments were repeated at least 3×. DAPI indicates 4′,6-diamidino-2-phenylindole; and TSR, telomere synthetic repeat.
Figure 3.
Figure 3.
Nanog mediates hTERT (human telomerase reverse transcriptase) expression in human umbilical vein endothelial cells (HUVECs). A, Timeline of HUVECs stimulation with no Wnt3a (Wnt family member 3A; vehicle control) or with Wnt3a (50 ng/mL) and chromatin immunoprecipitation polymerase chain reaction (ChIP-PCR) assay. Β, Quantitative PCR analyses for Nanog occupancy of the hTERT promoter. Nanog DNA complexes obtained from control and HUVECs receiving Wnt3a for 18 h were immunoprecipitated with an anti-Nanog antibody and isotype-control anti-IgG. Promoter-specific binding in the −1.5 kb region of the hTERT promoter DNA was significantly higher in Wnt3a-stimulated ECs relative to control (*P<0.05 vs control). C, The eluted ChIP was PCR-amplified with hTERT promoter-specific primers, and the PCR products were separated on a 2% gel; the results show positive amplification at ≈1500 bp, indicating Nanog binding to the hTERT promoter/enhancer in response to Wnt3a stimulation. D, Timeline of EC transfection and measurement of luciferase activity in response to Wnt3a (50 ng/mL). E, Promoter/enhancer deletion constructs containing 6, 1, and 0 Nanog-binding elements (NBEs) were prepared, in which ▸ indicates the location of putative Nanog-binding sites in the promoter/enhancer DNA strand in the 5′-3′ direction, whereas ◂ indicates the reverse strand (3′-5′). The HUVECs were transfected overnight (18 h) before being stimulated with Wnt3a for 6 h. Luciferase activity was measured in media collected at 6 h and normalized relative to constitutively expressed secreted alkaline phosphatase activity; the results are shown as fold-luciferase activity. E, Wnt3a mediated luciferase activity in HUVECs expressing hTERT-promoter luciferase constructs harboring 6 and 1 NBE sites, compared with control (*P<0.05, **P<0.01, ***P <0.001 vs control). Data are shown as mean±SD collected from 3 independent experiments (n=3). F, The hTERT promoter construct containing 6 NBEs was co-transfected with or without Nanog shRNA, and the cells were stimulated with Wnt3a (50 ng/mL) for 6 h; subsequently, luciferase activity was measured as described above. Depletion of HUVECs Nanog resulted in a significant decline in Wnt3a-induced hTERT promoter activity. These experiments were repeated at least 3×. WB indicates Western blot.
Figure 4.
Figure 4.
Nanog governs hTERT (human telomerase reverse transcriptase) expression. A, Timeline of Nanog knockdown and quantitative reverse transcription polymerase chain reaction (qRT-PCR) analysis of total mRNAs prepared from control and Nanog-depleted endothelial cells (ECs), stimulated without/with Wnt3a (Wnt family member 3A; 50 ng/mL). B, qRT-PCR analyses of total mRNAs prepared from control and Nanog-depleted ECs treated either without or with Wnt3a revealed a significant (***P<0.001 vs control 18S rRNA from the same group) decline in the expression of hTERT and in that of the Nanog target genes Cyclin-D1 and Vegfr2 (positive controls). C, Representative Western blot (WB) images of total cell lysates prepared from control and Nanog-depleted ECs stimulated without/with Wnt3a (50 ng/mL) and immunoblotted with anti-Nanog and anti-hTERT; hTERT expression was markedly diminished. GAPDH was used as the loading control. D, Quantification of protein expression relative to GAPDH; the results show a significant reduction in hTERT expression (**P<0.01 or ***P<0.001 vs control). E, Total lysates from ECs transfected with HA-tagged Nanog cDNA were prepared after 48 h and used in WB analysis, which showed increased expression of hTERT, VEGFR2 (vascular endothelial growth factor receptor-2), and Cyclin-D1. F, Quantification of protein expression (relative to GAPDH) in control and Nanog-overexpressing cells show a significant increase in VEGFR2, hTERT, and Cyclin-D1 expression (*P<0.05 vs respective control group). Data are shown as mean±S.D. from 3 independent experiments. P values are obtained from Student t tests. eNOS indicates endothelial nitric oxide synthase.
Figure 5.
Figure 5.
Endothelial cell (EC)-specific Nanog haploinsufficiency (NanogECΔHaplo) results in increased EC apoptosis and develop fibrosis. A, Timeline of TAM (tamoxifen) administration in control ROSAmT/mG::Nanogfl/+ and ROSAmT/mG::Nanogfl/+::Cdh5CreERT2 mice. TAM (2 mg/kg body weight) was administered intraperitoneally every 24 h for 5 consecutive days, and this was followed by wait periods of 7 days (d7), 14 days (d14), 21 days (d21), and 30 days (d30). Hearts were cut into 2 equal halves, and 5-μm-thin serial sections were prepared for microscopic analyses from cryopreserved heart tissues or for Masson trichrome staining from formalin-fixed/paraffin-embedded tissue. B, Quantification of fibrotic areas (identified in 40× magnification images) in and around vessels. The data indicate a significant increase in fibrosis at d30 in NanogECΔHaplo compared with control (***P<0.001 or ****P<0.001 vs respective control group). C, Representative Masson trichrome staining (blue) of control and NanogECΔHaplo heart sections show increased fibrosis in vascular and perivascular areas in NanogECΔHaplo heart sections. D, Quantification of TUNEL (terminal deoxynucleotidyl transferase dUTP nick-end labeling) staining in control and NanogECΔHaplo heart sections show a significant time-dependent increase in TUNEL+ cells (****P<0.001 vs control). For details, please see methods. E, Representative high-resolution confocal microscopy images (63×) of heart sections stained with anti-VWF (von Willebrand factor; magenta, EC marker) and TUNEL+ (green) cells; the results indicate widespread apoptosis in both ECs and non-ECs. Statistical significance was determined by a 1-way ANOVA with Tukey post hoc analysis. Data are shown as mean±S.D. (n=6 mice/group). We pooled data from 3 male and 3 female mice, as the cardiac pathology observed in these mice were identical.
Figure 6.
Figure 6.
Mice with NanogECΔHaplo develop cardiac hypertrophy. A, Timeline of TAM (tamoxifen) administration in age-matched control (ROSAmT/mG::Nanogfl/+) and NanogECΔHaplo ROSAmT/mG::Nanogfl/+::Cdh5CreERT2) mice. Each mouse received 2 mg/kg TAM each day, for a total of 10 mg/kg body weight (BW) intraperitoneally (IP) for 5 consecutive days, followed by a wait period of 30 days (d30). At that point, mouse hearts were evaluated with echocardiography. B, 1–3, Three representative M-mode tracings of the cardiac chambers of control mice. Β, 4–6, Three representative M-mode tracings of the cardiac chambers of NanogECΔHaplo mice. Quantification of left ventricular (LV) parameters at diastole in control vs NanogECΔHaplo mice. C, Left ventricular diameter at diastole (LVDd) in millimeter. D, Left ventricular volume at diastole (LVVd) in microliter. E, NanogECΔHaplo mice showed a significant reduction in heart rate compared with controls. NanogECΔHaplo mice showed a significant increase in the following: (F) cardiac output, (G) stroke volume in microliter, (H) right ventricular (RV) weight in grams, and (I) right ventricular hypertrophy (RVH): ratio of RV weight to total weight of LV and septum. J, Representative H&E-stained myocardial sections from control and NanogECΔHaplo mice show the presence of larger nuclei in NanogECΔHaplo mice. K, A picture of unfixed whole hearts collected on d30 indicates control litter mate hearts or hypertrophic/enlarged hearts in mice with the NanogECΔHaplo genotype. L, NanogECΔHaplo mice show increased systolic blood pressure (BP). Values are mean±SD obtained from 6 mice (3 male, 3 female) over 5 recording sessions each. M, NanogECΔHaplo mice show increased heart weight (HW). N, No change in BW. O, Increased cardiac index (CI=LV mass/body weight) in mice with the NanogECΔHaplo genotype measured on d30 post TAM injection. P, Quantification of a cardiomyocyte cross-sectional area in control and NanogECΔHaplo mice. Q, Representative wheat germ agglutinin staining of heart sections prepared from control and NanogECΔHaplo mice show an increased cardiomyocyte area in NanogECΔHaplo mice. R, Quantitative reverse transcription polymerase chain reaction (qRT-PCR) analyses of total mRNA extracted from whole hearts indicate altered expression of molecular markers associated with cardiac hypertrophy, Anp, Bnp, Cnp, eNOS, Et-1, and Myh7 in the NanogECΔHaplo mouse group vs control. S, Representative Western blot analyses of cell extracts prepared from CD31+ endothelial cells (ECs) show decreased eNOS (endothelial nitric oxide synthase) levels in NanogECΔHaplo vs control. T, Chromatin immunoprecipitation (ChIP) assay demonstrating NANOG binding to the eNOS promoter in response to Wnt3a (Wnt family member 3A) stimulation of cardiac ECs. For in vitro analyses, n=3–4 independent experiments; for in vitro analyses, n=6 mice/group. Statistical significance was determined by a 1-way ANOVA with Tukey post hoc analysis. Data are shown as mean±SD. *P<0.05 vs control; **P<0.01 vs control; ***P<0.005 vs respective control group; ns indicates not significant. Scale bar is 50 μm. All data points were pooled from 3 male and 3 female mice (n=6) as the observed cardiac pathology were identical.
Figure 7.
Figure 7.
Re-expression of hTERT (human telomerase reverse transcriptase) in Nanog-depleted cardiac endothelial cells (Ecs) partially restores the angiogenic activity of ECs. A, Timeline of transfection, knockdown, and rescue experiments. Cardiac ECs were co-transfected overnight with either control or Nanog shRNAs and hTERT cDNA (rescue experiment). After 48 h of transfection, ECs received either vehicle alone or Wnt3a (Wnt family member 3A; 50 ng/mL), which were used for downstream experiments. B, Quantification revealed decreased BrdU+ cells in the Nanog-depleted group (**P<0.005 vs control), but hTERT re-expression (addback) partially restored the effect of NANOG depletion (*P<0.05 vs control). C Representative images of the BrdU+ nuclei in indicated groups. Dark brown color indicates BrdU+ ECs. Scale bar, 20 μm. D. Quantification of TUNEL+ (terminal deoxynucleotidyl transferase dUTP nick-end labeling) nuclei in control, NANOG shRNA, and hTERT cDNA (re-expression/rescue) groups in the absence or presence of Wnt3a. E, Representative high-resolution confocal images of cultured ECs stained with anti-VE-cadherin (red) and TUNEL (green) indicate increased TUNEL+ cells in the NANOG knockdown group. Re-expression of hTERT cDNA in the NANOG knockdown group reduced the extent of TUNEL+ cells. Scale bar is 50 μm. F, Quantification of branching-point structures following NANOG knockdown and hTERT re-expression (rescue experiment) in ECs. G, Representative images of the formation of branching-point structures (black arrows) following NANOG depletion and hTERT re-expressing ECs. H, Efficiency of NANOG knockdown and hTERT cDNA re-expression in ECs was determined by Western blot (WB) analyses with indicated antibodies. Molecular weights are shown in kilo Dalton (kDa). For in vitro analyses, n=3 independent experiments. I, The quantification of WB signal intensities obtained from at least 3 independent experiments. Statistical significance was determined by a one-way ANOVA with Tukey post hoc analysis. Ns indicates not significant. Data are shown as mean±SD. *P<0.05, **P<0.01, ***PP<0.005, and ****P<0.001 vs respective control group.
Figure 8.
Figure 8.
Re-expression of hTERT (human telomerase reverse transcriptase) in NanogECΔHaplo mice decreases myocardial endothelial cells (Ecs) apoptosis and microvascular rarefaction. A, Strategy and timeline of in vivo rescue experiment. B–G, Representative microscopic images of indicated heart tissue sections stained with Asp175 (anti-Cleaved Caspase-3) and anti-CD31 antibodies at 10× and 20× magnifications. H and I, Control vascular structures and microvascular rarefaction were quantified by scoring CD31+ vascular structures. While EC apoptosis were scored by CD31+ and Asp175+ double staining. For rescue experiment, MT (NanogECΔHaplo) mice received ≈2.0×10¹²/mice live advirus particles through r.o. route on day 15 after the last TAM (tamoxifen) administration. Thus, MT-mice receiving hTERT-HA-AAV9 demonstrated increased CD31+ vascular structures (79±2.5%) and decreased apoptosis (8±2.7%), thereby decreased microvascular rarefaction. Statistical significance was determined by a 1-way ANOVA with Tukey post hoc analysis. Data are shown as mean±SD. *P<0.05 as shown. J. The extent of Nanog-deficiency and downregulation of Tert (telomerase reverse transcriptase; endogenous), Flk1, eNos, and Asp175 (Cleaved Caspase-3) were analyzed in protein extracts prepared from cardiac ECs of NanogECΔHaplo + hTERT-HA-AAV9 mice. The efficiency of hTERT-HA-AAV9 administration was analyzed by Western immunoblotting with anti-HA antibody of EC-proteins prepared from indicated mice. As quantified, the exogenous hTERT increased to 3-fold higher than the endogenous Tert. Moreover, reexpression of hTERT into mutant (MT) mice increased Flk1 and eNos levels and decreased Asp175, while there was no change in GAPDH. The quantification of Western blot (WB) signal intensities obtained from at least 3 independent experiments. All data points were pooled from male (3) and female (3) mice (total n=6) as there were no differences in the cardiac physiological end-points. For WB analyses, ECs from male and female mice were pooled as the cardiac pathology observed in these mice were identical. WT indicates wild type.

Similar articles

Cited by

References

    1. De Val S, Black BL. Transcriptional control of endothelial cell development. Dev Cell 200916180–195doi: 10.1016/j.devcel.2009.01.014 - PMC - PubMed
    1. Palencia-Desai S, Kohli V, Kang J, Chi NC, Black BL, Sumanas S. Vascular endothelial and endocardial progenitors differentiate as cardiomyocytes in the absence of Etsrp/Etv2 function. Development 20111384721–4732doi: 10.1242/dev.064998 - PMC - PubMed
    1. Park C, Kim TM, Malik AB. Transcriptional regulation of endothelial cell and vascular development. Circ Res 20131121380–1400doi: 10.1161/CIRCRESAHA.113.301078 - PMC - PubMed
    1. Wang XY, Lan Y, He WY, Zhang L, Yao HY, Hou CM, Tong Y, Liu YL, Yang G, Liu XD, et al. Identification of mesenchymal stem cells in aorta-gonad-mesonephros and yolk sac of human embryos. Blood 20081112436–2443doi: 10.1182/blood-2007-07-099333 - PubMed
    1. Kohler EE, Cowan CE, Chatterjee I, Malik AB, Wary KK. NANOG induction of fetal liver kinase-1 (FLK1) transcription regulates endothelial cell proliferation and angiogenesis. Blood 20111171761–1769doi: 10.1182/blood-2010-07-295261 - PMC - PubMed

Publication types

MeSH terms