. 2020 Jul 8;21(1):291.
doi: 10.1186/s12859-020-03604-4.

Critique of the pairwise method for estimating qPCR amplification efficiency: beware of correlated data!

Affiliations

Critique of the pairwise method for estimating qPCR amplification efficiency: beware of correlated data!

Joel Tellinghuisen. BMC Bioinformatics. .

Abstract

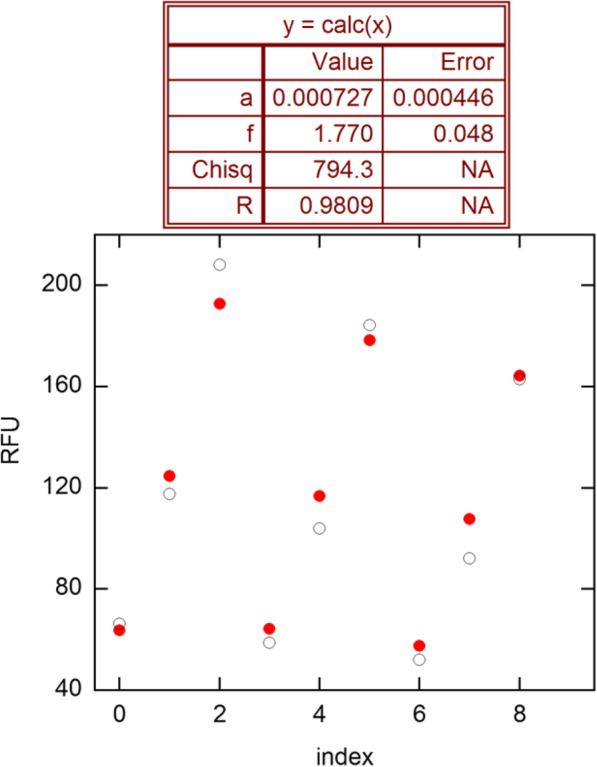
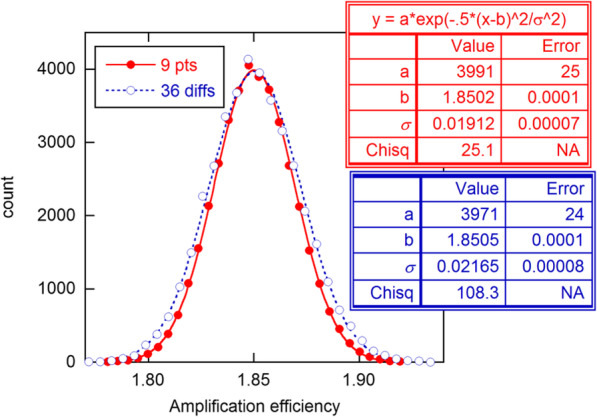
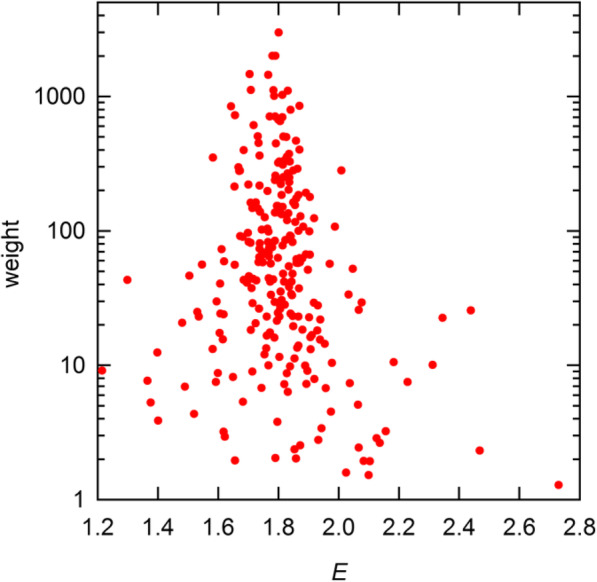
Background: A recently proposed method for estimating qPCR amplification efficiency E analyzes fluorescence intensity ratios from pairs of points deemed to lie in the exponential growth region on the amplification curves for all reactions in a dilution series. This method suffers from a serious problem: The resulting ratios are highly correlated, as they involve multiple use of the raw data, for example, yielding ~ 250 E estimates from ~ 25 intensity readings. The resulting statistics for such estimates are falsely optimistic in their assessment of the estimation precision.

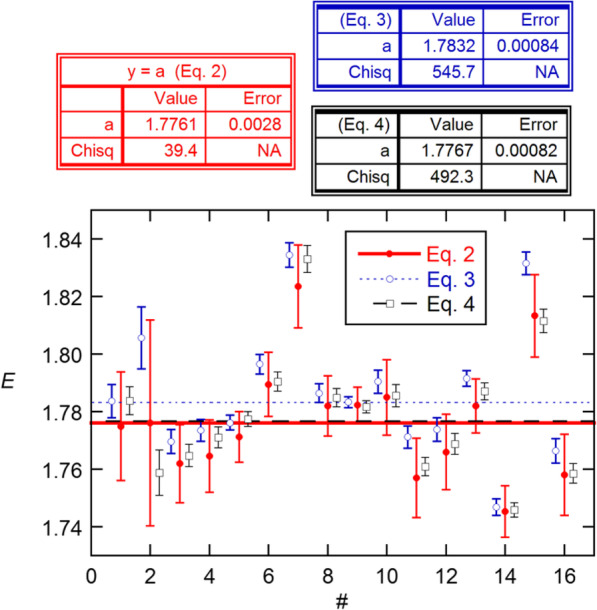
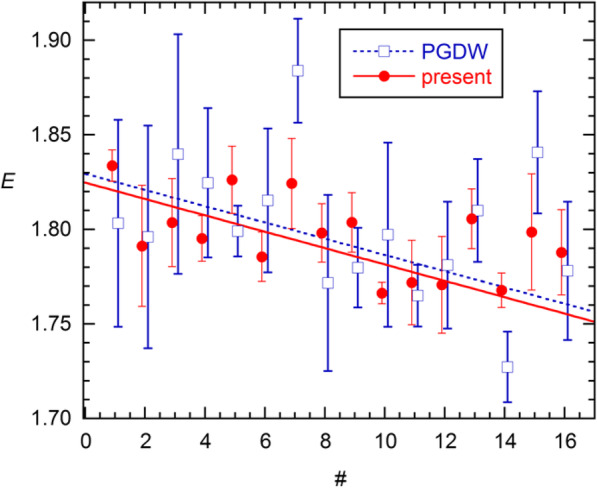
Results: Monte Carlo simulations confirm that the correlated pairs method yields precision estimates that are better than actual by a factor of two or more. This result is further supported by estimating E by both pairwise and Cq calibration methods for the 16 replicate datasets from the critiqued work, and then comparing the ensemble statistics for these methods.

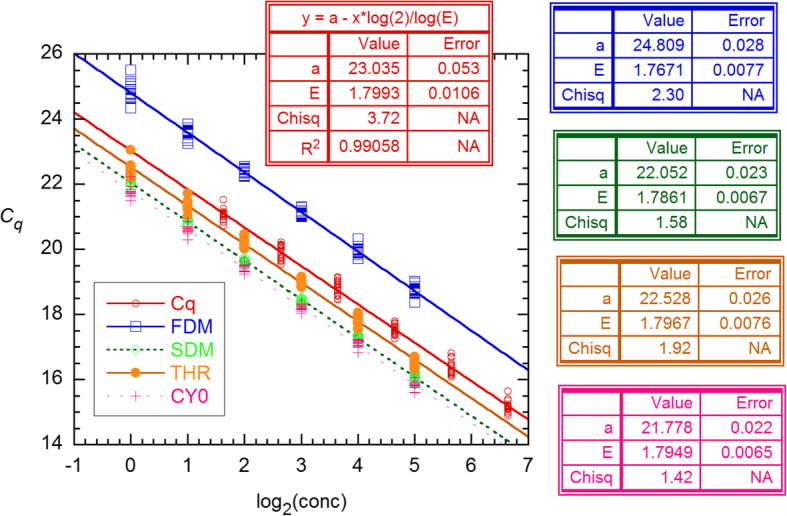
Conclusion: Contrary to assertions in the proposing work, the pairwise method does not yield E estimates a factor of 2 more precise than estimates from Cq calibration fitting (the standard curve method). On the other hand, the statistically correct direct fit of the data to the model behind the pairwise method can yield E estimates of comparable precision. Ways in which the approach might be improved are discussed briefly.

Keywords: Amplification efficiency; Calibration; Correlated data; Data analysis; Statistical errors; Weighted least squares; qPCR.


Conflict of interest statement

I declare no competing interests.

Figures

Fig. 1
Fig. 1
qPCR fluorescence data displayed in Fig. 2a in ref. [11]. The dilution factor is 2 for these curves, which represent the lowest 3 concentrations in the first C series. The horizontal dashed lines demarcate the exponential growth zone; this was set lower — 20-180 — for the full analysis in [11]. The RFU (relative fluorescence units) plateau values are ~ 600
Fig. 2
Fig. 2
Fit of the growth-zone points in Fig. 1 (solid) to the model of Eq. 2. Open points are calculated values. “Error” is the estimated SE. Chisq is the sum of squared residuals, from which the estimated variance is sy2 = 794.3/7 = 113.5, giving sy = 10.7
Fig. 3
Fig. 3
Histogrammed E values from 4 × 104 simulations of the 9-point model described in text, fitted directly to Eq. 2 and converted to differences for fitting to Eq. 3. The boxes show the results from fitting to the normal distribution, in which the counts were weighted inversely as the count (Poisson approximation)
Fig. 4
Fig. 4
E estimates obtained analyzing the 16 6-replicate data sets from PGDW using Eqs. 2–4, and their averages (lines). The x-axis numbers represent the data sets, as A1–6, A7–12, …, H7–12, with points for Eqs. 3 and 4 displaced slightly for display purposes. The KaleidaGraph fit results include a priori SEs (Error) [14]. The post-SEs are these values × (χ2/ν)1/2 = 0.0045, 0.0051, and 0.0047
Fig. 5
Fig. 5
LS fits of all 96 Cq values from [11] and those obtained for 4 different Cq markers using the methods of ref. [7]. The χ2 values (Chisq) are a direct measure of the precision of the data and indicate that the Cy0 estimates are best [15]
Fig. 6
Fig. 6
Calibration-based E estimates for the 16 6-point replicate datasets from [11], from Cq values reported by PGDW and from Cy0 values obtained using methods of [7]. The lines are results from weighted LS fits; the slope is − 0.0043(7) from the present results
Fig. 7
Fig. 7
Statistical weights for pairwise E estimates from the A1–6 dataset, displayed as a function of E. A single value at E = 1.58 has wi = 351; all others in the outlier zone (E < 1.60 and E > 2.15) have wi < 60. The full range of wi is 1.3–3000

References

    1. Pfaffl MW. A new mathematical model for relative quantification in real-time RT-PCR. Nucleic Acids Res. 2001;29:e45. doi: 10.1093/nar/29.9.e45. - DOI - PMC - PubMed
    1. Tellinghuisen J. Using nonlinear least squares to assess relative expression and its uncertainty in real-time qPCR studies. Anal Biochem. 2016;496:1–3. doi: 10.1016/j.ab.2015.10.016. - DOI - PubMed
    1. Bustin SA. Absolute quantification of mRNA using real-time reverse transcription polymerase chain reaction assays. J Mol Endocrinol. 2000;25:169–193. doi: 10.1677/jme.0.0250169. - DOI - PubMed
    1. Rutledge RG, Cote C. Mathematics of quantitative kinetic PCR and the application of standard curves. Nucleic Acids Res. 2003;31:e93. doi: 10.1093/nar/gng093. - DOI - PMC - PubMed
    1. Larionov A, Krause A, Miller W. A standard curve based method for relative real time PCR data processing. BMC Bioinformatics. 2005;6:62. doi: 10.1186/1471-2105-6-62. - DOI - PMC - PubMed

LinkOut - more resources