

A quasi-experimental approach using telemetry to assess migration-strategy-specific differences in the decision-making processes at stopover
- PMID: 32641125
- PMCID: PMC7346510
- DOI: 10.1186/s12898-020-00307-5
A quasi-experimental approach using telemetry to assess migration-strategy-specific differences in the decision-making processes at stopover
Abstract
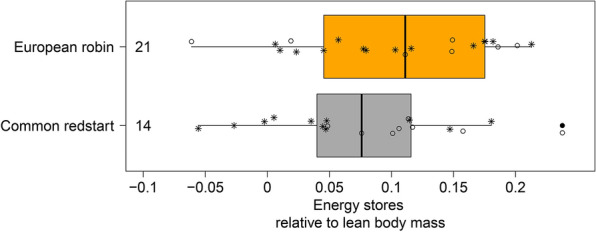
Background: Migrant birds travel between their breeding areas and wintering grounds by alternating energetically and physiologically demanding flights with periods of rest and fuelling, so-called stopovers. An important intrinsic factor influencing the decision to resume migration is the amount of energy stores available for the next flight. Correlative studies with free-flying birds and experimental studies with caged birds have shown that the amount of energy stores affects the day-to-day, within-day and the directional decision of departure. The methodological advantages of both the correlative and experimental approach are combined when radio-tagging many individuals on the same day and subsequently determining the departure decisions at a high spatiotemporal resolution. Making use of such a quasi-experimental approach with an automated radio-tracking system at stopover, we studied the effect of energy stores on departure decisions and whether they vary between species of different migration strategies experiencing contrasting time constraints. For this, we chose a long-distance migrant, the common redstart (Phoenicurus phoenicurus), and a medium-distance migrant, the European robin (Erithacus rubecula), because the former has to travel at relatively higher speed to reach its wintering ground in a reasonable time at the expense of relatively higher energetic costs for travelling than the latter.
Results: Common redstarts with higher energy stores were more likely to resume migration than their conspecifics with lower energy stores, whereas this pattern was absent in the European robins. The amount of energy stores significantly affected the timing of departure within the day, with large energy stores yielding early departures in both species. Departure directions from the stopover site during the first night after capture were oriented towards the seasonally appropriate direction but were not affected by variation in energy stores.
Conclusions: We demonstrate the importance of variation in energy stores on the departure decisions and that it may affect species with different migration strategies dissimilarly in autumn. Nevertheless, knowledge of other intrinsic factors, such as feeding conditions, health status and physiological consequences of previous flights, is additionally required to better understand the departure decisions of migrants, as this is the key to providing an overall assessment of the decision-making process.
Keywords: Bird; Common redstart; Departure decision; Energy stores; European robin; Migration; Radio-tracking; Stopover; Strategy.
Conflict of interest statement
The authors declare that they have no competing interests.
Figures


References
-
- Butler PJ, Woakes AJ. The physiology of bird flight. In: Gwinner E, editor. Bird migration. Berlin: Springer; 1990. pp. 300–318.
-
- Wikelski M, Tarlow EM, Raim A, Diehl RH, Larkin RP, Visser GH. Costs of migration in free-flying songbirds. Nature. 2003;423:704. - PubMed
-
- Schmaljohann H, Fox JW, Bairlein F. Phenotypic response to environmental cues, orientation and migration costs in songbirds flying halfway around the world. Anim Behav. 2012;84:623–640.
-
- Ferretti A, Rattenborg NC, Ruf T, McWilliams SR, Cardinale M, Fusani L. Sleeping unsafely tucked into conserve energy in a nocturnal migratory songbird. Curr Biol. 2019;29(16):2766–2772.e2764. - PubMed
-
- Eikenaar C, Winslott E, Hessler S, Isaksson C. Oxidative damage to lipids is rapidly reduced during migratory stopovers. Funct Ecol. 2020;34:6.
Publication types
MeSH terms
Grants and funding
LinkOut - more resources
Full Text Sources
