

Effect of Systemic Inflammatory Response to SARS-CoV-2 on Lopinavir and Hydroxychloroquine Plasma Concentrations
- PMID: 32641296
- PMCID: PMC7449226
- DOI: 10.1128/AAC.01177-20
Effect of Systemic Inflammatory Response to SARS-CoV-2 on Lopinavir and Hydroxychloroquine Plasma Concentrations
Abstract
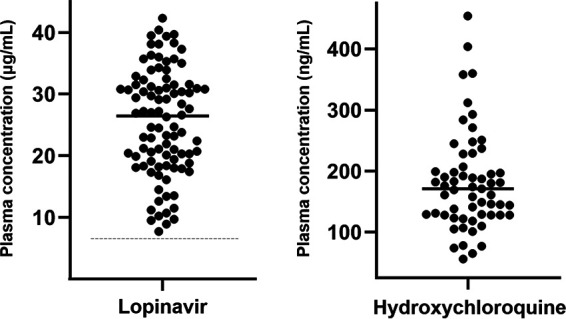
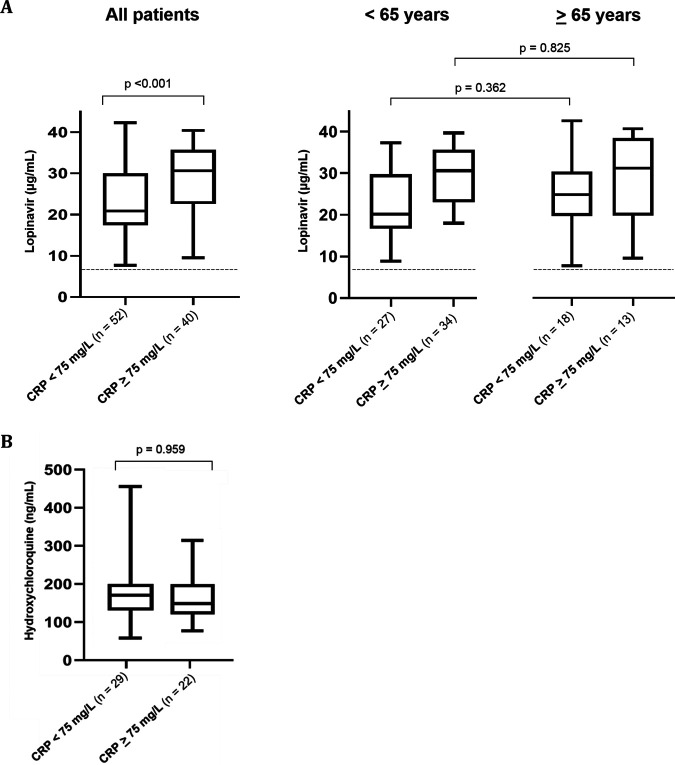
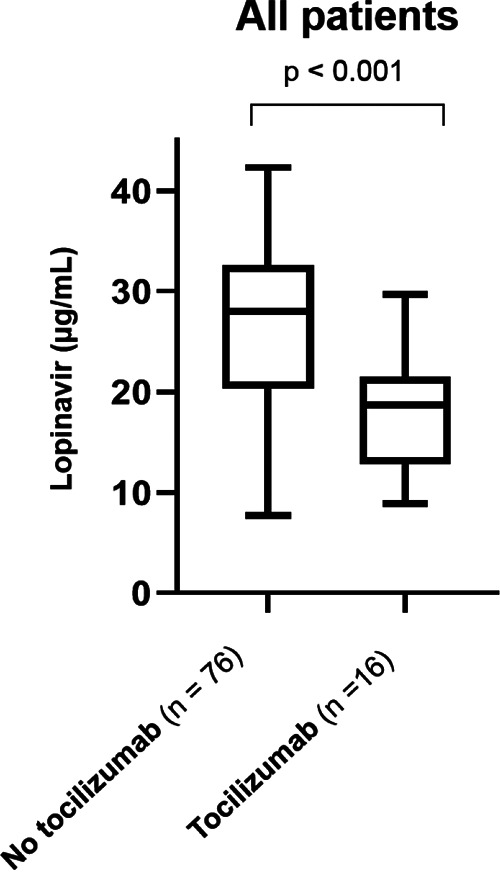
Coronavirus disease 2019 (COVID-19) leads to inflammatory cytokine release, which can downregulate the expression of metabolizing enzymes. This cascade affects drug concentrations in the plasma. We investigated the association between lopinavir (LPV) and hydroxychloroquine (HCQ) plasma concentrations and the levels of the acute-phase inflammation marker C-reactive protein (CRP). LPV plasma concentrations in 92 patients hospitalized at our institution were prospectively collected. Lopinavir-ritonavir was administered every 12 hours, 800/200 mg on day 1 and 400/100 mg on day 2 until day 5 or 7. HCQ was given at 800 mg, followed by 400 mg after 6, 24, and 48 h. Hematological, liver, kidney, and inflammation laboratory values were analyzed on the day of drug level determination. The median age of study participants was 59 (range, 24 to 85) years, and 71% were male. The median durations from symptom onset to hospitalization and treatment initiation were 7 days (interquartile range [IQR], 4 to 10) and 8 days (IQR, 5 to 10), respectively. The median LPV trough concentration on day 3 of treatment was 26.5 μg/ml (IQR, 18.9 to 31.5). LPV plasma concentrations positively correlated with CRP values (r = 0.37, P < 0.001) and were significantly lower when tocilizumab was preadministered. No correlation was found between HCQ concentrations and CRP values. High LPV plasma concentrations were observed in COVID-19 patients. The ratio of calculated unbound drug fraction to published SARS-CoV-2 50% effective concentrations (EC50) indicated insufficient LPV concentrations in the lung. CRP values significantly correlated with LPV but not HCQ plasma concentrations, implying inhibition of cytochrome P450 3A4 (CYP3A4) metabolism by inflammation.
Keywords: COVID-19; hydroxychloroquine; inflammation; levels; lopinavir-ritonavir.
Copyright © 2020 American Society for Microbiology.
Figures
References
-
- Fajgenbaum DC, Khor JS, Gorzewski A, Tamakloe MA, Powers V, Kakkis JJ, Repasky M, Taylor A, Beschloss A, Hernandez-Miyares L, Go B, Nimgaonkar V, McCarthy MS, Kim CJ, Pai RL, Frankl S, Angelides P, Jiang J, Rasheed R, Napier E, Mackay D, Pierson SK. 2020. Treatments administered to the first 9152 reported cases of COVID-19: a systematic review. Infect Dis Ther doi: 10.1007/s40121-020-00303-8 Epub ahead of print. - DOI - PMC - PubMed
-
- WHO. 2020. “Solidarity” clinical trial for COVID-19 treatments. https://www.who.int/emergencies/diseases/novel-coronavirus-2019/global-r....
Publication types
MeSH terms
Substances
LinkOut - more resources
Full Text Sources
Research Materials
Miscellaneous
