. 2020 Jun;30(6):814-825.
doi: 10.1101/gr.262774.120. Epub 2020 Jul 8.

Single-cell analysis of human embryos reveals diverse patterns of aneuploidy and mosaicism

Affiliations

Single-cell analysis of human embryos reveals diverse patterns of aneuploidy and mosaicism

Margaret R Starostik et al. Genome Res. 2020 Jun.

Abstract

Less than half of human zygotes survive to birth, primarily due to aneuploidies of meiotic or mitotic origin. Mitotic errors generate chromosomal mosaicism, defined by multiple cell lineages with distinct chromosome complements. The incidence and impacts of mosaicism in human embryos remain controversial, with most previous studies based on bulk DNA assays or comparisons of multiple biopsies of few embryonic cells. Single-cell genomic data provide an opportunity to quantify mosaicism on an embryo-wide scale. To this end, we extended an approach to infer aneuploidies based on dosage-associated changes in gene expression by integrating signatures of allelic imbalance. We applied this method to published single-cell RNA sequencing data from 74 human embryos, spanning the morula to blastocyst stages. Our analysis revealed widespread mosaic aneuploidies, with 59 of 74 (80%) embryos harboring at least one putative aneuploid cell (1% FDR). By clustering copy number calls, we reconstructed histories of chromosome segregation, inferring that 55 (74%) embryos possessed mitotic aneuploidies and 23 (31%) embryos possessed meiotic aneuploidies. We found no significant enrichment of aneuploid cells in the trophectoderm compared to the inner cell mass, although we do detect such enrichment in data from later postimplantation stages. Finally, we observed that aneuploid cells up-regulate immune response genes and down-regulate genes involved in proliferation, metabolism, and protein processing, consistent with stress responses documented in other stages and systems. Together, our work provides a high-resolution view of aneuploidy in preimplantation embryos, and supports the conclusion that low-level mosaicism is a common feature of early human development.


Figures

Figure 1.
Figure 1.
Approach for detecting aneuploidy in single-cell RNA-seq data based on complementary signatures of chromosome-wide gene expression alteration as well as allelic imbalance.
Figure 2.
Figure 2.
Aneuploidies discovered in scRNA-seq data from human preimplantation embryos (Petropoulos et al. 2016). (A) Proportions of aneuploid chromosomes, cells, and embryos detected at varying false discovery rates (FDR). Error rates were controlled while accounting for the hierarchical dependency structure of the data (chromosomes within cells within embryos) using TreeBH (Bogomolov et al. 2017). (B) Distribution of proportions of aneuploid cells per embryo at a 1% FDR.
Figure 3.
Figure 3.
Examples of chromosome abnormalities detected based on scRNA-seq data from human embryos. Each heat map represents data from an individual embryo. Rows of the heat maps represent single cells, whereas columns represent chromosomes (autosomes only). Dendrograms depict hierarchical clustering of aneuploidy signatures, roughly reflecting common ancestry among aneuploid cells. (A) Embryo E7.3 was called euploid with negligible deviations from the null observed for all chromosomes within all cells. (B) Embryo E5.13 exhibits a putative meiotic-origin trisomy of Chromosome 21. (C) Embryo E7.17 exhibits putative meiotic-origin monosomies of Chromosomes 4 and 13, mosaic monosomy of Chromosome 8, and sporadic low-level aneuploidies of other chromosomes. (D) Embryo E7.5 was inferred as mosaic near-haploid, with haploid or near-haploid signatures in eight of nine cells, but near-diploidy in one cell.
Figure 4.
Figure 4.
Comparisons of aneuploidy across cell types. (A) Individual cells plotted on the first and second UMAP dimensions, colored by cell type annotations from Stirparo et al. (2018). (B) Same as panel A, but for the second and third UMAP dimensions. (C) Cells plotted on the first and second UMAP dimensions, colored by aneuploidy status. (D) Same as panel C, but for the second and third UMAP dimensions. (E) Proportions of aneuploid cells, stratified by cell type. (F) Average marginal effects (AME) of cell types on aneuploidy rates relative to aneuploidy rates of trophectoderm cells—the source for PGT-A biopsies. Confidence intervals of all estimates overlap zero, indicating no significant difference for any cell type.
Figure 5.
Figure 5.
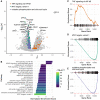
Transcriptional responses to aneuploidy in human embryos. (A) Volcano plot depicting differential expression between euploid and aneuploid cells. Positive values indicate increased expression in aneuploid cells, whereas negative values indicate reduced expression. (B) Hallmark gene sets from the Molecular Signatures Database (MSigDB) that are significantly enriched for genes that are up- or down-regulated in aneuploid cells based on gene set enrichment analysis (GSEA; 5% FDR). (C) Gene set enrichment plot demonstrating that genes regulated by NF-kB in response to tumor necrosis factor are significantly up-regulated in aneuploid cells. (D) Same as panel C, but demonstrating that MYC targets exhibit reduced expression in aneuploid cells. (E) Same as panel C, but demonstrating that genes involved in oxidative phosphorylation are down-regulated in aneuploid cells.

References

    1. Bacher R, Chu L-F, Leng N, Gasch AP, Thomson JA, Stewart RM, Newton M, Kendziorski C. 2017. SCnorm: robust normalization of single-cell RNA-seq data. Nat Methods 14: 584–586. 10.1038/nmeth.4263 - DOI - PMC - PubMed
    1. Bates D, Mächler M, Bolker B, Walker S. 2015. Fitting linear mixed-effects models using lme4. J Stat Softw 67: 1–48. 10.18637/jss.v067.i01 - DOI
    1. Benjamini Y, Hochberg Y. 1995. Controlling the false discovery rate: a practical and powerful approach to multiple testing. J Royal Stat Soc Ser B Methodol 57: 289–300. 10.1111/j.2517-6161.1995.tb02031.x - DOI
    1. Bogomolov M, Peterson CB, Benjamini Y, Sabatti C. 2017. Testing hypotheses on a tree: new error rates and controlling strategies. arXiv:1705.07529v2 [stat.ME]. - PMC - PubMed
    1. Bolton H, Graham SJL, Van der Aa N, Kumar P, Theunis K, Fernandez Gallardo E, Voet T, Zernicka-Goetz M. 2016. Mouse model of chromosome mosaicism reveals lineage-specific depletion of aneuploid cells and normal developmental potential. Nat Commun 7: 11165 10.1038/ncomms11165 - DOI - PMC - PubMed

Publication types

Substances

LinkOut - more resources