Comment
. 2020 Oct 1;80(19):4233-4243.
doi: 10.1158/0008-5472.CAN-20-0865. Epub 2020 Jul 8.

Leveraging Systematic Functional Analysis to Benchmark an In Silico Framework Distinguishes Driver from Passenger MEK Mutants in Cancer

Affiliations
Comment

Leveraging Systematic Functional Analysis to Benchmark an In Silico Framework Distinguishes Driver from Passenger MEK Mutants in Cancer

Aphrothiti J Hanrahan et al. Cancer Res. .

Abstract

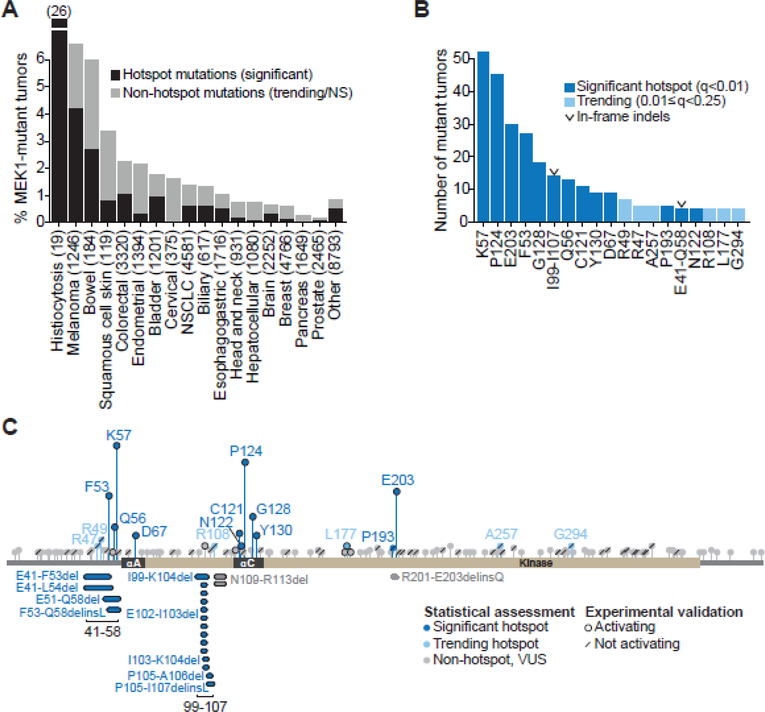
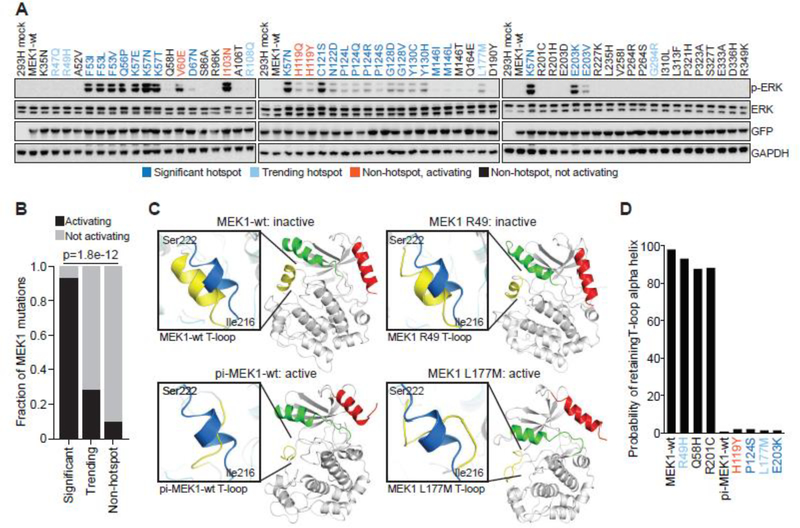
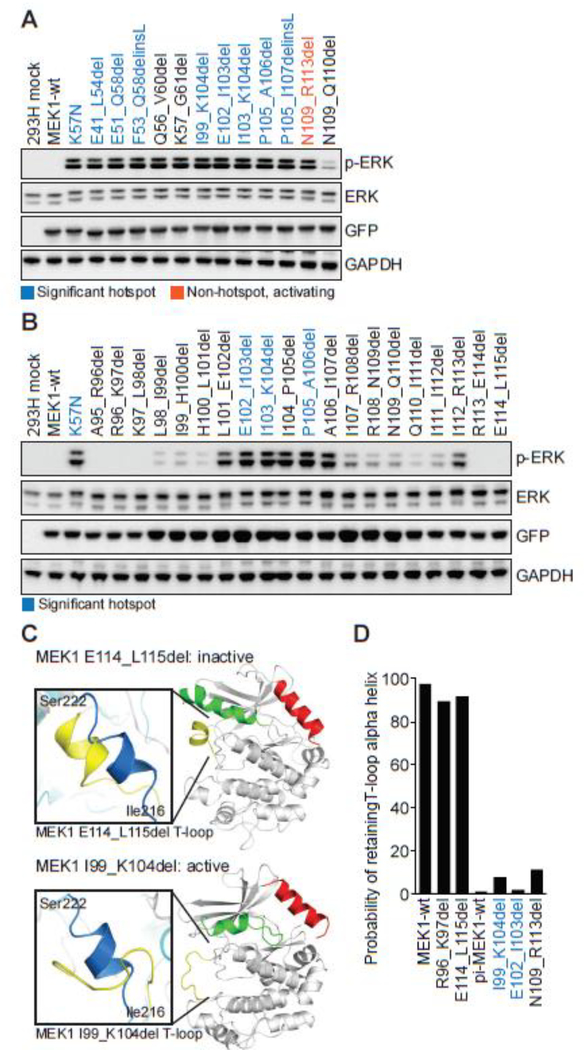
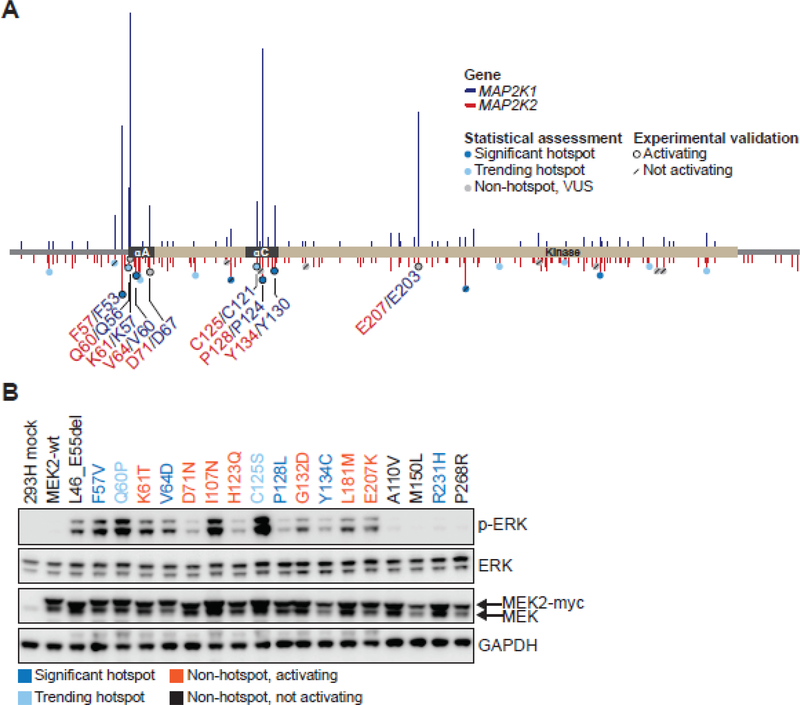
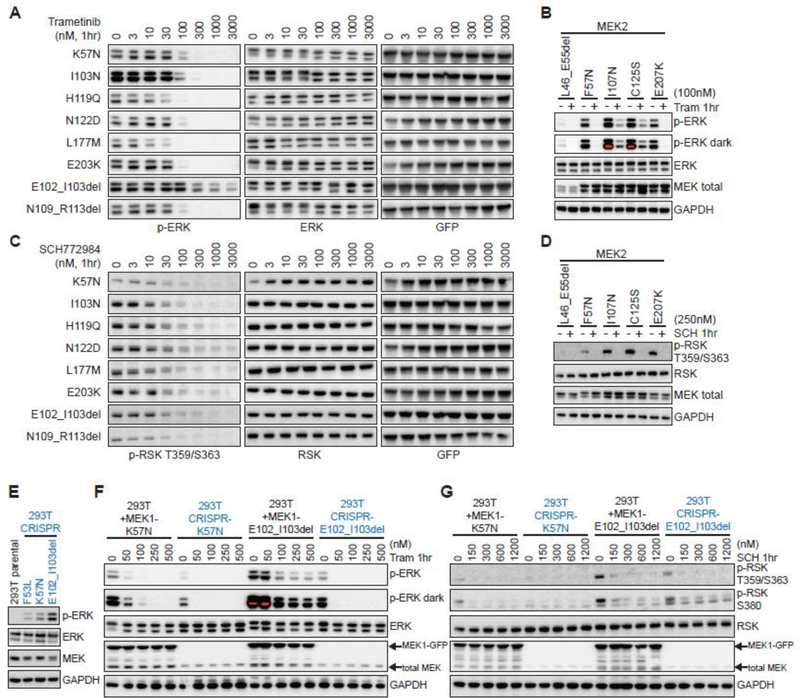
Despite significant advances in cancer precision medicine, a significant hurdle to its broader adoption remains the multitude of variants of unknown significance identified by clinical tumor sequencing and the lack of biologically validated methods to distinguish between functional and benign variants. Here we used functional data on MAP2K1 and MAP2K2 mutations generated in real-time within a co-clinical trial framework to benchmark the predictive value of a three-part in silico methodology. Our computational approach to variant classification incorporated hotspot analysis, three-dimensional molecular dynamics simulation, and sequence paralogy. In silico prediction accurately distinguished functional from benign MAP2K1 and MAP2K2 mutants, yet drug sensitivity varied widely among activating mutant alleles. These results suggest that multifaceted in silico modeling can inform patient accrual to MEK/ERK inhibitor clinical trials, but computational methods need to be paired with laboratory- and clinic-based efforts designed to unravel variabilities in drug response. SIGNIFICANCE: Leveraging prospective functional characterization of MEK1/2 mutants, it was found that hotspot analysis, molecular dynamics simulation, and sequence paralogy are complementary tools that can robustly prioritize variants for biologic, therapeutic, and clinical validation.See related commentary by Whitehead and Sebolt-Leopold, p. 4042.


Figures

Figure 1.
Figure 1.. Landscape of MAP2K1 (MEK1) alterations in human cancer.
A, Percentage of tumors with somatic MAP2K1 mutations as a function of cancer type in a cohort of 42,434 sequenced tumor/normal pairs. Mutations were classified as significant hotspots (black) versus trending or not-significant (NS) non-hotspots (gray). B, Number of tumor samples per indicated significant hotspot (dark blue) or trending hotspot site (light blue). Two significant clusters of in-frame deletions are labeled with a “v” symbol. C, MEK1 protein schematic depicting the amino acid position, domain location, and recurrence of the 458 MEK1 mutants. Missense mutants were plotted above, and in-frame deletions were plotted below the domain schematic. Mutants were categorized as significant hotspots (q<0.01, dark blue), trending hotspots (0.01≤q<0.25, light blue) or non-hotspots (q>0.25, gray). Variants shown in subsequent functional studies to increase p-ERK expression are highlighted with a black ring, whereas those that had no effect on p-ERK are noted with a forward slash.
Figure 2.
Figure 2.. Concordance of biochemical and 3D modeling of MEK1 mutants.
A, GFP-tagged wildtype MEK1 (MEK1-wt) and MEK1 missense mutants were expressed in 293H cells. Expression of phosphorylated ERK (p-ERK), total ERK, GFP (MEK1) and GAPDH levels were assessed by western blot. Mutations were color coded as follows: statistically significant hotspot (dark blue); trending hotspot (light blue); non-hotspot, activating (orange); non-hotspot, not activating (black) B, Quantification of the accuracy of the computational inference of hotspot as compared to functional validation. Bars represent the fraction of either significant, trending, or not-significant mutants that were validated as activating in biochemical assays (black) versus not activating (gray). Statistical significance reflects enrichment of biochemical validation with hotspot prediction, p value = 1.8e−12. C, The structural changes to the MEK1 protein predicted to occur upon mutation of specific residues as assessed by molecular dynamics (MD) simulation. Results were compared to the simulated structure of MEK1-wt and phosphomimetic-MEK1-wt (pi-MEK1-wt). D, Quantitation of the probability that the natural T-loop alpha helix structure (inactive conformation) is retained following MD simulation of select MEK1 mutants.
Figure 3.
Figure 3.. Functional and molecular dynamics characterization of two clusters of in-frame MEK1 deletions involving the negative regulatory domain and helix C.
A, MEK1 in-frame deletions were expressed in 293H cells and p-ERK expression compared to the K57N mutant. Expression of total ERK, GFP (MEK1) and GAPDH were assessed as controls. Mutations identified in patient tumors from our 42K cohort were color coded as statistically significant hotspots (dark blue), novel non-hotspot activating indels (orange), or other MEK1 in-frame deletions reported in the literature or used for comparison (black). B, Step-wise, two-base pair deletion mutants of MEK1 from A96 to K115 were expressed in 293H cells and p-ERK expression was assessed by western blot. C-D, The conformational changes and probability of retaining the wildtype T-loop alpha helix structure following molecular dynamics simulation for MEK1 in-frame deletion mutants, as in Figs. 2C–D.
Figure 4.
Figure 4.. MEK2 residues paralogous to MEK1 hotspots are activating.
A, MEK2 protein schematic depicting the amino acid position, domain location, and recurrence of MEK2 mutants (below x axis, red) aligned with paralogous MEK1 mutants (above x axis, blue). MEK2 mutants were categorized as significant hotspots (q<0.01, dark blue), trending hotspots (0.01≤q<0.25, light blue) or non-hotspots (q>0.25, gray). Experimentally validated calls were outlined with a black ring indicating a mutation that induced p-ERK expression, or a forward slash signifying variants that had no effect on p-ERK expression. Functional MEK2 mutants identified in patient tumors within our 42K cohort are noted in red lettering, along with their paralogous MEK1 residues in navy blue. B, myc-tagged MEK2 mutants were generated, overexpressed in 293H cells and induction of ERK phosphorylation (p-ERK) was assessed by western blot. Expression of total ERK, MEK and GAPDH were assessed as controls. Hotspot MEK2 mutants (dark blue), trending hotspots (light blue), non-hotspot activating (orange), and non-hotspot, not activating (black) mutants are indicated.
Figure 5.
Figure 5.. MEK1/2 mutants are variably sensitive to MEK and ERK inhibition.
A-B, Hotspot and activating MEK1 (A) or MEK2 (B) missense and in-frame deletion mutants were expressed in 293H cells for 24hr, then treated for 1hr with vehicle or (A) the MEK inhibitor trametinib (33000nM) or (B) trametinib at 100nM followed by assessment of p-ERK expression by western blot. C-D, Hotspot and activating MEK1 (C) or MEK2 (D) missense and in-frame deletion mutants were expressed in 293H cells for 24hr, then treated for 1hr with vehicle or (C) the ERK inhibitor SCH772984 (3–3000nM) or (D) SCH772984 at 250nM followed by assessment of p-RSK expression by western blot. E, p-ERK expression in 293T cells in which MEK1 F53L, K57N or MEK E102_I103del mutants were knocked-in using CRISPR/Cas9. F-G, MEK1 K57N or E102_103del constructs were overexpressed in 293T and compared to their respective 293T MEK1 CRISPR knock-in derived cell lines (in blue) for changes in p-ERK (F) or p-RSK (G) at baseline and after 1hr treatment with vehicle or increasing doses of (F) trametinib (50–500nM) or (G) SCH772984 (150–1200nM).

Comment in

Comment on

References

    1. Cheng ML, Berger MF, Hyman DM, Solit DB. Clinical tumour sequencing for precision oncology: time for a universal strategy. Nature reviews Cancer 2018;18:527–8 - PMC - PubMed
    1. Diamond EL, Durham BH, Haroche J, Yao Z, Ma J, Parikh SA, et al. Diverse and Targetable Kinase Alterations Drive Histiocytic Neoplasms. Cancer Discov 2016;6:154–65 - PMC - PubMed
    1. Van Allen EM, Wagle N, Sucker A, Treacy DJ, Johannessen CM, Goetz EM, et al. The genetic landscape of clinical resistance to RAF inhibition in metastatic melanoma. Cancer Discov 2014;4:94–109 - PMC - PubMed
    1. Gao Y, Chang MT, McKay D, Na N, Zhou B, Yaeger R, et al. Allele-Specific Mechanisms of Activation of MEK1 Mutants Determine Their Properties. Cancer Discov 2018;8:648–61 - PMC - PubMed
    1. Gounder MM, Solit DB, Tap WD. Trametinib in Histiocytic Sarcoma with an Activating MAP2K1 (MEK1) Mutation. The New England journal of medicine 2018;378:1945–7 - PMC - PubMed

Publication types