Multicenter Study
. 2020 Jul 8:370:m2194.
doi: 10.1136/bmj.m2194.

Association of plasma biomarkers of fruit and vegetable intake with incident type 2 diabetes: EPIC-InterAct case-cohort study in eight European countries

Affiliations
Multicenter Study

Association of plasma biomarkers of fruit and vegetable intake with incident type 2 diabetes: EPIC-InterAct case-cohort study in eight European countries

Ju-Sheng Zheng et al. BMJ. .

Abstract

Objective: To investigate the association of plasma vitamin C and carotenoids, as indicators of fruit and vegetable intake, with the risk of type 2 diabetes.

Design: Prospective case-cohort study.

Setting: Populations from eight European countries.

Participants: 9754 participants with incident type 2 diabetes, and a subcohort of 13 662 individuals from the European Prospective Investigation into Cancer and Nutrition (EPIC) cohort of 340 234 participants: EPIC-InterAct case-cohort study.

Main outcome measure: Incident type 2 diabetes.

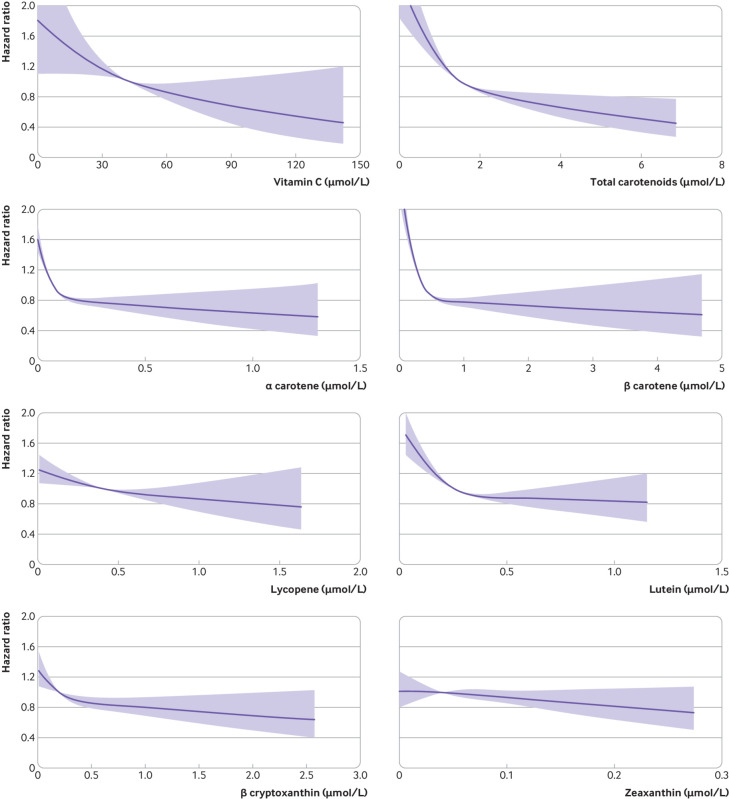
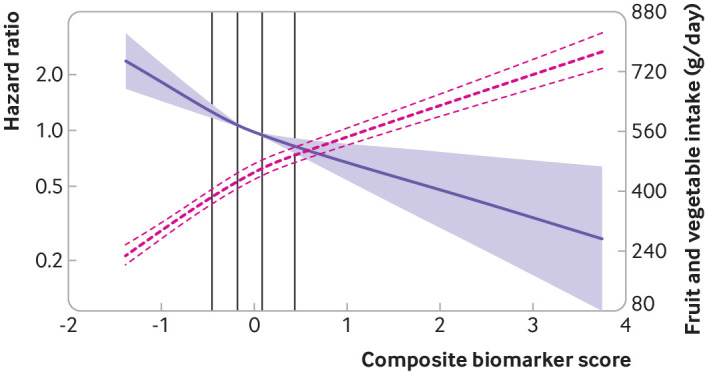
Results: In a multivariable adjusted model, higher plasma vitamin C was associated with a lower risk of developing type 2 diabetes (hazard ratio per standard deviation 0.82, 95% confidence interval 0.76 to 0.89). A similar inverse association was shown for total carotenoids (hazard ratio per standard deviation 0.75, 0.68 to 0.82). A composite biomarker score (split into five equal groups), comprising vitamin C and individual carotenoids, was inversely associated with type 2 diabetes with hazard ratios 0.77, 0.66, 0.59, and 0.50 for groups 2-5 compared with group 1 (the lowest group). Self-reported median fruit and vegetable intake was 274 g/day, 396 g/day, and 508 g/day for participants in categories defined by groups 1, 3, and 5 of the composite biomarker score, respectively. One standard deviation difference in the composite biomarker score, equivalent to a 66 (95% confidence interval 61 to 71) g/day difference in total fruit and vegetable intake, was associated with a hazard ratio of 0.75 (0.67 to 0.83). This would be equivalent to an absolute risk reduction of 0.95 per 1000 person years of follow up if achieved across an entire population with the characteristics of the eight European countries included in this analysis.

Conclusions: These findings indicate an inverse association between plasma vitamin C, carotenoids, and their composite biomarker score, and incident type 2 diabetes in different European countries. These biomarkers are objective indicators of fruit and vegetable consumption, and suggest that diets rich in even modestly higher fruit and vegetable consumption could help to prevent development of type 2 diabetes.


Conflict of interest statement

Competing interests: All authors have completed the ICMJE uniform disclosure form at www.icmje.org/coi_disclosure.pdf and declare: support from European commission, UK Medical Research Council, British Heart Foundation, and National Institute for Health Research Cambridge Biomedical Research Centre for the submitted work; no financial relationships with any organisations that might have an interest in the submitted work in the previous three years; no other relationships or activities that could appear to have influenced the submitted work. Where authors are identified as personnel of the International Agency for Research on Cancer/World Health Organization, the authors alone are responsible for the views expressed in this article and they do not necessarily represent the decisions, policy, or views of the International Agency for Research on Cancer/WHO.

Figures

Fig 1
Fig 1
Association of dietary factors with plasma vitamin C and carotenoids in the subcohort of the European Prospective Investigation into Cancer and Nutrition (EPIC)-InterAct study. The values in the box represent the differences in vitamin C, carotenoids, or the composite biomarker score (in standard deviaiton units) for each one standardised unit per category difference in dietary factors. The mean (standard deviation) or percentage of participants for the examined dietary factors are presented in the second column. Linear regression was used to obtain the country specific estimate of an association, adjusting for demographic, lifestyle, and other examined dietary factors if available in that country, except the overlapping food groups. The country-specific estimates were then combined using random effects meta-analysis. *P<0.05; †P<0.001; ‡P<0.0001. Sample size was 10 584 for vitamin C and 11 537 for the carotenoid estimation. All the values are expressed in a red scale for different levels of positive associations and blue scale for different levels of negative associations. All the carotenoids variables were natural log transformed before statistical analysis in the linear regression. Standard deviation was 19.2 µmol/L for vitamin C, 0.50 for total carotenoids (log transformed), 0.91 for α carotene (log transformed), 0.73 for β carotene (log transformed), 0.68 for lycopene (log transformed), 0.51 for lutein (log transformed), 0.91 for zeaxanthin (log transformed), 0.94 for β cryptoxanthin (log transformed), and 0.57 for the composite biomarker score. A β coefficient of 0.10 represents the increase in the composite biomarker score per 100 g/day of fruit and vegetable intake. Performing this cross sectional analysis the other way round, every change in one standard deviation in the composite biomarker score was associated with a 66 g/day increase in fruit and vegetable intake
Fig 2
Fig 2
Associations of plasma vitamin C and carotenoids with incident type 2 diabetes in the European Prospective Investigation into Cancer and Nutrition (EPIC)-InterAct Study. The purple solid line and the shaded area represent estimates of hazard ratios and the 95% confidence intervals, respectively, for each biomarker (median in the subcohort as a reference). Covariates included age (as underlying time scale), sex, centre, physical activity, smoking status, employment, marital status, education, alcohol intake, total energy intake, high density lipoprotein cholesterol (for analyses of carotenoids only), low density lipoprotein cholesterol (for analyses of carotenoids only), body mass index, and waist circumference. For total carotenoids, α carotene, β carotene, and lutein, we found evidence of a non-linear association (P value for non-linearity <0.001)
Fig 3
Fig 3
Associations of plasma composite biomarker score with incident type 2 diabetes and total fruit and vegetable intake in the European Prospective Investigation into Cancer and Nutrition (EPIC)-InterAct Study. The purple solid line and shaded areas represent hazard ratios and 95% confidence intervals for the association of the composite biomarker score with type 2 diabetes (median as a reference), adjusted for age (as underlying time scale), sex, centre, physical activity, smoking status, employment, marital status, education, alcohol intake, total energy intake, high density lipoprotein cholesterol, low density lipoprotein cholesterol, body mass index, and waist circumference. The red dashed lines represent the association of the composite biomarker score with fruit and vegetable intake (best estimates and their 95% confidence intervals), adjusted for age, sex, centre, physical activity, smoking status, employment, marital status, education, alcohol intake, total energy intake, body mass index, waist circumference, and dietary intake of potatoes, cereal and cereal products, milk and dairy products, fruit and vegetable juice, soft drinks, fish, red meat, legumes, egg and egg products, nuts and seeds, offals, and vitamin supplement use. P values for non-linearity were 0.056 for the hazard ratios, and <0.001 for estimates for fruit and vegetable intake. The vertical lines within the figure represent the quintiles (20th, 40th, 60th, and 80th centiles) of the composite biomarker score in the subcohort

Comment in

  • Dietary factors in the risk of T2DM.
    Greenhill C. Greenhill C. Nat Rev Endocrinol. 2020 Oct;16(10):537. doi: 10.1038/s41574-020-0401-5. Nat Rev Endocrinol. 2020. PMID: 32724182 No abstract available.
  • "5 am Tag" schützt auch vor Diabetes.
    Müssig K. Müssig K. MMW Fortschr Med. 2020 Nov;162(Suppl 3):30. doi: 10.1007/s15006-020-4562-x. MMW Fortschr Med. 2020. PMID: 33164183 Review. German. No abstract available.

References

    1. Cho NH, Shaw JE, Karuranga S, et al. IDF Diabetes Atlas: global estimates of diabetes prevalence for 2017 and projections for 2045. Diabetes Res Clin Pract 2018;138:271-81. 10.1016/j.diabres.2018.02.023 - DOI - PubMed
    1. Jannasch F, Kröger J, Schulze MB. Dietary patterns and type 2 diabetes: a systematic literature review and meta-analysis of prospective studies. J Nutr 2017;147:1174-82. 10.3945/jn.116.242552 - DOI - PubMed
    1. Mamluk L, O’Doherty MG, Orfanos P, et al. Fruit and vegetable intake and risk of incident of type 2 diabetes: results from the consortium on health and ageing network of cohorts in Europe and the United States (CHANCES). Eur J Clin Nutr 2017;71:83-91. 10.1038/ejcn.2016.143 - DOI - PMC - PubMed
    1. Cooper AJ, Forouhi NG, Ye Z, et al. InterAct Consortium Fruit and vegetable intake and type 2 diabetes: EPIC-InterAct prospective study and meta-analysis. Eur J Clin Nutr 2012;66:1082-92. 10.1038/ejcn.2012.85 - DOI - PMC - PubMed
    1. Carter P, Gray LJ, Troughton J, Khunti K, Davies MJ. Fruit and vegetable intake and incidence of type 2 diabetes mellitus: systematic review and meta-analysis. BMJ 2010;341:c4229. 10.1136/bmj.c4229 - DOI - PMC - PubMed

Publication types