. 2020 Jul 8;12(551):eaaz5683.
doi: 10.1126/scitranslmed.aaz5683.

PRMT5 control of cGAS/STING and NLRC5 pathways defines melanoma response to antitumor immunity

Affiliations

PRMT5 control of cGAS/STING and NLRC5 pathways defines melanoma response to antitumor immunity

Hyungsoo Kim et al. Sci Transl Med. .

Abstract

Protein arginine methyltransferase 5 (PRMT5) controls diverse cellular processes and is implicated in cancer development and progression. Here, we report an inverse correlation between PRMT5 function and antitumor immunity. PRMT5 expression was associated with an antitumor immune gene signature in human melanoma tissue. Reducing PRMT5 activity antagonized melanoma growth in immunocompetent but not immunocompromised mice. PRMT5 methylation of IFI16 [interferon-γ (IFN-γ)-inducible protein 16] or its murine homolog IFI204, which are components of the cGAS/STING (stimulator of IFN genes) pathway, attenuated cytosolic DNA-induced IFN and chemokine expression in melanoma cells. PRMT5 also inhibited transcription of the gene encoding NLRC5 (nucleotide-binding oligomerization domain-like receptor family caspase recruitment domain containing 5), a protein that promotes the expression of genes implicated in major histocompatibility complex class I (MHCI) antigen presentation. PRMT5 knockdown augmented IFN and chemokine production and increased MHCI abundance in melanoma. Increased expression of IFI204 and NLRC5 was associated with decreased melanoma growth in murine models, and increased expression of IFI16 and NLRC5 correlated with prolonged survival of patients with melanoma. Combination of pharmacological (GSK3326595) or genetic (shRNA) inhibition of PRMT5 with immune checkpoint therapy limited growth of murine melanoma tumors (B16F10 and YUMM1.7) and enhanced therapeutic efficacy, compared with the effect of either treatment alone. Overall, our findings provide a rationale to test PRMT5 inhibitors in immunotherapy-based clinical trials as a means to enhance an antitumor immune response.


Conflict of interest statement

Competing Interests: ZR is a co-founder and serves as scientific advisor to Pangea Therapeutics. All other authors declare no competing interests.

Figures

Figure 1.
Figure 1.. Melanoma specimens with low PRMT5 expression show an enriched immune gene signature.
(A) PRMT5 expression in metastatic melanoma specimens based on TCGA datasets. Inset shows comparison between low (blue box) and high (red box) PRMT5 expression cohorts (n=368). (B) Top-ranked pathways predicted using the Ingenuity Pathway Analysis (IPA) based on differentially-expressed genes (DEGs) in specimens exhibiting either low or high PRMT5 expression. Blue bars indicate pathways likely inhibited in the PRMT5-high group. (C) Representative immune gene sets enriched in GSEA of DEGs from melanoma specimens with low or high PRMT5. The top 14 genes for each gene set are shown in respective heatmaps. Heatmaps of genes in the enriched gene sets indicating clustering of immune response genes. Columns represent PRMT5 low (n = 100, gray bar) and high (n = 100, yellow bar) TCGA-SKCM samples whereas rows represent genes. Normalized expression levels of the genes in each gene sets were converted to log2 (FPKM + 0.1) and subsequently transformed to z-scores. The gene sets were k-means clustered (K = 5), choosing the K by plotting the “within sum of squares” (a metric denoting dissimilarity among the members of a cluster) versus different values of K. Genes associated with immune response are indicated on the heatmaps.
Figure 2.
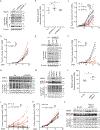
Figure 2.. Attenuation of melanoma growth following PRMT5 inhibition requires intact host immunity.
(A) Western blot analysis showing PRMT5 expression (upper) and activity (middle) in protein extracts prepared from B16 murine melanoma cells transduced with scrambled (Scr) or PRMT5-specific hairpin shRNAs (shPRMT5–1 or shPRMT5–2) and probed with indicated antibodies. β-actin served as a loading control (lower). Hereafter, “S.exp” and “L.exp” represent short and long exposure, respectively. “SDME-RG” indicates anti-symmetric dimethyl arginine antibody (Cell Signaling). (B) Growth in culture of B16 cells stably expressing shPRMT5 or Scr control (n=5 for each group). (C) Volume of control and PRMT5-KD B16 tumors (Scr; n=8, shPRMT5–1; n=8, shPRMT5–2; n=7) grafted (s.c., 0.2 million cells) into immunocompetent C57BL/6 mice and measured at indicated time points. (D) Volume of control and PRMT5-KD B16 tumors (Scr; n=5, shPRMT5; n=6) grafted (s.c., 0.2 million cells) into immunocompromised NSG mice and measured at indicated time points. (E) Western blot analysis of PRMT5 expression (upper) and activity (middle) in extracts of tumor cells cultured from indicated tumor pools (Scr-pool, cells from 5 Scrambled-KD tumors; shPRMT5 pools 1 and 2, cells from 3 shPRMT5-KD tumors each). β-actin served as a loading control (lower). (F) Control or shPRMT5-KD tumor cells isolated and pooled from tumors grown in NSG mice (panel D) were re-grafted into syngeneic immunocompetent mice (Scr; n=5, shPRMT5; n=6) and assessed at indicated time points. (G) Western blot analysis of PRMT5 expression (upper) and activity (lower) in tumors generated as in panel F, using indicated antibodies. GAPDH served as a loading control (middle). (H) Western blot analysis of PRMT5 expression and activity in YUMMER1.7 cells expressing indicated expression vectors. GAPDH served as a loading control. (I) Growth of YUMMER1.7 cells in culture following transfection with control (EV+EV, n=5) or PRMT5+WDR77 constructs (n=5). (Protein analysis is shown in panel H.) (J-K) Volume of control and PRMT5+WDR77-overexpressing YUMMER1.7 cell tumors (Scr; n=8, PRMT5+WDR77; n=8) grafted (s.c., 0.4 million cells) into C57BL6 (J) or NSG (K) mice and measured at indicated time points. (L) Western blot analysis of PRMT5 expression and activity in tumors generated as in panel K, using indicated antibodies. GAPDH served as a loading control. Data are presented as means ± s.d. * p<0.05; ** p<0.01; *** p<0.001; **** p<0.0001; “ns” not significant.
Figure 3.
Figure 3.. PRMT5 expression decreases invasion by tumor infiltrating leukocytes (TILs).
(A) Immune phenotyping performed using flow cytometry using the indicated cell surface markers on Scr- and shPRMT5-transduced B16 tumors, collected at day 17. Two independent experiments are presented. (B) Ratio of abundance was calculated by dividing number of activated CD8 T cells (CD44hiCD8+) by that of MDSC (CD11b+GR1+) or regulatory T cells (CD4+FOXP3+). (C) Infiltration of CD4+ and CD8+ immune cells into B16 tumors 12 days after grafting into C57BL/6 mice, as evaluated by immunohistochemistry (left). Quantification of infiltrated immune cells in Scr-KD (n=5) and shPRMT5-KD (n=3) tumors was performed using Image J. Data are presented as means ± sem. (D) Immune phenotyping performed using flow cytometry and indicated cell surface markers in YUMMER1.7 tumors expressing control (EV+EV, n=7) or PRMT5+WDR77 constructs (n=4). Tumors were collected at day 12. (E-H) B16 cells stably expressing control (Scr) or PRMT5 shRNA (shPRMT5) were grafted into C57BL/6 mice (n=8) administered control (IgG) or neutralizing antibodies against either NK1.1 (200 μg/mouse panels E and F) or CD8 (200 μg/mouse panels G and H) every three days starting one day prior to tumor inoculation. Shown are tumor volumes (E and G) and percent survival (F and H). Data are presented as means ± s.d., unless specified. *, **, *** and **** represent p<0.05, p<0.01, p<0.001 and p<0.0001, respectively.
Figure 4.
Figure 4.. PRMT5 methylates the cGAS complex component IFI16/IFI204.
(A) Melanoma patient specimens expressing comparable PRMT5 levels were grouped based on low or high levels of PRMT5 adaptor proteins (namely, SHARPIN, WDR77, RIOK1, COPRS, CLNS1A, nd MEN1). DEGs were analyzed using GSEA. (B) Heat map depicting normalized enrichment score (NES) and q value of false discovery rate (FDR-q) for PRMT5 adaptor proteins in immune-associated hallmark gene sets. (C) Immunoprecipitation (IP) followed by immunoblotting (IB) of WM115 cell lysates (1.2 mg) with indicated antibodies. (D) B16 cells were treated with vehicle (DMSO) or PRMT5 inhibitor (PRMT5i; EPZ015666, 10 μM) for 48. IP followed by IB of B16 cells lysates (1.5 mg) was performed with the indicated antibodies. SYM10 indicates anti-symmetric dimethyl arginine antibody (Millipore). (E–F) A375 (E) or B16 (F) cells treated with vehicle or a PRMT5 inhibitor (EPZ015666, 10 μM) as above before lysates [A375 (1.0 mg), B16 (2.5 mg)] were prepared and subjected to IP followed by immunoblotting with indicated antibodies. (G) B16 cells stably expressing indicated constructs were treated 24 h with DMSO or PRMT5i (EPZ015666, 10 μM) before lysates were IP’d with V5 antibody and immunoblotted with indicated antibodies. WT: IFI204 WT; Mt1, Mt2 and Mt1/2: IFI204 mutants R12A, R538A or RR12/538AA, respectively; EV: empty vector. (H) In vitro methylation assay of WT or mutant IFI204 proteins (200 ng) purified from HEK293T cell lysates, with or without recombinant active PRMT5 plus WDR77 (500 ng) proteins. Proteins were visualized using PonceauS and InstantBlue staining (lower panels) and subjected to autoradiography (upper). Histone 4 served as a positive control.
Figure 5.
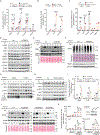
Figure 5.. PRMT5 methylation of IFI204 determines the degree of cGAS/STING pathway activation.
(A–C) B16 cells were: transduced with either scramble (Scr) or Prmt5-specific shRNAs (shPRMT5–1, shPRMT5–2) (A), treated for 24 hr with PRMT5i (EPZ015666, 10 μM) (B), or subjected to ectopic expression of control (pLX304 and pLenti) or PRMT5 + WDR77 (pLX304-WDR77/pLenti-PRMT5) (C). Following respective treatments, cells were stimulated with dsDNA (transfected V70mer; 500 ng/ml). Six hr later cell lysates were prepared and assayed using qPCR for expression of indicated transcripts. (D–F) Analysis of cGAS/STING complex components by Western blot analysis (D), semi-native-PAGE (E), or BlueNative-PAGE (F) of proteins prepared from B16 cells subjected to PRMT5 KD using corresponding shRNA (as in panel A) followed by stimulation with dsDNA (V70mer; 1.5 μg/ml) for indicated times. Lower panels show Ponceau S staining (lower panels in E, F) “d” and “m” (panel E) represent “dimer” and “monomer” forms of STING. (G-H) Analysis of cGAS/STING complex components with indicated antibodies using Western blot analysis of lysates prepared from B16 cells either treated with PRMT5i (as in panel B) or stably expressing PRMT5+WDR77 (as in panel C) following stimulation with dsDNA (transfected V70mer; 1.5 μg/ml) for indicated times. (I) B16 cells stably expressing pLX304 (EV), IFI204WT (WT), the IFI204R12A mutant (Mt1) or the IFI204R538A mutant (Mt2) were transfected with V70mer (500 ng/ml) for 6 hr and then assessed for expression of indicated transcripts by qPCR. (J) B16 cells stably expressing IFI204 plasmids (as in panel I) were transfected with V70mer (1.5 μg/ml) for indicated times followed by analysis of cell lysates by semi-native-PAGE blotting with indicated antibodies and Ponceau S staining. STING dimer (d) and monomer (m) forms are noted. (K) B16 cells transduced with Scr or Prmt5-specific shRNAs were transfected with scrambled control (siCont) or Sting-specific (siSting) siRNAs for 48 hr. Cells were then stimulated 6 h with dsDNA (transfected V70mer; 500 ng/ml) before lysates were prepared for qPCR analysis of indicated transcripts. Western blot inset depicts level of STING expression. Data are presented as means ±s.d. *, **, *** and **** represent p<0.05, p<0.01, p<0.001 and p<0.0001, respectively.
Figure 6.
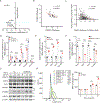
Figure 6.. PRMT5 negatively regulates NLRC5 to modulate MHCI antigen presentation.
(A) Correlation of PRMT5 expression with that of genes implicated in antigen presentation in melanoma lines (CCLE, cancer cell line encyclopedia datasets, n=58) was evaluated using Pearson’s correlation coefficient (plotted on X-axis) and –log (p value) (plotted on the Y-axis). Blue line indicates cutoff level for p<0.05. (B) Pearson’s correlation of PRMT5 and NLRC5 mRNA expression in melanoma cell lines (CCLE, n=58). (C) Pearson’s correlation of PRMT5 and NLRC5 mRNA expression in melanoma patient specimens (TCGA, n=368). (D–F) qPCR analysis of genes implicated in antigen presentation was performed in B16 cells either transduced with Scr or Prmt5-specific shRNAs (shPRMT5–1, shPRMT5–2) (D), treated with PRMT5i (MTA, 100 μM for 24 hr) (E), or stably expressing EV or PRMT5+WDR77 (F). (G) Immunoblotting of lysates of B16 cells transduced with scrambled (Scr) or shPRMT5 and treated 24 hr with indicated concentrations (ng/ml) of interferon gamma (IFNγ) using antibodies to indicated proteins. (H) Cell surface MHCI expression (H-2Kb) in B16 cells subjected to indicated treatments, as assessed by flow cytometry (left). Quantification of mean fluorescence intensity (MFI) (right). Data are presented as means ± s.d. *, **, *** and **** represent p<0.05, p<0.01, p<0.001 and p<0.0001, respectively.
Figure 7.
Figure 7.. Co-expression of mutant IFI16/IFI204 and NLRC5 inhibits melanoma growth
(A) B16 cells were transduced with EV or expression vectors harboring IFI204Mt1 and/or NLRC5 and then analyzed by Western blotting for indicated proteins (A). (B) Tumor growth was assessed in mice (n=8) grafted with B16 cells established in (A). (C) Growth of B16 cells in culture (established in A) was monitored using ATPlite assay. Data are presented as means ± s.d. Statistical significance of changes in tumor growth and cell growth were assessed using two-way ANOVA with Tukey’s correction and one-way ANOVA with Dunnett’s test. (D, E) Left panels show classification of specimens based on low or high levels of IFI16 (D) or NLRC5 (E) expression (based on TCGA, metastatic population of melanoma, n=368). Right panels show overall survival of melanoma patients based on relative expression of IFI16 (D) or NLRC5 (E).
Figure 8.
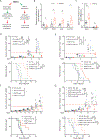
Figure 8.. PRMT5 inhibition synergizes with anti-PD1 immune check-point therapy.
(A) Proposed model for PRMT5 control of IFN/chemokine expression and antigen presentation pathways. (B–C) Expression of transcripts encoding indicated IFN/chemokines (B) and immune checkpoint components (C) based on qPCR of tumors transduced with control (Scr-KD, n=7) or PRMT5-KD (shPRMT5, n=7), 17 days after tumor cell inoculation (D) B16 cells transduced with scrambled (Scr) or shPRMT5 were grafted into C57BL/6 mice (n=8) subsequently treated with control IgG or anti-PD1 antibody (200 μg/mouse at days, 8, 11, 14, 17 and 20). Tumor volume (upper) and percent survival (lower) were assessed at indicated time points. (E) B16 cells were grafted into syngeneic C57BL/6 mice (n=6–8) subsequently treated with PRMT5i (GSK3326595, 40 mg/kg from day 10) and/or anti-PD1 antibody (200 μg/mouse at days 11, 14 and 17). Tumor volume (upper) and percent survival (lower) were assessed at indicated time points. (F) YUMM1.7 cells were grafted into syngeneic C57BL/6 mice (n=7–8) subsequently treated with PRMT5i (GSK3326595, 40 mg/kg from day 7) and/or anti-PD1 antibody (at days 8, 11, 14 and 17). Tumor volume (upper) and percent survival (lower) were monitored at indicated time points. (G) YUMM1.7 cells were grafted into syngeneic C57BL/6 mice (n=7) subsequently administered anti-CD8+ antibody (200 μg/mouse) every three days, starting one day prior to tumor inoculation. As indicated, mice were also administered PRMT5i (GSK3326595, 40 mg/kg from day 8) and/or anti-PD1 antibody at days 9, 12, 15 and 18. Tumor volume (upper) and percent survival (lower) were monitored at indicated time points. For statistical analyses, tumor response was calculated based on tumor volume and percent survival, using Fisher’s exact test and a log-rank test, respectively. *, **, *** and **** represent p<0.05, p<0.01, p<0.001 and p<0.0001, respectively.

References

    1. Hodi FS, O’Day SJ, McDermott DF, Weber RW, Sosman JA, Haanen JB, Gonzalez R, Robert C, Schadendorf D, Hassel JC, Akerley W, van den Eertwegh AJ, Lutzky J, Lorigan P, Vaubel JM, Linette GP, Hogg D, Ottensmeier CH, Lebbe C, Peschel C, Quirt I, Clark JI, Wolchok JD, Weber JS, Tian J, Yellin MJ, Nichol GM, Hoos A, Urba WJ, Improved survival with ipilimumab in patients with metastatic melanoma. N Engl J Med 363, 711–723 (2010). - PMC - PubMed
    1. Postow MA, Chesney J, Pavlick AC, Robert C, Grossmann K, McDermott D, Linette GP, Meyer N, Giguere JK, Agarwala SS, Shaheen M, Ernstoff MS, Minor D, Salama AK, Taylor M, Ott PA, Rollin LM, Horak C, Gagnier P, Wolchok JD, Hodi FS, Nivolumab and ipilimumab versus ipilimumab in untreated melanoma. N Engl J Med 372, 2006–2017 (2015). - PMC - PubMed
    1. Larkin J, Chiarion-Sileni V, Gonzalez R, Grob JJ, Cowey CL, Lao CD, Schadendorf D, Dummer R, Smylie M, Rutkowski P, Ferrucci PF, Hill A, Wagstaff J, Carlino MS, Haanen JB, Maio M, Marquez-Rodas I, McArthur GA, Ascierto PA, Long GV, Callahan MK, Postow MA, Grossmann K, Sznol M, Dreno B, Bastholt L, Yang A, Rollin LM, Horak C, Hodi FS, Wolchok JD, Combined Nivolumab and Ipilimumab or Monotherapy in Untreated Melanoma. N Engl J Med 373, 23–34 (2015). - PMC - PubMed
    1. Schachter J, Ribas A, Long GV, Arance A, Grob JJ, Mortier L, Daud A, Carlino MS, McNeil C, Lotem M, Larkin J, Lorigan P, Neyns B, Blank C, Petrella TM, Hamid O, Zhou H, Ebbinghaus S, Ibrahim N, Robert C, Pembrolizumab versus ipilimumab for advanced melanoma: final overall survival results of a multicentre, randomised, open-label phase 3 study (KEYNOTE-006). Lancet 390, 1853–1862 (2017). - PubMed
    1. Spranger S, Bao R, Gajewski TF, Melanoma-intrinsic beta-catenin signalling prevents anti-tumour immunity. Nature 523, 231–235 (2015). - PubMed

Publication types

Substances