Comparative Study
. 2020 Jul 8;11(1):3410.
doi: 10.1038/s41467-020-17240-2.

Immunological and inflammatory profiles in mild and severe cases of COVID-19

Affiliations
Comparative Study

Immunological and inflammatory profiles in mild and severe cases of COVID-19

Jin-Wen Song et al. Nat Commun. .

Abstract

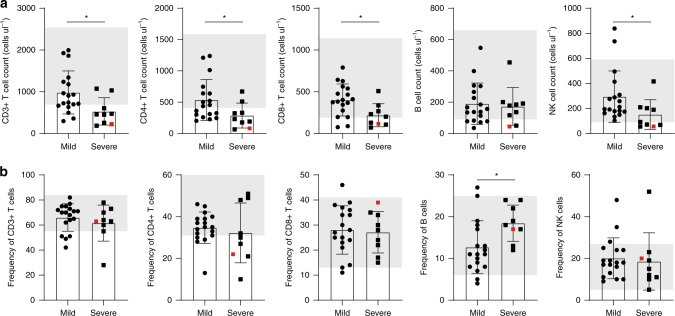
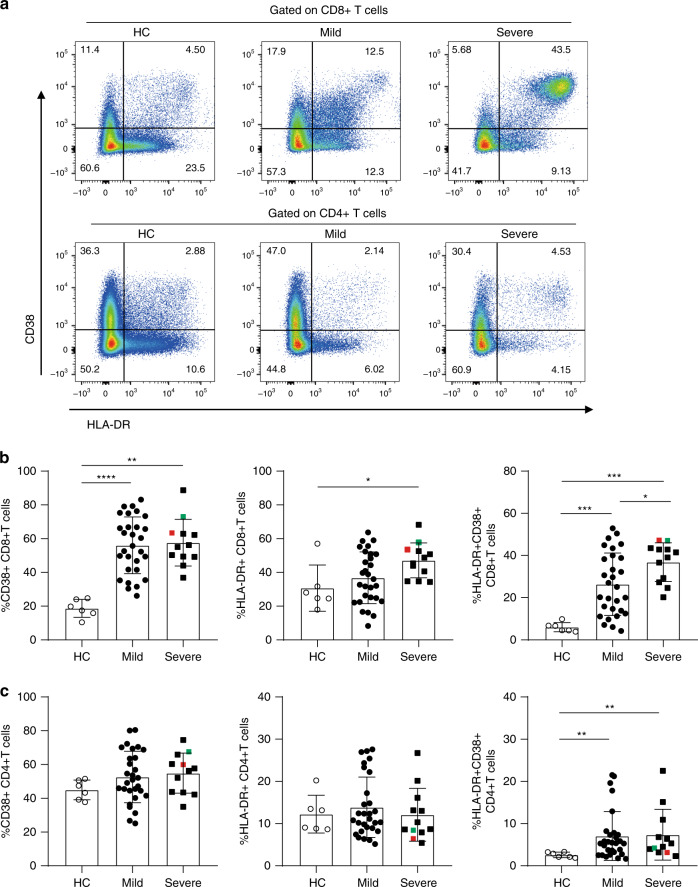
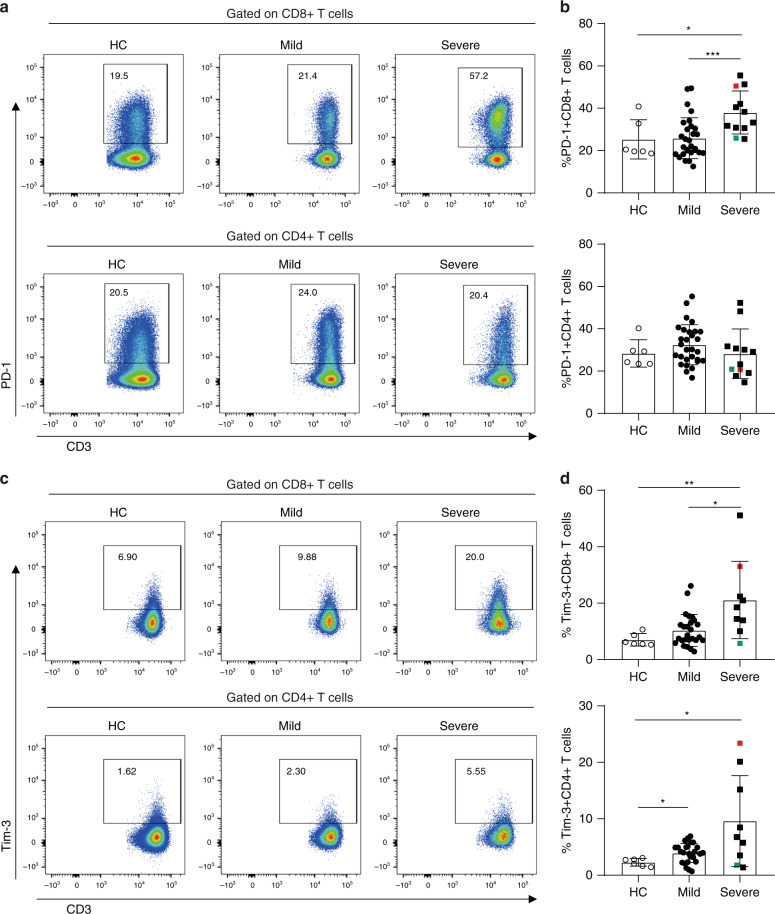
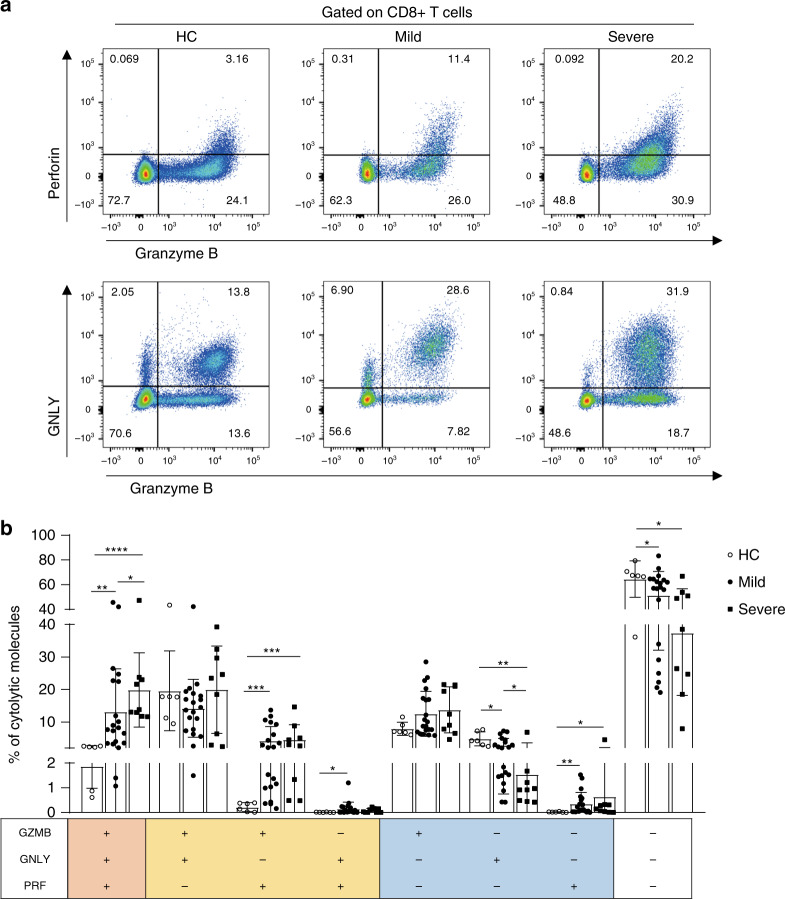
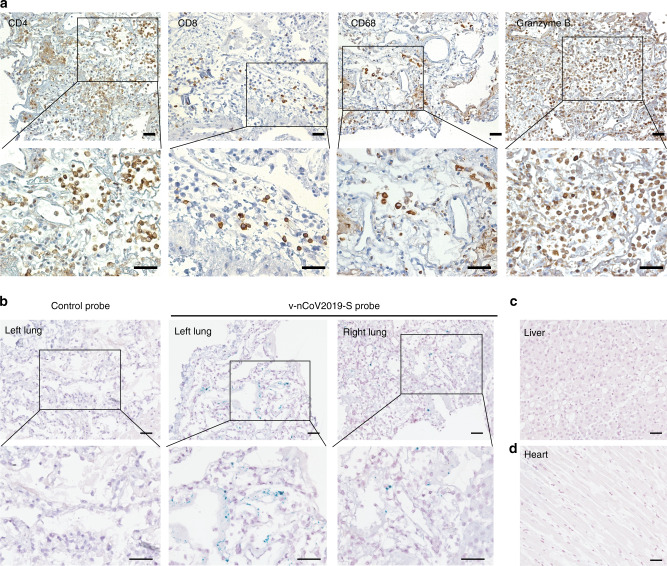
COVID-19 is associated with 5.1% mortality. Although the virological, epidemiological, clinical, and management outcome features of COVID-19 patients have been defined rapidly, the inflammatory and immune profiles require definition as they influence pathogenesis and clinical expression of COVID-19. Here we show lymphopenia, selective loss of CD4+ T cells, CD8+ T cells and NK cells, excessive T-cell activation and high expression of T-cell inhibitory molecules are more prominent in severe cases than in those with mild disease. CD8+ T cells in patients with severe disease express high levels of cytotoxic molecules. Histochemical studies of lung tissue from one fatality show sub-anatomical distributions of SARS-CoV-2 RNA and massive infiltration of T cells and macrophages. Thus, aberrant activation and dysregulation of CD8+ T cells occur in patients with severe COVID-19 disease, an effect that might be for pathogenesis of SARS-CoV-2 infection and indicate that immune-based targets for therapeutic interventions constitute a promising treatment for severe COVID-19 patients.


Conflict of interest statement

The authors declare no competing interests.

Figures

Fig. 1
Fig. 1. Absolute cell counts and percentages of peripheral lymphocyte subsets in SARS-CoV-2 infected patients.
a Absolute cell counts and b percentages of CD3+ T cells, CD4+ T cells, CD8+ T cells, B cells, and NK cells in the mild (n = 18) and severe (n = 9) group were analyzed by flow cytometry. Shaded region showing the normal range of indicated cell subset. Colored symbols indicated deceased cases. Data are expressed as mean ± SD. *p < 0.05 by two-tailed Mann–Whitney U-test for a (p = 0.0124, p = 0.0354, p = 0.0199, and p = 0.0354, respectively) and b (p = 0.015). Source data included as a Source Data File.
Fig. 2
Fig. 2. Increased expression of activation markers on T cells in SARS-CoV-2 infected patients.
a Representative dot plots showing CD38 and HLA-DR expression on CD8+ and CD4+ T cells from PBMCs of HC, Mild and Severe COVID-19 patients. b, c The percentage of CD38 and HLA-DR single positive or double positive b CD8+ T cells or c CD4+ T cells in PBMCs of HC (n = 6), mild (n = 29) and severe (n = 12) SARS-COV-2 infected patients was assessed by flow cytometry. Colored symbols indicated deceased cases. Data are expressed as mean ± SD. *p < 0.05, ***p < 0.001, ****p < 0.0001, by two-tailed Mann–Whitney U-test for b (p < 0.0001 and p = 0.0001 for CD38+CD8+T cells, p = 0.0135 for HLA-DR+CD8+T cells, and p = 0.0002, p = 0.0001, and p = 0.0372 for HLA-DR+CD38+CD8+T cells) and c (p = 0.0088 and p = 0.0046 for HLA-DR+CD38+CD4+T cells, respectively). Source data included as a Source Data File.
Fig. 3
Fig. 3. Exhaustion of T cells in SARS-COV-2 infected patients.
a, b PD-1 expression on CD8+ T and CD4+ T cells in HC (n = 6), mild (n = 29), and severe (n = 12) patients of SARS-COV-2 infection. c, d TIM-3 expression on CD8+ T and CD4+ T cells in HC (n = 6), mild (n = 29), and severe (n = 12) patients of SARS-COV-2 infection. Colored symbols indicated deceased cases. Data are expressed as mean ± SD. *p < 0.05, **p < 0.01, ***p < 0.001, by two-tailed Mann–Whitney U-test for b (p = 0.032 and p = 0.0005) and d (p = 0.0076 and p = 0.0105 for Tim-3+CD8+ T cells, and p = 0.0185 and p = 0.0496 for Tim-3+CD4+ T cells, respectively). Source data included as a Source Data File.
Fig. 4
Fig. 4. Co-expression patterns of cytotoxic effectors in CD8+ T cells from SARS-COV-2 infected patients.
a, b Cytolytic molecules were assessed by flow cytometry, and the proportions of CD8+ T lymphocytes co-expression of GNLY, GZMB, PRF were analyzed in HC (n = 6), mild (n = 20), and severe (n = 9) patients of SARS-COV-2 infection. Data are expressed as mean ± SD. *p < 0.05, **p < 0.01, ***p < 0.001, ****p < 0.0001 by two-tailed Mann–Whitney U-test for b (p = 0.002, p = 0.0004, and p = 0.0386 for GZMB+GNLY+PRF+ cells, p = 0.0006 and p = 0.0004 for GZMB+GNLY-PRF+ cells, p = 0.0459 for GZMB-GNLY+PRF+ cells, p = 0.0331, p = 0.0048, and p = 0.03 for GZMB-GNLY+PRF− cells, p = 0.0026 and p = 0.0496 for GZMB-GNLY-PRF+ cells, and p = 0.0279 and p = 0.012 for GZBM-GNLY-PRF− cells, respectively). Source data included as a Source Data File.
Fig. 5
Fig. 5. Lymphocyte infiltration and viral distribution in lung.
a Immunohistochemical staining with anti-CD4, anti-CD8, anti-CD68 and anti-GZMB in lung tissues, scale bar = 50 μm. bd Representative microscopy images of both left and right lungs (b), liver (c), and heart (d) sections from a COVID-19 patient hybridized with control or SARS-CoV-2-specific probes, scale bar = 50 μm. Independent experiments are repeated at least three times.

References

    1. World Health Organization. Coronavirus disease 2019 (COVID-19) situation report—157. https://www.who.int/docs/default-source/coronaviruse/situation-reports/2... (2020).
    1. Chan JF, et al. Genomic characterization of the 2019 novel human-pathogenic coronavirus isolated from a patient with atypical pneumonia after visiting Wuhan. Emerg. Microbes Infect. 2020;9:221–236. doi: 10.1080/22221751.2020.1719902. - DOI - PMC - PubMed
    1. Chan JF, et al. A familial cluster of pneumonia associated with the 2019 novel coronavirus indicating person-to-person transmission: a study of a family cluster. Lancet. 2020;395:514–523. doi: 10.1016/S0140-6736(20)30154-9. - DOI - PMC - PubMed
    1. Chen N, et al. Epidemiological and clinical characteristics of 99 cases of 2019 novel coronavirus pneumonia in Wuhan, China: a descriptive study. Lancet. 2020;395:507–513. doi: 10.1016/S0140-6736(20)30211-7. - DOI - PMC - PubMed
    1. Huang C, et al. Clinical features of patients infected with 2019 novel coronavirus in Wuhan, China. Lancet. 2020;395:497–506. doi: 10.1016/S0140-6736(20)30183-5. - DOI - PMC - PubMed

Publication types

MeSH terms