. 2020 Jul 8;11(1):3500.
doi: 10.1038/s41467-020-17318-x.

Seroprevalence of antibodies against SARS-CoV-2 among health care workers in a large Spanish reference hospital

Affiliations

Seroprevalence of antibodies against SARS-CoV-2 among health care workers in a large Spanish reference hospital

Alberto L Garcia-Basteiro et al. Nat Commun. .

Abstract

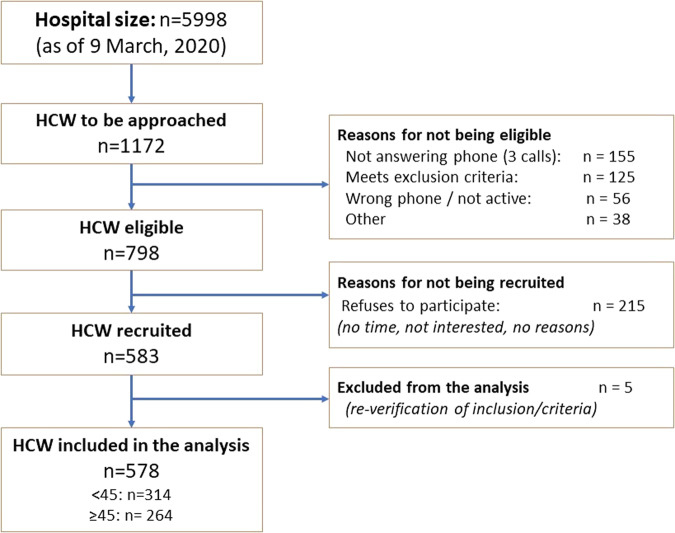
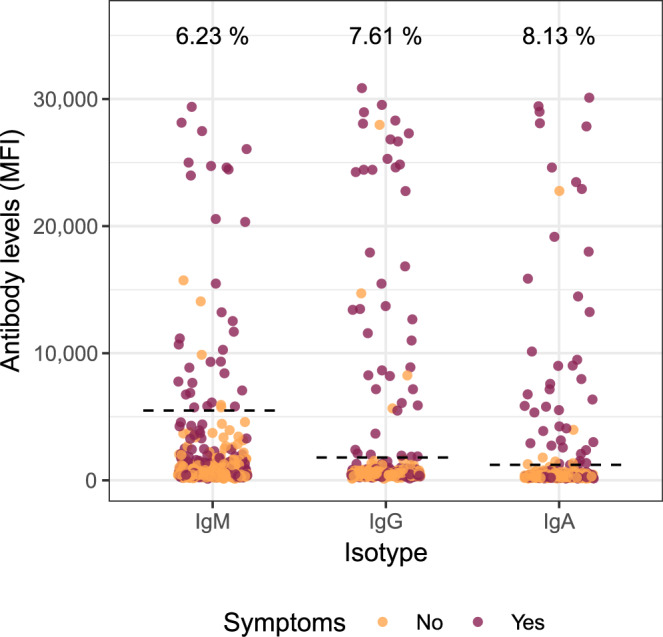
Health care workers (HCW) are a high-risk population to acquire SARS-CoV-2 infection from patients or other fellow HCW. This study aims at estimating the seroprevalence against SARS-CoV-2 in a random sample of HCW from a large hospital in Spain. Of the 578 participants recruited from 28 March to 9 April 2020, 54 (9.3%, 95% CI: 7.1-12.0) were seropositive for IgM and/or IgG and/or IgA against SARS-CoV-2. The cumulative prevalence of SARS-CoV-2 infection (presence of antibodies or past or current positive rRT-PCR) was 11.2% (65/578, 95% CI: 8.8-14.1). Among those with evidence of past or current infection, 40.0% (26/65) had not been previously diagnosed with COVID-19. Here we report a relatively low seroprevalence of antibodies among HCW at the peak of the COVID-19 epidemic in Spain. A large proportion of HCW with past or present infection had not been previously diagnosed with COVID-19, which calls for active periodic rRT-PCR testing in hospital settings.


Conflict of interest statement

The authors declare no competing interests.

Figures

Fig. 1
Fig. 1
Study participant flowchart.
Fig. 2
Fig. 2. SARS-CoV-2 antibody levels in all study participants.
Dots depict the levels (median fluorescence intensity, MFI) of IgM, IgG, and IgA against Receptor Binding Domain (RBD) of the SARS-CoV-2 Spike glycoprotein. Dashed lines indicate the seropositivity threshold calculated with pre-pandemic controls as the 10 to the mean plus 3 standard deviations of log10-transformed MFIs. The percentage of seropositive subjects is shown for each antibody isotype. Orange and burgundy dots show subjects who did not have or did have history of at least one COVID-19 compatible symptom, respectively. N = 578.
Fig. 3
Fig. 3. SARS-CoV-2 antibody levels by demographic and clinical variables.
Levels (median fluorescence intensity, MFI) of IgM, IgG, and IgA against Receptor Binding Domain (RBD) of the SARS-CoV-2 Spike glycoprotein by sex (a), age (b), symptoms (c), and duration of symptoms (d). For (ac), data are shown only for seropositive subjects for IgM (N = 36), for IgG (N = 44), and for IgA (N = 47). For (d), data are shown only for seropositive and symptomatic subjects for IgM (N = 31), for IgG (N = 40), and for IgA (N = 41). Percentages indicate the proportion of seropositive subjects within each category of the x-axis. The center line of boxes depicts the median of MFIs; the lower and upper hinges correspond to the first and third quartiles; the distance between the first and third quartiles corresponds to the interquartile range (IQR); whiskers extend from the hinge to the highest or lowest value within 1.5 × IQR of the respective hinge. Wilcoxon rank test was used to assess statistically significant differences in antibody levels between groups in (a, c and d). Spearman test was used to calculate the correlation coefficients (r) and p values (p) in (b), where the black line depicts linear regression and the blue curve represents nonlinear regression calculated using the LOESS (locally estimated scatterplot smoothing) method.
Fig. 4
Fig. 4. SARS-CoV-2 antibody levels by time since onset of symptoms in seropositive subjects.
Levels (median fluorescence intensity, MFI) of IgM, IgG, and IgA against Receptor Binding Domain of the SARS-CoV-2 Spike glycoprotein by days since onset of any symptom. Data are shown only for seropositive subjects with any symptom compatible with COVID-19 (n = 30 for IgM, 39 for IgG, and 40 for IgA). The fitting curve was calculated using the LOESS (locally estimated scatterplot smoothing) method. Shaded areas represent 95% confident intervals. One subject seropositive for the three isotypes and who started symptoms 40 days before serological testing is not shown.

References

    1. Zhu N, et al. A novel coronavirus from patients with pneumonia in China, 2019. N. Engl. J. Med. 2020;382:727–733. doi: 10.1056/NEJMoa2001017. - DOI - PMC - PubMed
    1. World Health Organization. WHO Director-General’s opening remarks at the media briefing on COVID-19-. https://www.who.int/dg/speeches/detail/who-director-general-s-opening-re... (2020).
    1. Guan, W. et al. Clinical characteristics of coronavirus disease 2019 in China. N. Engl. J. Med.10.1056/nejmoa2002032 (2020). - PMC - PubMed
    1. Day, M. Covid-19: four fifths of cases are asymptomatic, China figures indicate. BMJ m1375. 10.1136/bmj.m1375 (2020). - PubMed
    1. Sutton, D., Fuchs, K., D’Alton, M. & Goffman, D. Universal screening for SARS-CoV-2 in women admitted for delivery. N. Engl. J. Med.10.1056/NEJMc2009316 (2020). - PMC - PubMed

Publication types

MeSH terms