

COVID-19 outbreak response, a dataset to assess mobility changes in Italy following national lockdown
- PMID: 32641758
- PMCID: PMC7343837
- DOI: 10.1038/s41597-020-00575-2
COVID-19 outbreak response, a dataset to assess mobility changes in Italy following national lockdown
Abstract
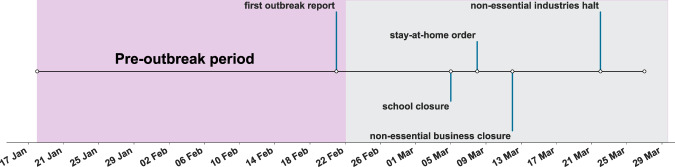
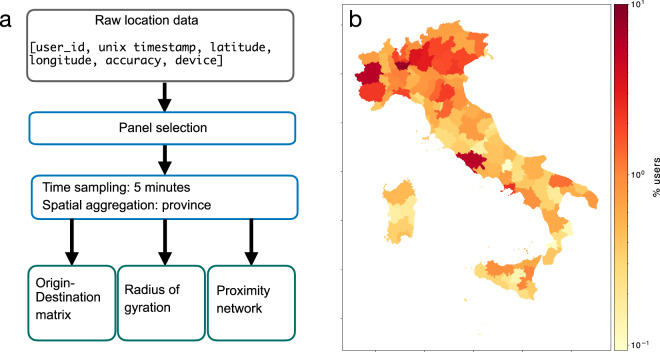
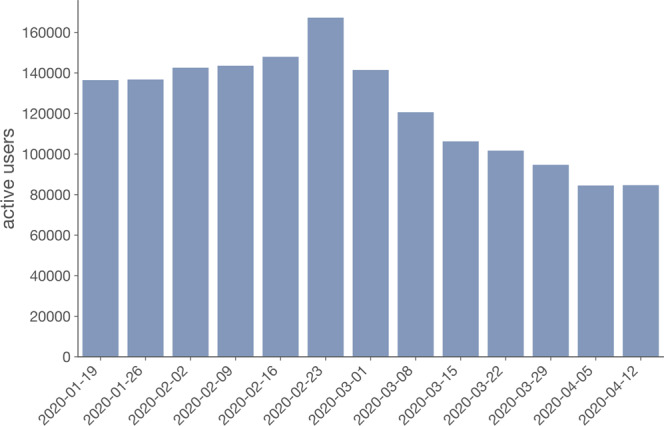
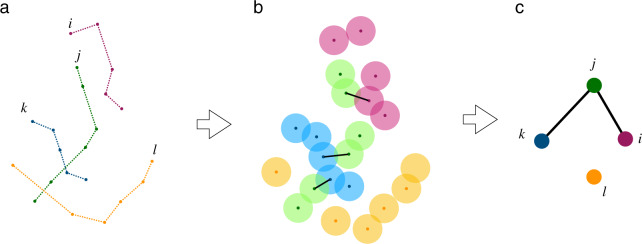
Italy has been severely affected by the COVID-19 pandemic, reporting the highest death toll in Europe as of April 2020. Following the identification of the first infections, on February 21, 2020, national authorities have put in place an increasing number of restrictions aimed at containing the outbreak and delaying the epidemic peak. On March 12, the government imposed a national lockdown. To aid the evaluation of the impact of interventions, we present daily time-series of three different aggregated mobility metrics: the origin-destination movements between Italian provinces, the radius of gyration, and the average degree of a spatial proximity network. All metrics were computed by processing a large-scale dataset of anonymously shared positions of about 170,000 de-identified smartphone users before and during the outbreak, at the sub-national scale. This dataset can help to monitor the impact of the lockdown on the epidemic trajectory and inform future public health decision making.
Conflict of interest statement
M.T. reports receiving consulting fees from GSK.
Figures
References
-
- Buckee CO, et al. Aggregated mobility data could help fight COVID-19. Science. 2020;368:145–146. - PubMed
Publication types
MeSH terms
Grants and funding
- Lagrange Project/Fondazione CRT (CRT Foundation)/International
- Lagrange Project/Fondazione CRT (CRT Foundation)/International
- Lagrange Project/Fondazione CRT (CRT Foundation)/International
- Lagrange Project/Fondazione CRT (CRT Foundation)/International
- 101003688/EC | Horizon 2020 Framework Programme (EU Framework Programme for Research and Innovation H2020)/International
LinkOut - more resources
Full Text Sources
Medical
Miscellaneous
