. 2020 Jul 8;11(1):3406.
doi: 10.1038/s41467-020-17186-5.

Single-cell RNA-seq reveals that glioblastoma recapitulates a normal neurodevelopmental hierarchy

Affiliations

Single-cell RNA-seq reveals that glioblastoma recapitulates a normal neurodevelopmental hierarchy

Charles P Couturier et al. Nat Commun. .

Erratum in

Abstract

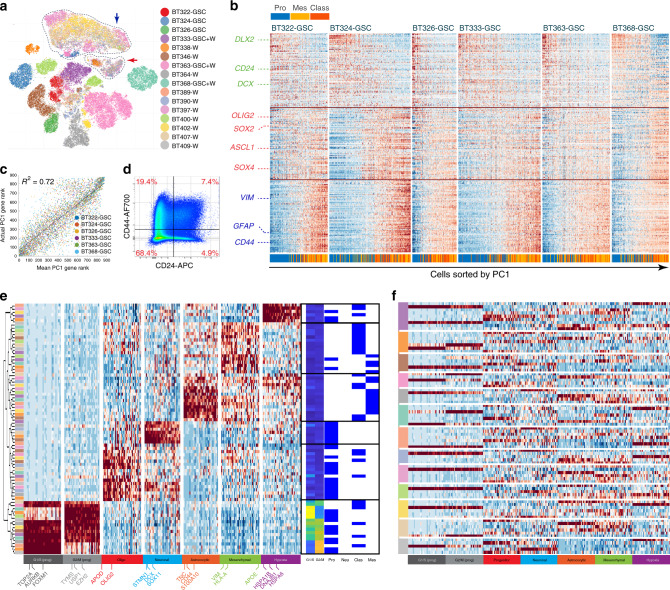
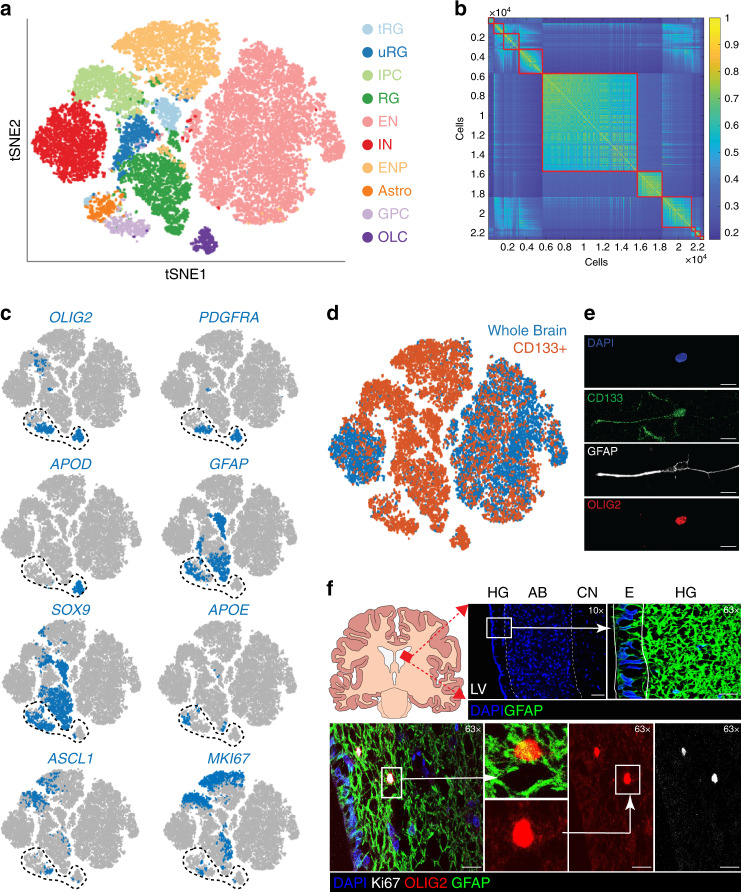
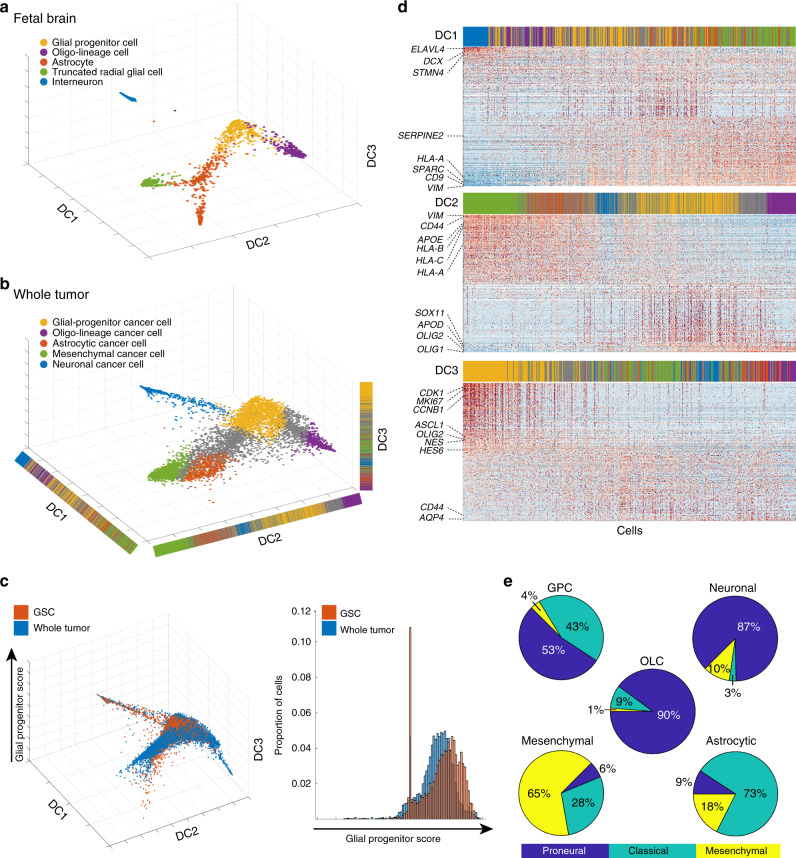
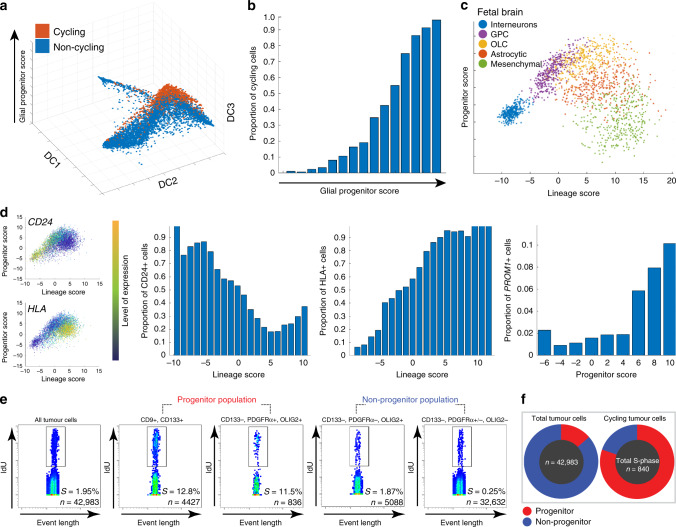
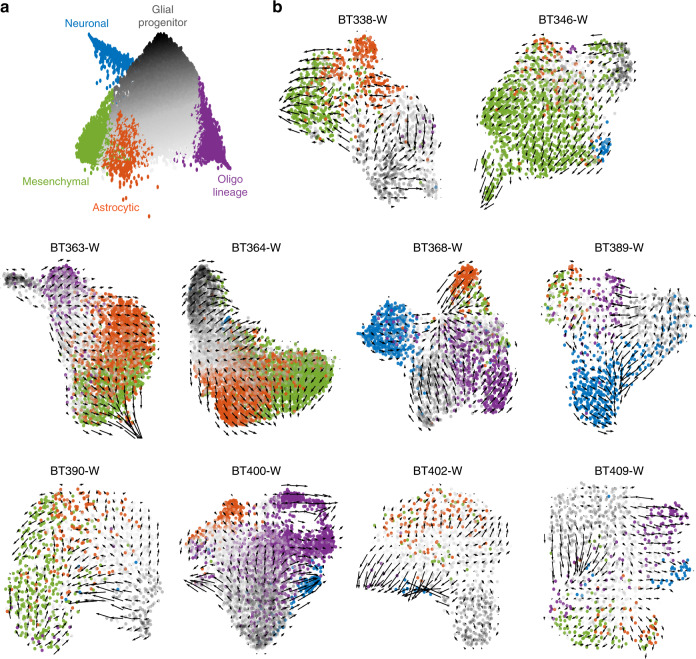
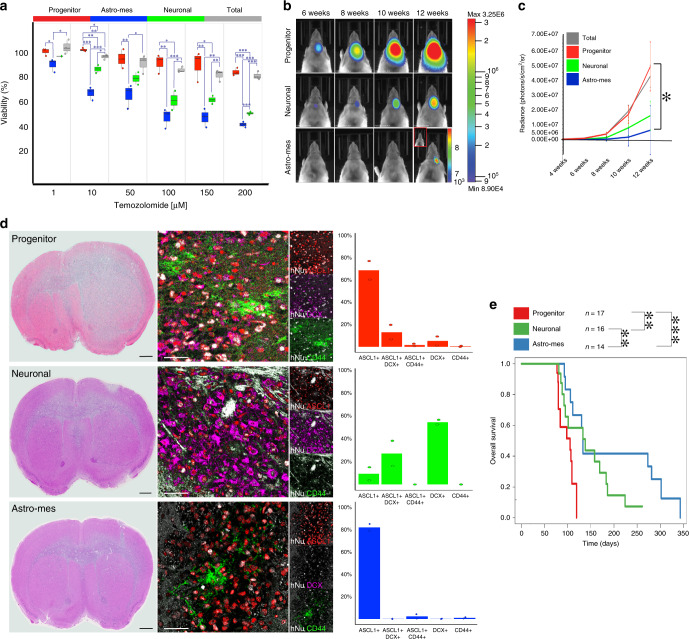
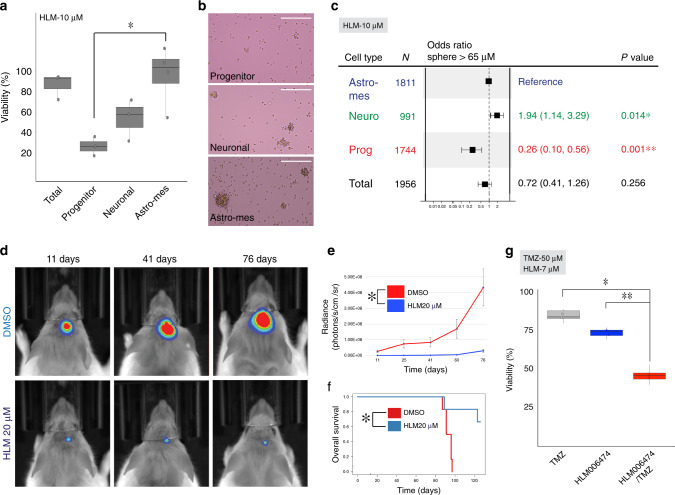
Cancer stem cells are critical for cancer initiation, development, and treatment resistance. Our understanding of these processes, and how they relate to glioblastoma heterogeneity, is limited. To overcome these limitations, we performed single-cell RNA sequencing on 53586 adult glioblastoma cells and 22637 normal human fetal brain cells, and compared the lineage hierarchy of the developing human brain to the transcriptome of cancer cells. We find a conserved neural tri-lineage cancer hierarchy centered around glial progenitor-like cells. We also find that this progenitor population contains the majority of the cancer's cycling cells, and, using RNA velocity, is often the originator of the other cell types. Finally, we show that this hierarchal map can be used to identify therapeutic targets specific to progenitor cancer stem cells. Our analyses show that normal brain development reconciles glioblastoma development, suggests a possible origin for glioblastoma hierarchy, and helps to identify cancer stem cell-specific targets.


Conflict of interest statement

The authors declare no competing interests.

Figures

Fig. 1
Fig. 1. Single-cell RNA sequencing highlights transcriptomic heterogeneity in glioblastoma and glioblastoma stem cells.
a tSNE of location-averaged transcriptome for all tumor cells colored by patient. Cancer cells cluster by patient, whereas normal cells from all patients cluster together (encircled clusters indicated by arrows). GSC corresponds to glioma stem cell samples, W corresponds to whole samples. b Enriched glioblastoma stem cell (GSC) gene expression heatmaps showing relative gene expression (raw data) sorted by PC1 per patient. These maps are separated into three rows: top row—100 genes with the lowest value for PC1 loading; bottom row—100 genes with the highest value for PC1 loading; middle row—100 genes with the highest value for PC2 loading. These gene signatures correspond to neuronal, astrocytic, and progenitor signatures, respectively. The TCGA subtype is also shown for each GSC. c Mean and actual rank of genes by PC1 correlation. The actual gene rank (y axis, one point per sample) correlates strongly with the mean gene rank (x axis) in all patients. d Flow cytometry analysis of GSCs and whole-tumor, demonstrating mutually exclusive expression of CD24 and CD44. e Heatmap of gene expression by cNMF signature with associated cell cycle scores and TCGA subtype (right). The most characteristic genes for each signature group are depicted on the x axis. Signatures (y axis) are ordered according to hierarchical clustering (left tree). Left color bar represents the patient sample that generated each signature—patient colors match those in Fig. 1a. Red represents high expression; blue represents low expression. Gene signatures groupings correspond to progenitors, astro-glia (mesenchymal and classical), and neurons, with the addition of cell cycle and hypoxia signatures. cNMF—clustered non-negative matrix factorization. f Heatmap of gene expression by signature ordered by patient as shown by the left color bar. Genes (x axis) are in the same order as Fig. 1e. Patient colors in the color bar match those in Fig. 1a, e. Each patient contains signatures from multiple groups.
Fig. 2
Fig. 2. Single-cell RNA sequencing of the developing brain and the identification of glial progenitor cells.
a T-distributed stochastic neighbour embedding (tSNE) map of human fetal brain cells by cluster or cell type. Data sets from total cells and CD133+ cells were combined. Cells are colored by cell type. tRG truncated radial glia, uRG unknown radial glia, IPC inhibitory neuronal progenitor, RG radial glia, EN excitatory neuron, IN interneuron, ENP excitatory neuronal progenitor, Astro astrocyte, GPC glial progenitor cell, OLC oligo-lineage cells. b Similarity matrix of fetal brain cells ordered by cluster. c tSNE maps of human fetal brain cells showing cell type expression of OLIG2, PDGFRA, APOD, GFAP, SOX9, APOE, ASCL1, and MKI67. Expression is averaged to the 20 closest neighbors in principal component (PC) space. Encircled cells were reclustered to yield three separate clusters. d tSNE map of total human fetal brain cells and CD133+ fetal brain cells. e Representative example of freshly cultured fetal neural stem cells coexpressing CD133, OLIG2, and GFAP (n = 2 independent biological samples). Images were taken at ×63 magnification. Scale bars: 10 μm f Immunofluorescence analysis of the adult human subventricular zone (SVZ) at the junction of the AB and HG. Top row, schematic and anatomic structure of the SVZ. Bottom row, identification of dividing cells with marker expression corresponding to glial progenitor cells. HG hypocellular gap, AB astrocytic band, E ependymal cells, LV lateral ventricle, CN caudate nucleus. Analysis was performed in n = 4 independent patient samples. Scale bars: top row images: 200 μm (left) and 40 μm (right); bottom row images: 20 μm.
Fig. 3
Fig. 3. Fetal brain roadmap reveals a glioblastoma trilineage hierarchy centered on progenitor cancer cells.
a Diffusion plot of the projection of selected fetal cell types onto the roadmap. Cells are colored by the cell type they were attributed in Fig. 2a. b Diffusion plot of the projection of an equal number of whole-tumor cancer cells from each patient onto the roadmap. Cells are colored based on their classification by linear discriminant analysis (LDA). Unclassified cells were colored gray. c Diffusion plot showing the location of glioma stem cells (GSCs) relative to whole-tumor cells (left) and histogram of glial progenitor score for GSCs and whole-tumor cells (right). An increase in proportion of cells with higher glial progenitor scores is seen in GSCs (p < 1e-21, two-sample Kolmogorov–Smirnov test). Only samples with paired GSC and whole-tumor data were used here. d Heatmaps showing relative gene expression (raw data) for cells ordered by each of the diffusion components of the roadmap. Genes are ordered from most correlated to least correlated with the diffusion component. The 200 most and 200 least correlated genes are shown. Top color bar indicates cell type classification from the LDA. Each color corresponds to the same classification as in b. e Pie chart for TCGA subtype by cell type for a subset of 1000 cells. Cell types are based on the LDA classification for all whole-tumor cells. and TCGA subtype was obtained using Gliovis (see Methods).
Fig. 4
Fig. 4. Progenitor cancer cells are the most proliferative cancer cells.
a Diffusion plot of the roadmap of whole-tumor cancer cells showing that cycling cells are predominantly glial progenitor cancer cells. Cycling cells are defined by >1.5 in either the G1/S or G2/M scores. b Bar chart showing that the proportion of cycling cells increases with increasing glial progenitor score. c Simplified roadmap in principal component space with select fetal brain cell types. Projected OLCs and GPCs overlap and are high for progenitor score, whereas interneurons, and tRG/astrocytes are lower in progenitor score, but occupy opposite ends of the lineage score. d Projection of glioma stem cells (GSCs) on the simplified roadmap highlights the location of CD24 and HLA within the hierarchy. For each gene, the simplified roadmap projection shows the expression of this gene in GSCs, and the histograms show the proportion of cells where CD24, HLA, and PROM1 (CD133) were detected at differing positions in the hierarchy. e Mass cytometry pseudo-color dot-plots showing the proportion of whole-tumor cells, progenitor cancer cells, and non-progenitor cells that are in S-phase. The progenitor cancer cell population has the highest proportion of cells in S-phase (box). f Mass cytometry showing that progenitor cancer cells are the main cycling cell population in the tumor. Pie charts showing the proportion of progenitor cells (CD133+, OLIG2+, PDGFRA+) in the tumor (left) and the cycling population (right).
Fig. 5
Fig. 5. RNA velocity supports conserved hierarchical dynamics in glioblastoma.
a Diffusion roadmap schematic for all whole-tumor samples where progenitor cells and unclassified cells were colored according to a grayscale: cells scoring higher on the progenitor axis are darker. b Velocity field superimposed to the UMAP embedding of cells by sample. Cells are colored by cell type according to a. UMAP uniform manifold approximation and projection.
Fig. 6
Fig. 6. Progenitor cancer cells are drivers of chemoresistance and tumor growth.
a Box–whisker plots showing the proportion of viable glioma stem cells (GSCs, n = 1 patient: BT390-GSC) sorted by type and followed by 5 days of temozolomide (TMZ) treatment, normalized to corresponding vehicle control. See Supplementary Fig. 5e for additional patients. Three technical replicates and three biological replicates were performed per condition. Box plot represents the first quartile, median, and third quartile with whiskers corresponding to 1.5 times the interquartile range. The overlaid dot-plots represent the mean value per biological replicate per group. A one-tailed, two-sample equal variance t test was used. b Select bioluminescence images from mice implanted with GSCs sorted by type. Mice implanted with progenitor GSCs exhibit a more rapid tumor growth compared with those implanted with neuronal or astrocytic GSCs. c Average bioluminescence intensity over time for mice xenografts injected with different GSC types sorted from BT333-GSC (n = 24). Data are represented as mean ± SE. p values obtained with two-tailed, two-sample t tests. d Mice from each GSC group was killed at 12 weeks and the corresponding H&E and immunofluorescence images for cell type markers are shown. Expression of cell type-specific markers was quantified from ~1000 to ~3000 human nucleoli (hNu)-positive cells per mouse model group. Each graph represents n = 2 biologically independent mouse brain sections. Scale bars: whole mount images: 1 mm; immunofluorescence images: 50 μm. e Kaplan–Meier survival curves for mice implanted with different GSC types (n = 47). Univariate Cox proportional Hazard Model (two-sided) shows a significant difference in survival between progenitor GSC and neuronal (p value = 0.0025) or astrocytic GSC (p value = 5.7e-6) xenografts, and also between neuronal and astrocytic GSC xenografts (p value = 0.0059). For all plots, ***p < 0.001, **p < 0.01, *p < 0.05.
Fig. 7
Fig. 7. Pathways enriched in progenitor cancer cells expose therapeutic opportunities.
a Bar-graph showing the proportion of viable glioma stem cells (GSCs, BT333-GSC) sorted by type followed by 7 days of HLM006474 treatment, with each cluster normalized to corresponding vehicle control. Each bar in the graph represents the average of n = 3 biological replicates treated with HLM006474 as a ratio of the average of n = 3 DMSO-treated biological replicates. Data represented as mean±SE. A one-tailed, two-sample equal variance t test was used. b Representative images of GSCs at ×10 magnification (brightfield), sorted by type and treated in HLM006474 for 7 days (images correspond to 7a). n = 2 biologically independent sphere forming experiments were performed. Scale bar: 400 μm. c Forest plot showing the odds ratio of forming a tumor sphere >65 mm following 7 days of HLM006474 treatment, calculated using a multivariate logistic regression with the astrocytic GSC type as a reference, controlled for patient cell line. There was no significant difference between the two GSC lines (p > 0.2), odds ratio with 95% confidence intervals are shown. d Bioluminescence images and e signals from representative mice treated with 20 mm HLM006474 vs DMSO with corresponding f Kaplan−Meier survival plot (n = 16, eight per group). Data are represented as mean±SE. g Box−whisker plot showing the proportion of viable unsorted GSCs (BT326-GSC) after one of the following treatments: 6 days of TMZ treatment, 6 days of HLM006474 treatment, or 3 days of HLM006474 treatment followed by 3 days of TMZ treatment, normalized to corresponding vehicle control. n = 2 biological replicates per treatment. Box plot represents the first quartile, median, and third quartile with whiskers extending to 1.5 times the interquartile range. The overlaid filled dot-plots represent the mean value per biological replicate per group. P values: TMZ/HLM, 0.004; HLM/combination, 0.01. For all plots, **p < 0.01, *p < 0.05.

References

    1. Meacham CE, Morrison SJ. Tumour heterogeneity and cancer cell plasticity. Nature. 2013;501:328–337. - PMC - PubMed
    1. Burrell RA, McGranahan N, Bartek J, Swanton C. The causes and consequences of genetic heterogeneity in cancer evolution. Nature. 2013;501:338–345. - PubMed
    1. Jamal-Hanjani M, et al. Tracking the evolution of non–small-cell lung cancer. N. Engl. J. Med. 2017;376:2109–2121. - PubMed
    1. Hunter, K.W., Amin, R., Deasy, S, Ha, N.-H. & Wakefield, L. Genetic insights into the morass of metastatic heterogeneity. Nat. Rev. Cancer18, 211–223 (2018). - PMC - PubMed
    1. Cavalli FMG, et al. Intertumoral heterogeneity within medulloblastoma subgroups. Cancer Cell. 2017;31:737–754, e6. - PMC - PubMed

Publication types

MeSH terms

Substances