. 2020 Jul;583(7816):441-446.
doi: 10.1038/s41586-020-2474-7. Epub 2020 Jul 8.

Microbiota modulate sympathetic neurons via a gut-brain circuit

Affiliations

Microbiota modulate sympathetic neurons via a gut-brain circuit

Paul A Muller et al. Nature. 2020 Jul.

Erratum in

Abstract

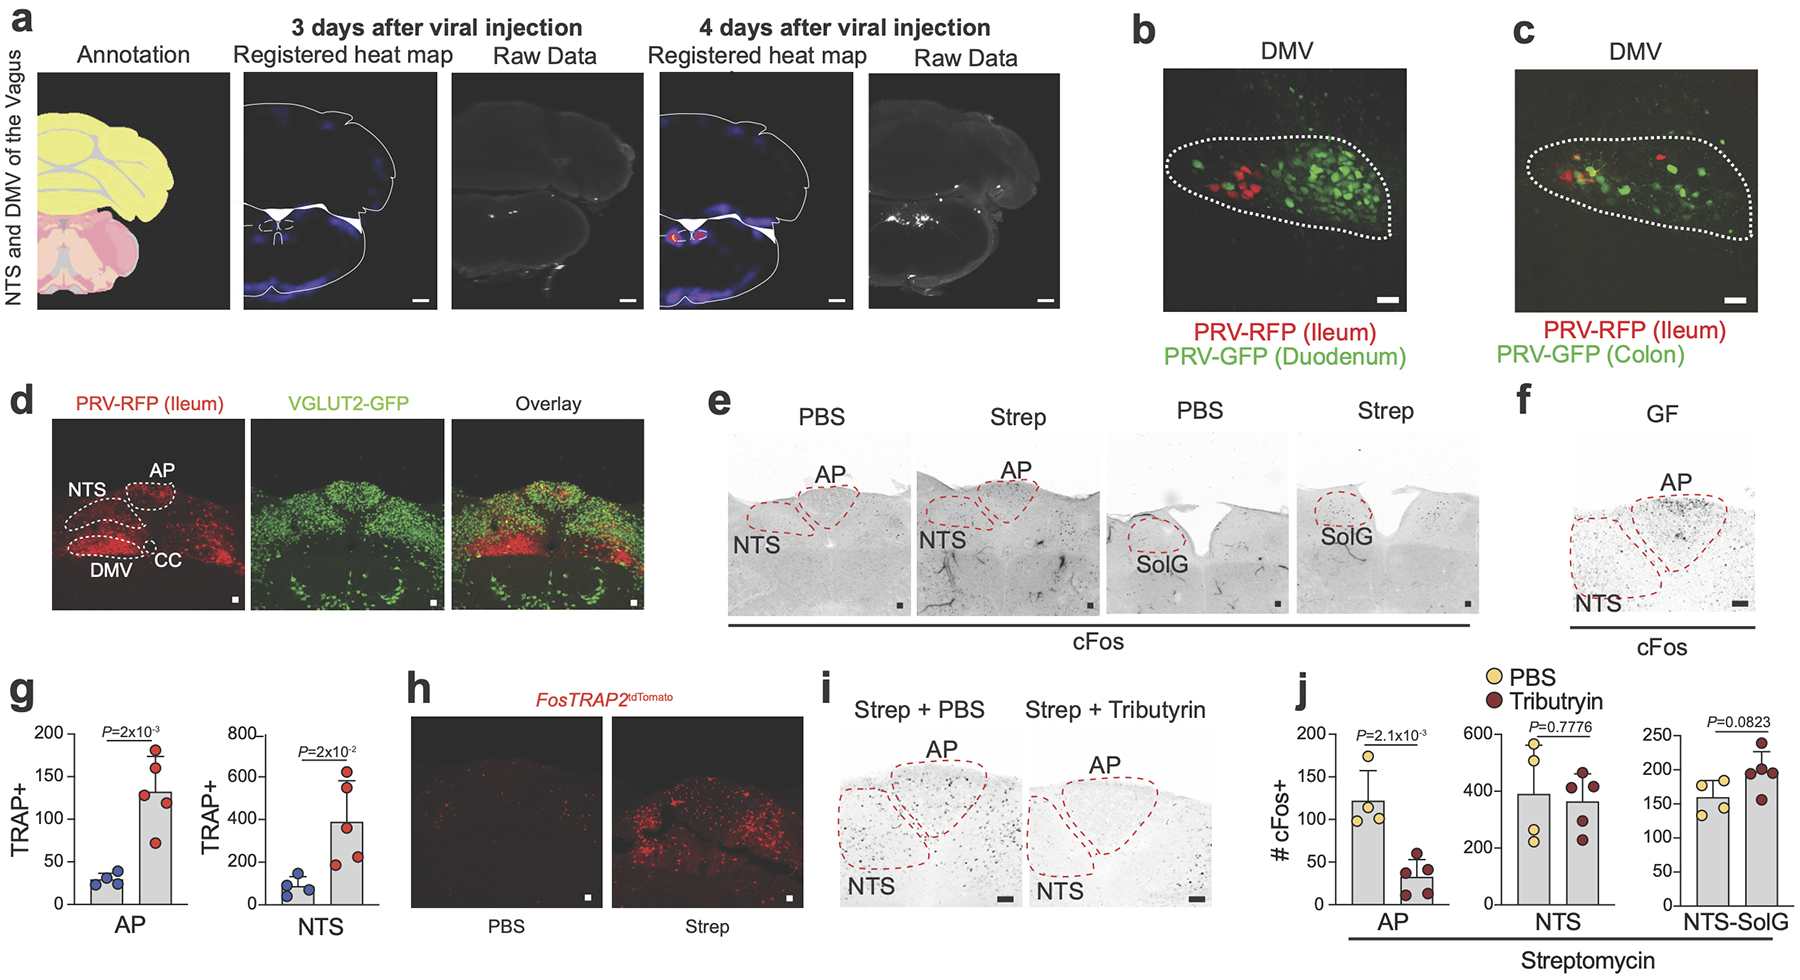
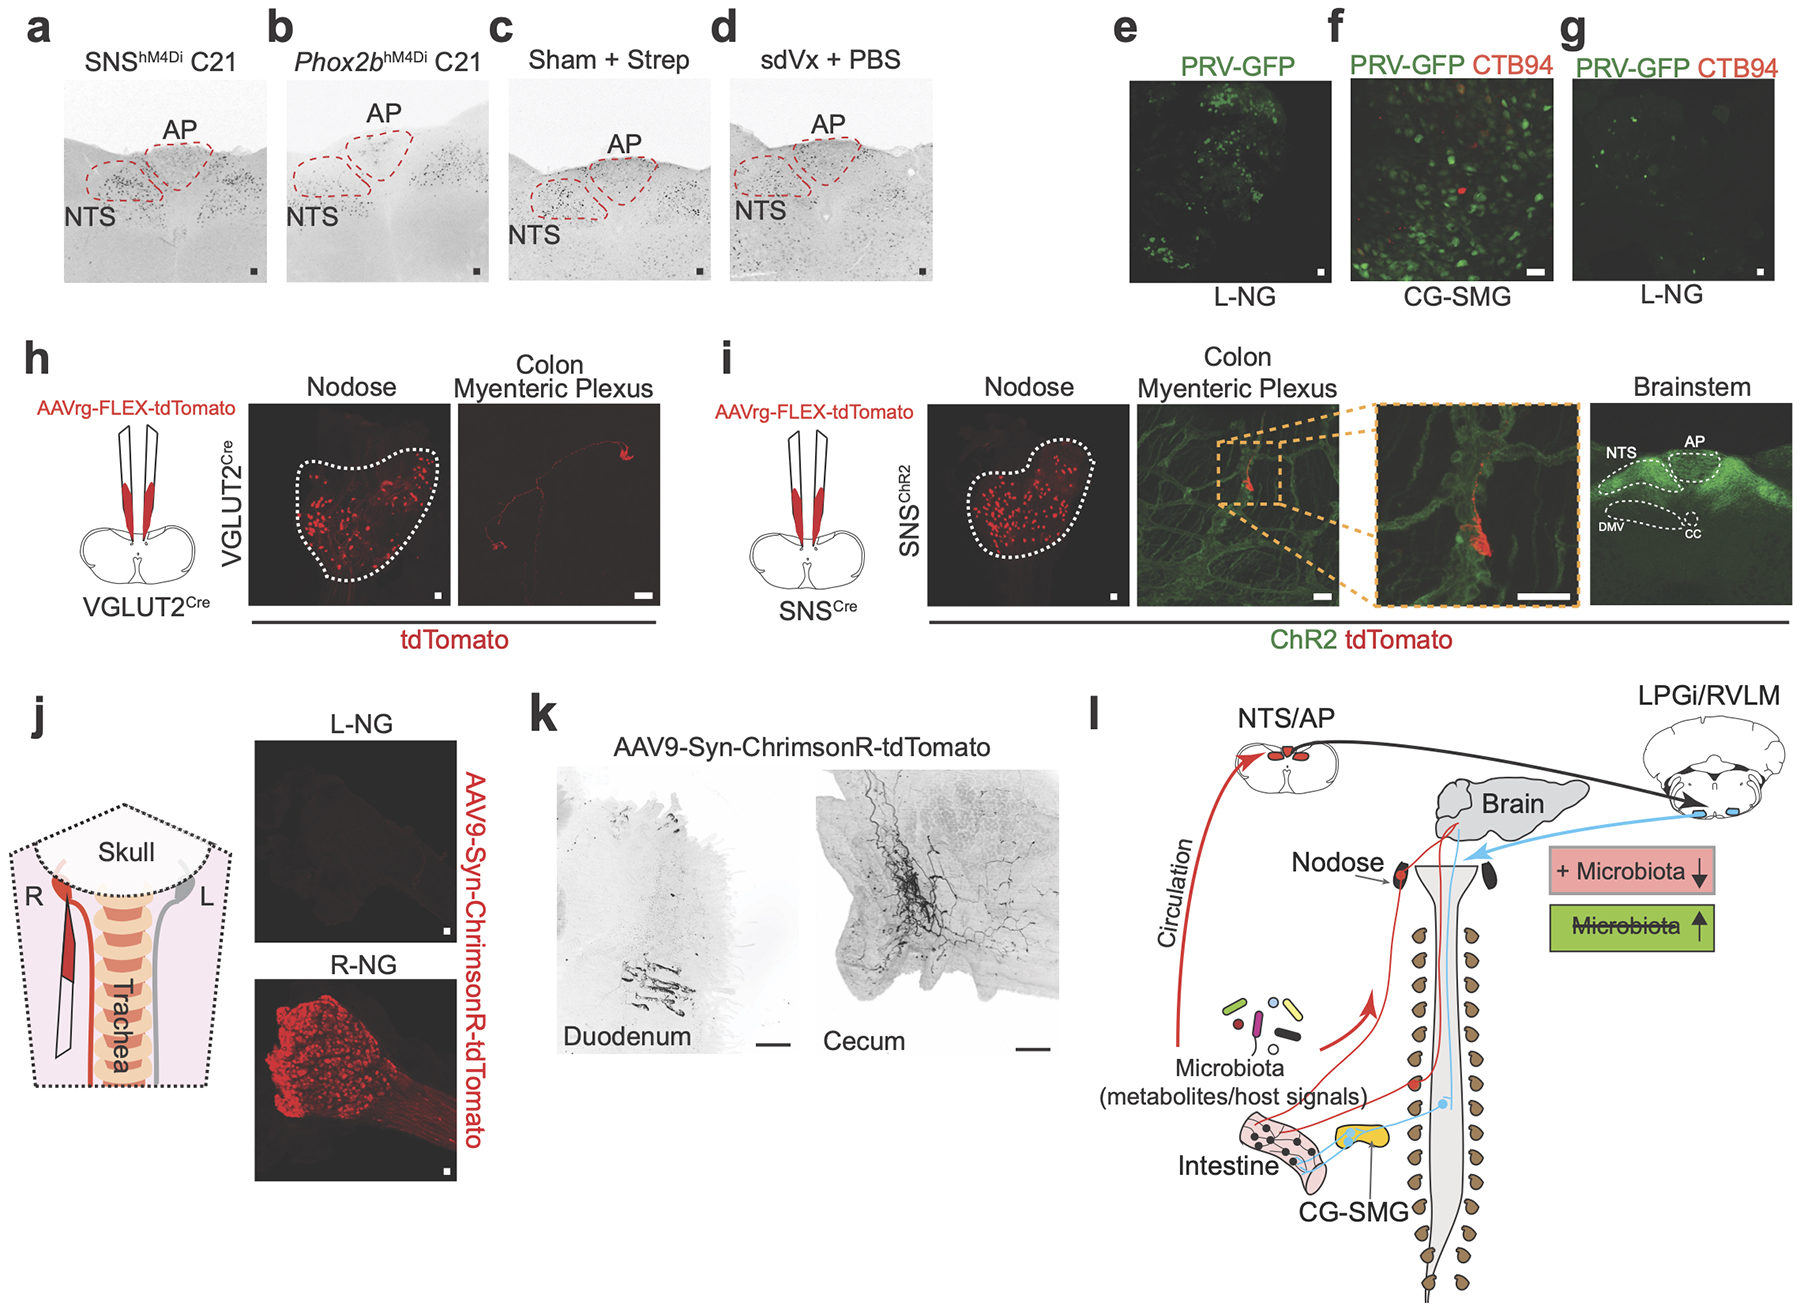
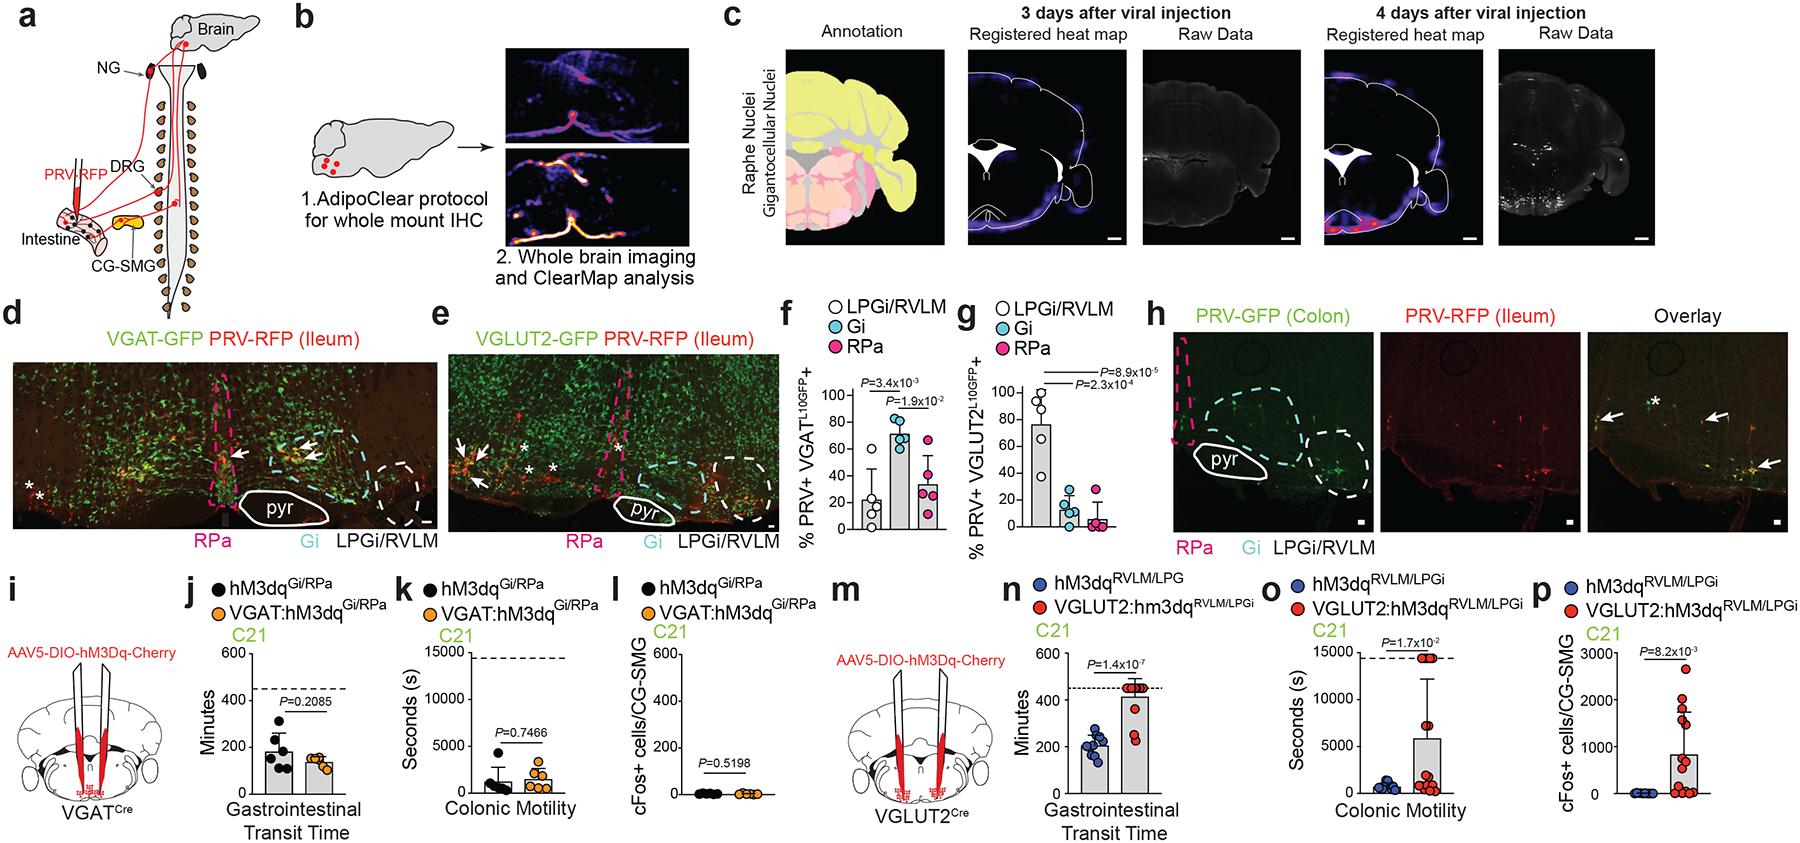
Connections between the gut and brain monitor the intestinal tissue and its microbial and dietary content1, regulating both physiological intestinal functions such as nutrient absorption and motility2,3, and brain-wired feeding behaviour2. It is therefore plausible that circuits exist to detect gut microorganisms and relay this information to areas of the central nervous system that, in turn, regulate gut physiology4. Here we characterize the influence of the microbiota on enteric-associated neurons by combining gnotobiotic mouse models with transcriptomics, circuit-tracing methods and functional manipulations. We find that the gut microbiome modulates gut-extrinsic sympathetic neurons: microbiota depletion leads to increased expression of the neuronal transcription factor cFos, and colonization of germ-free mice with bacteria that produce short-chain fatty acids suppresses cFos expression in the gut sympathetic ganglia. Chemogenetic manipulations, translational profiling and anterograde tracing identify a subset of distal intestine-projecting vagal neurons that are positioned to have an afferent role in microbiota-mediated modulation of gut sympathetic neurons. Retrograde polysynaptic neuronal tracing from the intestinal wall identifies brainstem sensory nuclei that are activated during microbial depletion, as well as efferent sympathetic premotor glutamatergic neurons that regulate gastrointestinal transit. These results reveal microbiota-dependent control of gut-extrinsic sympathetic activation through a gut-brain circuit.


Conflict of interest statement

Competing interests

The authors declare no competing financial interests.

Figures

Extended Data Figure 1 |
Extended Data Figure 1 |. Comparison of extrinsic EAN organization.
a, Number of CTB+ neurons per left (L) and right (R) (n=5 ganglia from independent mice) nodose ganglion (NG) of C57BL/6J SPF mice injected with CTB555 into the cecum. b, Number of CTB+ neurons per CG-SMG of mice injected with CTB555 into the cecum (n=4 ganglia from independent mice). c, Retrograde CTB tracing from intestinal segments to the DRG Th10. Images representative of duodenum (n=3 averaged pairs of ganglia from independent mice), ileum (n=3 averaged pairs of ganglia from independent mice), and proximal colon (n=3 averaged pairs of ganglia from independent mice). d, (Left) Scheme showing retrograde tracing to the DRG. (Right) Distribution of labelled neurons in the DRG of mice injected with CTB555 in the duodenum (n=3 averaged pairs of ganglia from independent mice), ileum (n=3 averaged pairs of ganglia from independent mice), proximal colon (n=3 averaged pairs of ganglia from independent mice), and mid-distal colon (n=2 averaged pairs of ganglia from independent mice). e, (Left) Number of CTB+ neurons and (right) representative images of individual superior cervical (n=10 ganglia from 7 mice) and stellate (n=8 ganglia from 4 mice) ganglia of mice injected with CTB647 in the ileum and proximal colon. f, Loop of distal ileum from sham-operated and locally denervated (DNx) mice. Representative of n=7 mice. g, Representative R-NG of mice injected with CTB594 into the distal ileum of sham (n=7 ganglia) or DNx mice (n=6 ganglia). h, Number of CTB+ neurons in the CG-SMG and NG of sham (L-NG, n=5 ganglia; R-NG, n=7 ganglia; CG-SMG, n=5 ganglia) or DNx mice (L-NG, n=5 ganglia,; R-NG, n=7 ganglia; CG-SMG, n=4 ganglia) injected with CTB594/647 in the distal ileum. i, Image of NG of mice injected with CTB488 into the jejunum (n=2 mice). j, Anatomical verification of subdiaphragmatic vagotomy (sdVx) showing (top) enlarged stomach and (bottom) successful severing of the vagal nerves below the diaphragm. Images representative of n= 10 mice. k, Immunofluorescence images of NG from sham or sdVx mice 3 days after i.p. FluoroGold injection (native fluorescence). Images representative of n= 5 ganglia. l, Immunofluorescence images of NG from sham or sdVx mice injected with CTB488 in the stomach. Images representative of n=5 ganglia. m, Immunofluorescence images of NG from sdVx mice injected with CTB488 in the ileum/proximal colon or sham mice injected with CTB488 in the proximal colon. Images representative of n=2 ganglia. n, Dual CTB tracing in the Th9 DRG from the duodenum (green arrows) and ileum (red arrows). Representative of n=3 mice. o-q, Dual CTB tracing in the CG-SMG and NG from the: (o) duodenum (green arrows) and ileum (red arrows); (p) spleen (green arrows) and distal colon (red arrows); (q) duodenum and stomach (white arrows indicate dual labelled neurons). Images representative of n=3 ganglia from independent mice. c,e,g,i,k-q, Scale bars = 50μm. a,b,d,e,h, Mean ± s.d. a,h, Two-tailed unpaired t-test. g,i,k,l, Dashed lines highlight the NG. m-q, Arrows indicate CTB+ cells.
Extended Data Figure 2 |
Extended Data Figure 2 |. Microbial depletion leads to changes in extrinsic EAN.
a, Immunofluorescence images of the nodose ganglion (NG), CG-SMG, and dorsal root ganglion (DRG) from Snap25RiboTag SPF mice using anti-hemagglutinin (HA, in green) antibody and NeuroTrace (red). Images representative of n=4. b, Immunofluorescence images of the NG, CG-SMG, and DRG from Snap25RiboTag mice GF mice using anti-hemagglutinin (HA, in green) antibody and NeuroTrace (red). Images representative of n=2. c-e, Volcano plots of differentially expressed genes by (c) NG and Th9 DRG, (d) Th9 DRG and CG-SMG, and (e) NG and CG-SMG of Snap25RiboTag SPF mice. f-h, Immunofluorescence images of CG-SMG from (f) C57BL/6J SPF mice using anti-TH (green) and anti-NPY (red), (g) ChattdTomato mice using anti-cFos (red) antibody and native tdTomato fluorescence (green), and (h) C57BL/6J SPF mice using anti-TH (green) and anti-SST (red) antibodies. Images representative of n=3 ganglia. i, Volcano plots of differentially expressed genes by Th9 DRG from GF and SPF Snap25RiboTag mice. Red/blue dots = log2 fold change > 0.5. Italicized parentheses = log2 fold change > 1. j, Immunofluorescence images of the CG-SMG from C57BL/6J SPF mice 3 days after i.p. FluoroGold injection (native fluorescence). Dotted line outlines the FluoroGold+ signal. Image representative of n=4 ganglia. k, Immunofluorescence images of CG-SMG from acutely stressed C57BL/6J SPF mice 3 days after i.p. FluoroGold injection using with anti-cFos (red) antibody and native FluoroGold fluorescence. Image representative of n=4 ganglia. l, Immunofluorescence images of CG-SMG from acutely stressed C57BL/6J SPF mice stained for cFos (white). White arrows indicate neuronal cFos+ nuclei, red arrows indicate non-neuronal cFos+ nuclei. Scale bar = 10 μm. Image representative of n=4 ganglia. m,n, (m) Most abundant bacterial genera and (n) Shannon diversity index in 16S sequencing of cecal samples from 24 hours post PBS- (n=5) and streptomycin- (n=5) treated C57BL6/J mice as determined by the phyloseq R package. a, b, f-h, j, k, l, Scale bars = 50 μm. g, Arrows indicate cFos+ cells and stars indicate tdTomato+ cells. c-e, i, Number (n) of independent biological samples analysed are indicated in parentheses. c-e, Red/blue dots = log2 fold change > 3. c-e, i, padj = two-tailed Benjamini and Hochberg test p-value of two-sided Wald test p-value < 0.05.
Extended Data Figure 3 |
Extended Data Figure 3 |. Effects of modulation of SCFAs on gut sympathetic neurons.
a-f, Quantification of SCFA in the cecal contents of (a) VAMN- (n=5) and Splenda- (n=5) treated C57BL/6J mice, (b) PBS- (n=5) and strep- (n=5) treated C57BL/6J mice, (c) single antibiotic- (n=5 for each antibiotic) and Splenda- (n=5) treated C57BL/6J mice, (d) C57BL/6J GF mice (n=3) colonized with ASF (n=2) or Clostridium consortium (n=4), (e) C57BL/6J GF (n=5), GF mice monocolonized with SFB (n=5), or SPF (n=5) mice and (f) GF mice (n=5), SPF mice (n=5), GF mice colonized with A. muciniphilia (n=3), B. fragilis (n=3), or OligoMM12 (n=4). g, Cecal weight of SPF (n=6) and OligoMM12 (n=14) mice. h, Dissected cecum (in 6 well cell culture plate) images from mice treated with Splenda, ampicillin, neomycin, vancomycin, or metronidazole for 2 weeks. Each representative of n=5 ceca from separate mice. i, Number of cFos+ neurons in the CG-SMG of C57BL/6J mice treated with methylcellulose (n=5) or mannitol (n=5). j, Number of Salmonella colony-forming-units (CFU) per mg of faeces of Salmonella-infected CBA/J mice (n=5), compared to luria broth (LB)-gavaged control mice (n=5). k, Number of cFos+ neurons in the CG-SMG of CBA/J mice orally inoculated with Salmonella (n=10) or given oral gavage of luria broth (n=10). Dashed line indicates average number of cFos+ neurons for antibiotic treated mice (320). l, Quantification of SCFA in the cecal contents of CBA/J mice orally inoculated with Salmonella (n=4) or given oral gavage of LB (n=5). m, Number of cFos+ neurons in the CG-SMG of (m) C57BL/6J SPF mice 24 hours post oral gavage with strep and treated with SCFA-supplemented or sodium-containing water, (n) C57BL/6J SPF mice treated with intracerebroventricular (i.c.v.) artificial cerebrospinal fluid (aCSF) (n=5) or SCFA in aCSF (n=4) post strep treatment, (o) C57BL/6J GF mice 24 hours post-treatment with tributyrin (n=5) or PBS (n=5), (p) C57BL/6J SPF mice treated with tributyrin (n=7) or PBS (n=6) 24 hours post oral gavage of streptomycin, (q) CBA/J SPF mice treated with tributyrin (n=5) or PBS (n=5) 24 hours post oral gavage of streptomycin. r, Quantification of SCFA in cecal samples of GF mice given consecutive oral gavage of PBS (n=2) or Tributyrin (n=3). s, Cecal weight of mice given oral gavage of streptomycin followed by treatment with PBS (n=5) or Tributyrin (n=5). t-v, Number of cFos+ neurons in the CG-SMG of (r) Gpr109a–/– (n=3) and littermate control Gpr109a+/– mice (n=3), (s) Gpr109a–/–Gpr43–/– mice (n=8), (t), Gpr41–/– and littermate control Gpr41+/+ mice. a-f, g, i-t Mean ± s.d. a, b, d, g, i, k-q, s-v, Two-tailed unpaired t-test. c, e, f, One-way ANOVA with Tukey’s multiple comparisons. a-d, j, Dashed line indicates lowest limit of detection. r-t, Dashed line indicates average number of cFos+ neurons/CG-SMG for GF mice (334).
Extended Data Figure 4 |
Extended Data Figure 4 |. Effects of microbe-modulated host factors on sympathetic activation and gut motility.
a, Number of cFos+ neurons in the CG-SMG of C57BL/6J mice treated with cholestyramine after oral gavage of PBS (n=5) or streptomycin (n=5). b, Number of cFos+ neurons in the CG-SMG of C57BL/6J mice with bile duct cauterization after oral gavage of PBS (n=3) or streptomycin (n=4). c, Agarose gel image of recombination PCR analysis of colon samples. Lower bands correspond to recombined allele in tamoxifen-treated VilTph1fl/fl (n=3) mice, compared to VilCreERT2- (n=3) control mice. d, 5-HT concentration in colonic tissues from VilΔTph (n=5), VilTph1fl/+ (n=7), and VilCreERT2- (n=7) mice 2 weeks post-tamoxifen injection. e, f, (e) Gastrointestinal transit time and (f) Number of cFos+ neurons in the CG-SMG of VilΔTph (n=5) or control mice (n=8) two weeks post-tamoxifen injection. g-i, (g) Number of cFos+ neurons in the CG-SMG, (h) colonic motility and (i) gastrointestinal transit time of C57BL/6J mice 4 hours post i.p. injection of Exendin-4 (n=5) or saline (n=5). j, Gastrointestinal transit time of C57BL/6J mice 5 minutes post i.p. injection of Exendin-4 with saline (n=10) or guanethidine (n=9). k, Number of cFos+ neurons in the CG-SMG of C57BL/6J mice 4 hours post i.p. injection of saline (n=5) or Exendin (9–39) (n=5) and 24 hours post streptomycin treatment. l, Number of cFos+ neurons in the CG-SMG of Glp1r–/– mice treated for 2 weeks with broad spectrum antibiotics (VAMN, n=5) or Splenda (n=4) in drinking water. m, n, Number of cFos+ neurons in the CG-SMG of C57BL6/J mice (m) 4 hours post i.p. injection of saline (n=5) or PYY (50 mg/kg) (n=5) or (n) 4 hours post i.p. injection of saline (n=5) or PYY (50 mg/kg) (n=5) in mice treated with streptomycin 24 hours prior. a, b, d-n, Mean ± s.d. a, b, e-n, Two-tailed unpaired t-test. d, One-way ANOVA with Tukey’s multiple comparisons. e, h-j, Dashed line indicates maximum time allowed per animal for each motility measurement. f, g, l, m, Dashed line indicates average number of cFos+ neurons/CG-SMG for antibiotic treated mice (320).
Extended Data Figure 5 |
Extended Data Figure 5 |. CG-SMG activation unlikely requires direct sensing of microbes or viscerofugal input.
a-d, AAVrg-CAG-FLEX-tdTomato injection into the CG-SMG of Snap25Cre mice for tracing of fibres in the intestine. a, (Left) Scheme and (right) Immunofluorescence images of the CG-SMG using anti-TH (green) antibody and native tdTomato fluorescence (red). Image representative of n=2. b, Light-sheet 3D reconstruction and optical section of the (left) colon or (right) cecum. (Left) Scale bars= 300 μm (left image) and 200 μm (right image). (Right) Scale bars = 500 μm (left image) and 200 μm (right image). Images representative of n=3. c, Immunofluorescence images of the (top) ileum and (bottom) colon myenteric plexus using anti-TH (green) antibody and native tdTomato fluorescence (red). Image representative of n=2. d-f, AAVrg-hSyn1-Cre injection into the CG-SMG of Rosa26lsl-tdTomato mice for tracing of fibres in the intestine. d, (Left) Scheme and (right) immunofluorescence image of the CG-SMG using native Tomato fluorescence (red). Image representative of n=2. e, Immunofluorescence image of the ileum myenteric plexus using native Tomato fluorescence (red). Image representative of n=2. f, Immunofluorescence image of the ileum villi using anti-TH(green) antibody and native Tomato fluorescence (red). Image representative of n=2. g, Immunofluorescence stitched images of the colon myenteric plexus from C57BL/6J mice treated with 6-OHDA using anti-TH (red) antibody. Dashed lines indicate mesenteric border. Scale bar = 500 μm. Image representative of n=10. h, Number of cFos+ neurons in the CG-SMG of C57BL/6J mice treated with 6-OHDA before PBS (n=5) or streptomycin (n=5) treatment. i, Transcripts per million (TPM) as calculated by Kallisto alignment for Ffar3 expression by CG-SMG neurons isolated from SPF (n=3) and GF (n=3) Snap25RiboTag mice (TRAPseq analyses). j, Immunofluorescence image of the CG-SMG from C57BL/6J mice i.p. injected with Tributyrin using anti-cFos antibody. Image representative of n=4. k, (Left) Scheme representing injection of CT555 into the CG-SMG for visualization of viscerofugal neurons. (Right) Immunofluorescence image of the ileum myenteric plexus using native CTB555 fluorescence. White arrows indicate CTB+ neurons. Image representative of n=3. l, (Left) Scheme representing injection of AAV6-CAG-FLEX-tdTomato into the intestine of Snap25cre mice for tracing of fibres. (Right) Immunofluorescence image of CG-SMG showing tdTomato+ fibres originating, in part, from the intestine. CG-SMG is outlined with dashed lines. Image representative of n=2. m-t, PBS- and streptomycin-treated C57BL/6J mice 24 hours post gavage received retrograde CTB594 injection into the CG-SMG. m-v, Analysis of the ileum (m-o, s, u; n=5 PBS, n=5 Strep) and colon (p-r, t, v; n=4 PBS, n=5 Strep). (m,p) Total number of, (n,q) percentage of cFos+ within, (o,r) percentage of cFos+ among CTB+ within, ANNA-1+ neurons. s, t, Immunofluorescence staining of myenteric plexus neurons from the (s) ileum or (t) colon using anti-neuronal nuclear (ANNA-1) (green) and anti-cFos (white) antibodies combined with native CTB594 fluorescence. Arrows indicate CTB+ cFos+ cells. u, v, Percent of CTB+ among ANNA-1+ neurons in the ileum (u) or colon (v). a, c-f, j-l, s, t, Scale bars = 50 μm. h, i, m-r, u, v, Mean ± s.d. h, i, m-r, u, v, Two-tailed unpaired t-test.
Extended Data Figure 6 |
Extended Data Figure 6 |. Mapping and characterization of sympathetic premotor populations that connect to the intestine.
a-c, Number of cFos+ neurons in the CG-SMG of (a) Splenda-treated fasted (n=5) or fed (n=6), VAMN-treated fasted (n=4) or fed (n=4), (b) streptomycin-treated fasted (n=5) or fed (n=5), and (c) GF fasted (n=6) or fed (n=5) C57BL/6J mice. d, Cecal weights of Splenda-treated fasted (n=5) or fed (n=6), VAMN-treated fasted (n=5) or fed (n=4), streptomycin-treated fasted (n=8) or fed (n=7), and GF fasted (n=6) or fed (n=5) C57BL/6J mice. e, Optical projection of 3DISCO-cleared spinal cord showing sympathetic preganglionic CTB+ neurons from C57BL/6J SPF mice injected with CTB555 into the CG-SMG. Scale bar = 20 μm. IML=intermediolateral cell column, IC: intercalated nucleus, IPPe: central autonomic area. Image representative of n=3. f-h, 3D reconstruction of calAdipoClear-cleared (f) CG-SMG, (g), spinal cord (sympathetic preganglionic neurons) and (h) intact spinal column, from C57BL/6J SPF mice 4 days post injection of PRV-RFP (red) into the ileum, stained with anti-TH (green) antibody. Scale bar = 300 μm. Image representative of n= 3. In h, anti-TH (white) antibody and autofluorescence in green; (right) outline of relevant spinal cord structures. Scale bars = 400 μm. Image representative of n=3. i, Immunofluorescence images of brainstem slices from VGATL10GFP mice 4 days post injection of PRV-RFP into the ileum or peritoneum. Dashed lines highlight relevant areas. Images representative of n=2. j, Immunofluorescence images of the dorsal vagal complex in brainstem slices from C57BL/6J mice subjected to subdiaphragmatic vagotomy (sdVx), 4 days post injection of PRV-RFP in the ileum. Dashed lines highlight relevant areas. Images representative of n=2. k, Immunofluorescence image of medullary regions in a brainstem slice from C57BL6/J mice subjected to subdiaphragmatic vagotomy (sdVx), 4 days post injection of PRV-RFP into the ileum. Dashed lines highlight relevant areas. Images representative of n=2. l, ClearMap analysis of C57BL6/J mice 3 and 4 days post injection of PRV-RFP into the ileum, showing the caudal pontine reticular nucleus (right). Scale bars = 1 mm. Images representative of n= 3. m, Immunofluorescent images for neuronal subsets within the RPa and Gi in mice 4 days post PRV-RFP injection into the ileum. Native fluorescence for RFP (red) and stained with anti-5-HT (green), anti-VGLUT2 (green), and anti-TH (green) antibodies. Dashed lines highlight the RPa. White arrows indicate VGLUT2+ cells. Images representative of n=2. n, Immunofluorescent images of the brainstem from mice 4 days post-injection of PRV-GFP (duodenum) and PRV-RFP (ileum). Relevant brainstem regions are highlighted. Representative images of n=3. i-k, m, n, Scale bars = 50 μm. a-d, Mean ± s.d. a, d, One-way ANOVA with Tukey’s multiple comparisons. b, c, Two-tailed unpaired t-test.
Extended Data Figure 7 |
Extended Data Figure 7 |. Gut-connected sympathetic pre-motor brainstem regions modulate intestinal motility.
a, Immunofluorescence images of brain slices from C57BL/6J SPF and GF mice stained with anti-cFos (black) and anti-TH (red) antibodies. White-dashed lines outline RPa, Gi, LPGi, RVLM. Images representative of n=2. b, (Left) Percentage of TRAP+ cells among PRV GFP+ cells and (right) total number of TRAP+ cells in the LPGi/RVLM of FosTRAP2:tdTomato mice. Animals were treated with streptomycin (n=4) or PBS (n=4), and with 4-OHT 24 hours later. c, Immunofluorescent images of brain slices from VGAT:hM3DqGi/RPa and VGLUT2:hM3DqLPGi/RVLM mice stained with anti-cFos (green) and anti-RFP (red) antibodies. White-dashed lines outline relevant areas. Arrows indicate mCherry+ cFos+ cells. Images representative of n=3. d, (Top) Colonic motility or (bottom) gastrointestinal transit time of C57BL6/J mice treated with 1 mg/kg Compound 21 (n=5) or saline (n=5). e, Gastrointestinal transit time of VGLUT2:hM3DqLPGi/RVLM (n=14) or hM3DqLPGi/RVLM (n=14) mice treated with saline. f, Total fecal output of VGLUT2:hM3DqLPGi/RVLM (n=14) hM3DqLPGi/RVLM (n=10) mice treated with 1mg/kg Compound 21. g, h, Open-field test velocity of (left) VGLUT2:hM3DqLPGi/RVLM (n=14) hM3DqLPGi/RVLM (n=8) mice and (right) VGAT:hM3DqGi/RPa (n=6) and hM3DqGi/RPa (n=6) treated with (g) saline or (h) 1 mg/kg Compound 21. a, c, Scale bars = 50 μm. b, d-h, Mean ± s.d. b, d-h, Two-tailed unpaired t-test. d, e, Dashed line indicates maximum time allowed per animal for motility measurement.
Extended Data Figure 8 |
Extended Data Figure 8 |. Mapping and characterization of the dorsal vagal complex connected to distal intestine.
a, ClearMap analysis of the nucleus tractus solitarius (NTS)/dorsal motor nucleus of the vagus nerve (DMV) and the caudal pontine reticular nucleus, days 3 and 4 post PRV-RFP injection into the ileum of C57BL/6J mice. Scale bars = 1mm. Images representative of n= 3. b, c, Immunofluorescence images of the caudal brainstem 4 days post PRV injection into the (b) ileum (PRV-RFP) and duodenum (PRV-GFP) or (c) ileum (PRV-RFP) and colon (PRV-GFP) of C57BL/6J mice. Dashed line outlines the borders of the DMV. Image representative of n=3. d, Immunofluorescence images of brainstem sensory nuclei from VGLUT2L10GFP mice 4 days post-injection of PRV-RFP using with anti-GFP and anti-RFP antibodies. e, Immunofluorescence images of brains slices from C57BL/6J mice treated with PBS or streptomycin. Images representative of n=9. f, Immunofluorescence images of NTS and AP from C57BL/6J GF mice stained with anti-cFos (black) antibody. Images representative of n=3. g, Number of TRAP+ cells in the AP and NTS of FosTRAP2:tdTomato mice treated with streptomycin (n=5) or PBS (n=4), given 4-OHT 24 hours later. h, Immunofluorescence images of brains slices showing TRAP+ cells in the AP and NTS of FosTRAP2:tdTomato mice treated with PBS (left) or streptomycin (right), given 4-OHT 24 hours later. Images representative of n=4. i, j, (i) Immunofluorescence images of the NTS and AP, stained using anti-cFos (black) antibody, and (j) number of cFos+ neurons in the AP, NTS, and SolG, 24 hours post concomitant treatment with streptomycin (n=4) and PBS (n=5) (left) or Tributyrin (right) of C57BL/6J mice, Images representative of n=5; PBS (n=4), Tributyrin (n=5). b-f, h, Scale bars = 50 μm. g, j, Mean ± s.d. g, j, Two-tailed unpaired t-test.
Extended Data Figure 9 |
Extended Data Figure 9 |. Targeting of peripheral neurons using different Cre mouse lines.
a, b, Immunofluorescence images of (a) NG, CG-SMG, and DRG or (b) myenteric plexus and villi in the ileum from Phox2btdTomato:RiboTag, SNStdTomato:RiboTag, and Nav1.8tdTomato:RiboTag mice. Images representative of n=3. In (b), red-dashed lines highlight villi structure. c, Number of cFos+ neurons in the CG-SMG of Trpv1Cre- and Trpv1DTA mice treated with PBS (n=2, n=3 respectively) or streptomycin (n=3, n=3 respectively). d, Immunofluorescence images of CG-SMG from C57BL/6J mice injected with AAV2-hSyn-hM3Dq-mCherry or AAV2-hSyn-hM3Dq-mCherry virus, post administration of 1mg/kg Compound 21. Arrows indicate cFos+ mCherry+ cells. Asterisks indicate other cFos+ cells (possibly hematopoietic cells). e, Percentage of cFos+ among mCherry+ neurons in the CG-SMG of C57BL/6J mice injected with AAV2-hSyn-hM3Dq-mCherry (n=4) or AAV2-hSyn-hM4Di-mCherry (n=5 or n=4) virus, post administration of 1mg/kg or 10mg/kg Compound 21. f, Number of cFos+ neurons in the CG-SMG of C57BL6/J mice injected with AAV2-hSyn-hM3Dq-mCherry (n=4) or AAV2-hSyn-hM4Di-mCherry virus post administration of 1mg/kg (n=5) or 10mg/kg (n=4) Compound 21. g, Number of mCherry+ neurons in the CG-SMG of C57BL/6J mice injected with AAV2-hSyn-hM3Dq-mCherry (n=4) or AAV2-hSyn-hM4di-mCherry post administration of 1mg/kg (n=5) or 10mg/kg (n=4) Compound 21. h, Immunofluorescence images of CG-SMG from Nav1.8tdTomato, AviltdTomato, and SNStdTomato mice injected with CTB488 in the proximal colon. Arrows indicate neurons that are CTB+ and tdTomato–. i, Number of cFos+ neurons in the CG-SMG of Nav1.8hM4Di mice 6 hours post administration with 10mg/kg Compound 21 (n=3) or saline (n=3). j, RNAscope in situ hybridization images of left (L-NG) and right nodose ganglion (R-NG) for Scn5a (Nav1.5) (red). Images representative of n=4. k, RNAscope in situ hybridization images of the R-NG for Scn5a (Nav1.5) (red) and Cre from mice injected with AAVrg-pmSyn-Cre-EGFP into the proximal colon. Images representative of n=2. l, RNAscope in situ hybridization images of the R-NG for Scn5a (Nav1.5) (red) and immunofluorescence for CTB488 from mice with CTB488-injected into the proximal colon. Images representative of n=2. a, b, d, h, j-l, Scale bars = 50 μm. c, e-g, i, Mean ± s.d. c, i, Two-tailed unpaired t-test. e-g, One-way ANOVA with Tukey’s multiple comparisons.
Extended Data Figure 10 |
Extended Data Figure 10 |. Gut-connected brainstem regions modulate intestinal motility.
a, b, Immunofluorescence images of brains slices highlighting the NTS/AP from (a) SNShM4Di or (b) Phox2bhM4Di mice treated with Compound 21 at 10 mg/kg, stained with anti-cFos (black) antibody. Images representative of n=3. c, d, Immunofluorescence images of brains slices highlighting the NTS/AP from (c) sham-operated C57BL6/J mice treated with streptomycin or (d) sdVx C57BL6/J mice treated with PBS, stained with cFos (black) antibody. Images representative of n=5. e, Immunofluorescence image of the left NG post injection of PRV-GFP into LPGi/RVLM of brainstem. Outline highlights NG. Image representative of n=3. f, g, Immunofluorescence images of (f) CG-SMG or (g) L-NG the after PRV-GFP and CTB594 injection into the proximal colon of subdiaphragmatically vagotomized C57BL/6J mice. Image representative of n=3. h, i, (Left) Scheme of injection of AAVrg-FLEX-tdTomato into the NTS of (h) VGLUT2Cre or (i) SNSChR2 mice. (Right) Immunofluorescence images of the NG and colonic myenteric plexus. Outline highlights NG. Images representative of n=2. i, Inset shows tdTomato+ fibre surrounding an intrinsic neuron. Brainstem slice shows absence of Cre activity in the dorsal motor nucleus of the vagus. Outline highlights relevant areas. Images representative of n=3. j, Immunofluorescence cleared-tissue images of the duodenum (left) and cecum (right) of mice injected with AAV9-Syn-ChrimsonR-tdTomato in the R-NG. Scale bar = 500 mm. Image representative of n=3. k, (left) Scheme of right NG injection. (right) Expression of AAV9-Syn-ChrimsonR-tdTomato in NG. Image representative of n=3. l, Scheme for microbiota-sensitive circuits controlling sympathetic activity to the gut, and potentially other visceral organs. a-j, Scale bars = 50 μm.
Fig. 1 |
Fig. 1 |. Gut-associated sympathetic neurons are activated in the absence of a microbiota.
a, (Left) Scheme depicting retrograde CTB555 or CTB488 tracing from intestinal regions to the CG-SMG, left (L) and right (R) NG of C57BL/6J SPF mice. (Right) Images representative of tracing from duodenum (n=5), ileum (n=6), and colon (n=5). b, c, Number of CTB+ neurons per (b) L-NG and R-NG or (c) CG-SMG retrograde labelled from the duodenum (n=3), ileum (n=4), and proximal colon (n=4). d, Triple CTB tracing in the CG-SMG and NG with CTB488 (duodenum), CTB555 (ileum), and CTB647 (colon) of C57BL6/J SPF mice. Images representative of n=2. e, f, Volcano plots of differentially expressed genes in the NG (e) or CG-SMG (f) of Snap25RiboTag GF and SPF mice. g, h, Gene ontology pathways, enriched in Snap25RiboTag GF vs SPF NG (g) or CG-SMG (h). i, Immunofluorescence images of the CG-SMG from C57BL/6J GF and SPF mice using anti-cFos antibody. White arrows indicate cFos+ nuclei. Images representative of GF (n=9) and SPF mice kept on GF diet (n=7). j, Numbers of cFos+ neurons in the CG-SMG of C57BL/6J GF mice from Rockefeller (n=9) or Mount Sinai (n=10) animal facilities, compared to SPF mice kept on GF diet (n=7) or normal chow (n=5), and Taconic SPF mice kept on normal chow (n=5). a, d, i, Scale bars = 50μm. b, c, j, Mean ± s.d. b, c, Two-tailed unpaired t-test. e-h, Number (n) of independent biological samples analysed are indicated in parentheses. Red/blue dots = log2 fold change > 0.5. Italicized parentheses = log2 fold change > 1. padj = two-tailed Benjamini and Hochberg test p-value of two-tailed Wald test p-value < 0.05. g, h, padj = two-tailed Benjamini and Hochberg test p-value of two-tailed Wald test p-value < 0.05. Dashed lines represent threshold of significance (1.3) as calculated by one-tailed Fisher’s test with an elimination algorithm. j, One-way ANOVA with Tukey multiple comparisons.
Fig. 2 |
Fig. 2 |. Dysbiosis triggers gut sympathetic activation.
a-d, Number of cFos+ neurons in the CG-SMG of (a) C57BL/6J GF mice (n=6) and GF mice colonized with faeces from SPF mice (GF-FC, n=8) 2 weeks prior to analysis, (b) C57BL/6J SFB (n=5), A. muciniphilia- (n=3) or B. fragilis- (n=5) monocolonized mice, and OligoMM12- (n=4) or ASF (n=3) consortia-colonized mice, (c) C57BL/6J GF mice (n=3) and GF mice colonized with Clostridium spp. consortia (n=4) from Weill Cornell animal facilities, (d) C57BL/6J SPF mice treated for 2 weeks with vancomycin, ampicillin, metronidazole, and neomycin (VAMN) (n=12) in drinking water as compared to Splenda (n=6) and water (n=5) treated mice. e, Immunofluorescence of the CG-SMG from C57BL/6J SPF mice treated with VAMN or Splenda, using anti-cFos antibody. Images representative of n=6 ganglia. f, g, Number of cFos+ neurons in the CG-SMG in (f) C57BL/6J SPF mice following 2 weeks of single antibiotic (metronidazole: n=10, neomycin: n=10, ampicillin: n=10, vancomycin: n=15) or Splenda (n=5) treatment, (g) C57BL/6J SPF mice 24 hours post streptomycin (strep, n=11) or PBS (n=6), BALBc/J SPF mice 24 hours post strep (n=6) or PBS: n = 4), CBA/J SPF mice 24 hours post strep (n=5) or PBS (n=5), C57BL/6J SPF mice 5 days post strep (n=4). h, (Left) Scheme for (right) immunofluorescence images of the CG-SMG from FosGFP SPF mice treated with VAMN or water for 2 weeks, with CTB555 injected into the ileum. i-l, Gastrointestinal transit time in C57BL/6J SPF mice treated with (i) Splenda (n=5) or VAMN (n=5), (j) VAMN with saline (n=10) or guanethidine, (k) strep (n=12) or PBS (n=13), (l) strep with saline (n=10) or guanethidine (n=10). e, h, Scale bars = 50μm. a-d, f, g, i-l, Mean ± s.d. a, c, i-l, Two-tailed unpaired t-test. b, d, f, g One-way ANOVA with Tukey’s multiple comparisons. b, q, Dashed line indicates the average number (334) of cFos+ neurons in GF mice. i-l, Dashed line indicates maximum time allowed per animal for motility measurement.
Fig. 3 |
Fig. 3 |. Sympathetic pre-motor mapping, control of CG-SMG neurons, and intestinal motility.
a, Scheme representing injection of PRV into the intestine for multisynaptic tracing (for c-k). b, Scheme representing tissue clearing followed by ClearMap analysis. c, ClearMap analysis of PRV-RFP injection into the ileum of C57BL/6J SPF mice at days 3 and 4 post-injection showing raphe/gigantocellular nuclei. Scale bar = 1mm. Images representative of n= 3 mice. d, e, Immunofluorescence images of the brainstem from (d) VGATL10GFP or (e) VGLUT2L10GFP mice 4 days post PRV-RFP injection into the ileum. Images representative of n=5 mice. pyr = pyramidal tract, RPa = raphe pallidus. f, g, Quantification of (f) PRV+ VGATL10GFP+ or (g) PRV+ VGLUT2L10GFP+ neurons in RPa, Gi, and LPGi/RVLM of mice in d and e, respectively. h, Immunofluorescence images of the brainstem from C57BL/6J SPF mice 4 days post injection of PRV-GFP (duodenum) and PRV-RFP (ileum). Images representative of n=3 mice. i, m, Scheme representing the injection of AAV5-DIO-hSyn1-hM3Dq-mCherry into the (i) Gi/RPa of VGATCre or into the (m) LPGi/RVLM of VGLUT2Cre SPF mice. j-l, n-p, Gastrointestinal transit time (j, n), colonic motility (k, o) and number of cFos+ neurons in the CG-SMG (l, p) of VGAT:hM3DqGi/RPa (n=6) or control (n=6) and VGLUT2:hM3DqLPGi/RVLM (n=14) or control (n=10) mice treated with 1mg/kg C21. Dashed line indicates maximum time allowed per animal for motility measurement. d, e, h, Scale bars = 50μm. d, e, h, Relevant brainstem regions are highlighted. Arrows indicate GFP+ RFP+ cells and asterisks indicate RFP+ GFP- cells. f, g, j-l, n-p, Mean ± s.d. j-l, n-p, Two-tailed unpaired t-test. f, g, One-way ANOVA with Tukey’s multiple comparisons.
Fig. 4 |
Fig. 4 |. Activation markers change upon microbial depletion in brainstem sensory nuclei connected to gut-projecting vagal afferents.
a, Number of cFos+ neurons in the AP, NTS and NTS-SolG of C57BL/6J SPF mice 24 hours post oral gavage with PBS (n=9) or streptomycin (strep) (n=9). b-d, Number of cFos+ neurons in the CG-SMG of (b) SNShM4Di (n=6) or control (n=4) SPF mice 6 hours post Compound 21 (10mg/kg) injection, (c) resiniferatoxin-treated C57BL/6J SPF mice 24 hours post strep (n=5 ganglia) or PBS (n=5 ganglia), and (d) Phox2bbhM4Di (n=5) or control (n=6) mice 4 hours post injection with 10mg/kg Compound 21. e,f, Volcano plot of differentially expressed genes from the NG of SNSRiboTag versus (e) AvilRiboTag or (f) Nav1.8RiboTag mice. g, RNAscope in situ hybridization images of the R-NG for Scn5a (Nav1.5) (red) and immunofluorescence from C57BL/6J SPF mice injected with CTB488 into the proximal colon. White arrows point to CTB+ Scn5a+ cells. Images representative of n=2 NG. h, (Left) Scheme for (right) immunofluorescence images of the NG from C57BL/6J SPF mice after PRV-GFP injection into the brainstem (1) or sdVx mice in the proximal colon (2). Mice in (2) received concomitant CTB594 injection in the proximal colon. Outline highlights NG. Images representative of n=3 ganglia. i, j, Immunofluorescence cleared-tissue images of the proximal colon (i) or the distal ileum (j) of mice AAV9-Syn-ChrimsonR-tdTomato injection into the R-NG (left 1x and right 4x zoom). Scale bars = 500μm (left) and 250μm (right). Images representative of n=3 from different mice. g, h, Scale bars = 50μm. a-d, Mean ± s.d. a-d, Two-tailed unpaired t-test. e,f, Number (n) of independent biological samples analysed are indicated in parentheses at top. padj = two-tailed Benjamini and Hochberg test p-value of two-sided Wald test p-value < 0.05.

References

    1. Furness JB, Rivera LR, Cho HJ, Bravo DM & Callaghan B The gut as a sensory organ. Nature reviews. Gastroenterology & hepatology 10, 729–740, doi:10.1038/nrgastro.2013.180 (2013). - DOI - PubMed
    1. Han W et al. A Neural Circuit for Gut-Induced Reward. Cell 175, 665–678 e623, doi:10.1016/j.cell.2018.08.049 (2018). - DOI - PMC - PubMed
    1. Williams EK et al. Sensory Neurons that Detect Stretch and Nutrients in the Digestive System. Cell, doi:10.1016/j.cell.2016.05.011 (2016). - DOI - PMC - PubMed
    1. Fung TC, Olson CA & Hsiao EY Interactions between the microbiota, immune and nervous systems in health and disease. Nature neuroscience 20, 145–155, doi:10.1038/nn.4476 (2017). - DOI - PMC - PubMed
    1. Veiga-Fernandes H & Mucida D Neuro-Immune Interactions at Barrier Surfaces. Cell 165, 801–811, doi:10.1016/j.cell.2016.04.041 (2016). - DOI - PMC - PubMed

Publication types

MeSH terms

Substances