. 2020 Jul;583(7817):572-577.
doi: 10.1038/s41586-020-2487-2. Epub 2020 Jul 8.

Native American gene flow into Polynesia predating Easter Island settlement

Affiliations

Native American gene flow into Polynesia predating Easter Island settlement

Alexander G Ioannidis et al. Nature. 2020 Jul.

Abstract

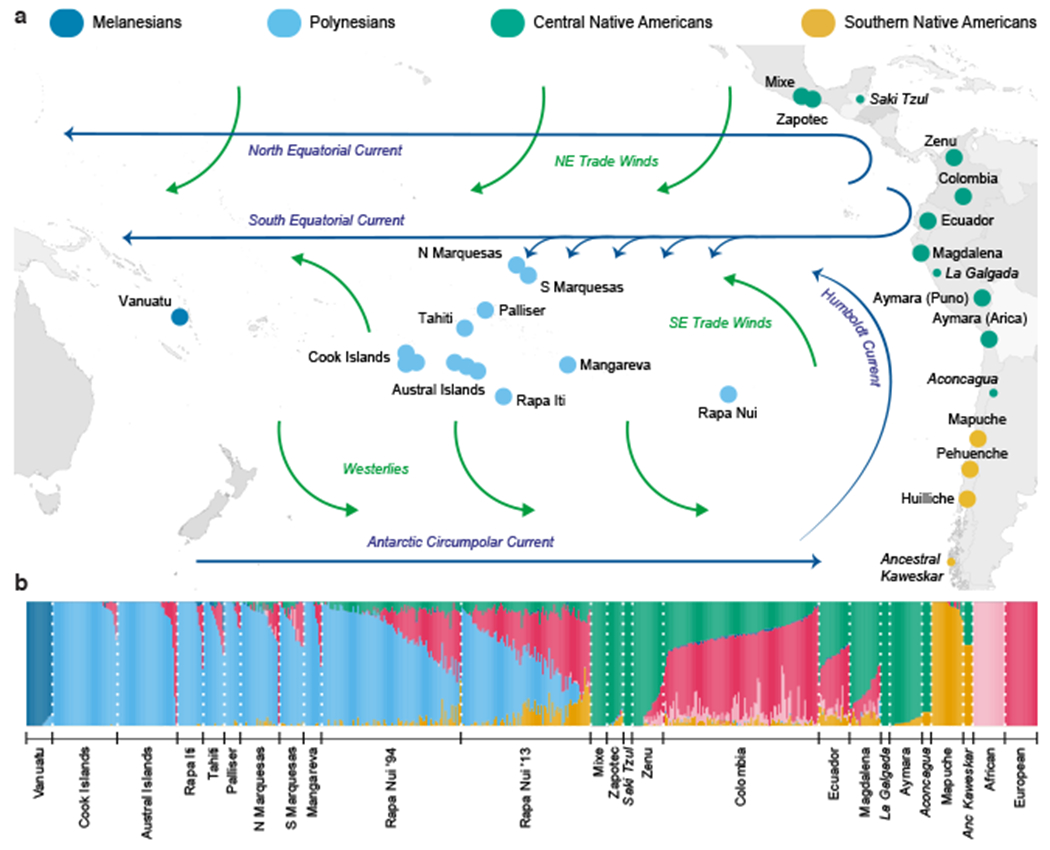
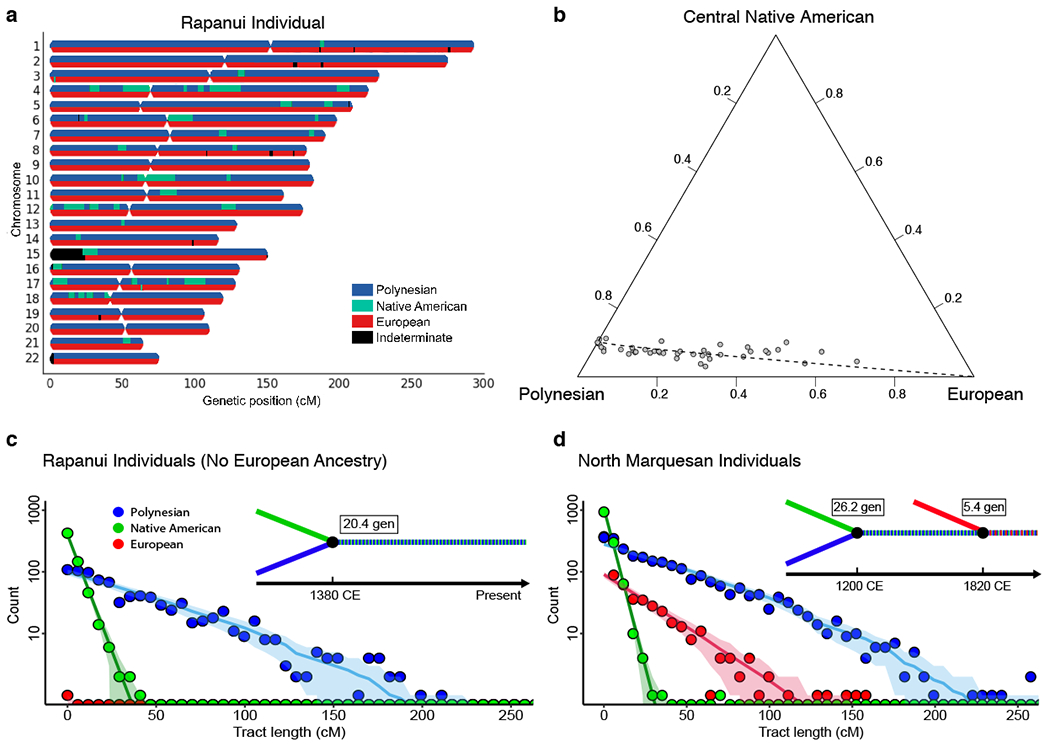
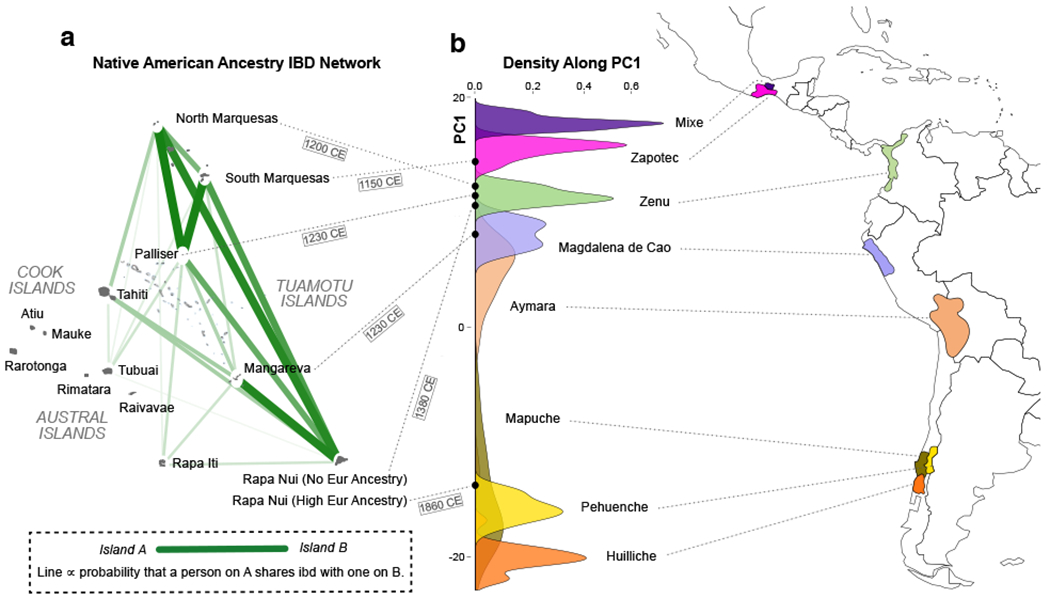
The possibility of voyaging contact between prehistoric Polynesian and Native American populations has long intrigued researchers. Proponents have pointed to the existence of New World crops, such as the sweet potato and bottle gourd, in the Polynesian archaeological record, but nowhere else outside the pre-Columbian Americas1-6, while critics have argued that these botanical dispersals need not have been human mediated7. The Norwegian explorer Thor Heyerdahl controversially suggested that prehistoric South American populations had an important role in the settlement of east Polynesia and particularly of Easter Island (Rapa Nui)2. Several limited molecular genetic studies have reached opposing conclusions, and the possibility continues to be as hotly contested today as it was when first suggested8-12. Here we analyse genome-wide variation in individuals from islands across Polynesia for signs of Native American admixture, analysing 807 individuals from 17 island populations and 15 Pacific coast Native American groups. We find conclusive evidence for prehistoric contact of Polynesian individuals with Native American individuals (around AD 1200) contemporaneous with the settlement of remote Oceania13-15. Our analyses suggest strongly that a single contact event occurred in eastern Polynesia, before the settlement of Rapa Nui, between Polynesian individuals and a Native American group most closely related to the indigenous inhabitants of present-day Colombia.


Conflict of interest statement

Competing interests C.D.B. is a member of the scientific advisory boards for Liberty Biosecurity, Personalis, 23andMe Roots into the Future, Ancestry.com, IdentifyGenomics, Genomelink, and Etalon and is a founder of CDB Consulting. C.R.G. owns stock in 23andMe and is member of the scientific advisory board for Encompass Bioscience.

Figures

FIGURE 1
FIGURE 1
Sampled populations with unsupervised (iterative) ADMIXTURE analysis. (a) Map showing the number of individuals from each sampled population (one dot per population). (b) K=6 clustering analysis of Pacific islanders and references using the ADMIXTURE method. The references include populations from: Europe (UK and Spain) and Africa (Yoruba), the Americas (Mapuche, including Pehuenche and Huilliche, from central and south Chile, Aymara from southern Peru and northern Chile, northern Peruvians from Magdalena de Cao, Zenu from Colombia, and Zapotec and Mixe from southern Mexico), and at far-left Melanesians from Vanuatu (see Supplementary Figure 5). Each individual is represented as a narrow column, coloured to show the proportion of each ancestry cluster in that individual. Modern Colombians and Ecuadorians as well as four ancient (pre-European contact) individuals (italics, wide columns), spaced along the coast (small dots), were included to further illustrate the Native American component,,, but were not used as references due to their lower marker density. The key (at top) represents our interpretation of the six coloured clusters obtained in this unsupervised clustering analysis. (See Supplementary Data Table 5 for the distinction between early modern and ancient Oceanian cluster nomenclature.)
FIGURE 2
FIGURE 2
Relationship between Polynesian, Native American, and European ancestries. (a) Random-forest based local ancestry inference of a Rapanui individual showing small (old) Native American ancestry tracts embedded in Polynesian ancestry tracts. The ancestry of each haploid genome is coloured (top and bottom for each homologous chromosome pair); the autosome pairs are numbered along the vertical axis. (b) Ternary plot of ADMIXTURE ancestry fractions in Rapanui individuals having Polynesian, European, and central Native American, but no other, ancestries (each point corresponds to an individual). The first principal component in the centered log-ratio transform space is projected onto the figure as a dashed curve. The ancestries’ log-ratio variances are discussed in Supplementary Data Tables 7–10. (c-d) Length distribution analyses for ancestry tracts in the six Rapanui individuals having no European ancestry (c) and in North Marquesan individuals (d). Plotted points show the aggregate tract length counts, lines show the maximum likelihood best fit tract length distributions, and shading shows the one standard deviation confidence intervals assuming Gaussian noise. The best fit admixture chronology is plotted above the timeline as a line-history with each colour representing an ancestry as indicated in the key (see a).
FIGURE 3
FIGURE 3
Analysis of European ancestry in Pacific islanders. (a) Our new ancestry-specific MDS applied to the European ancestry of each admixed sample from the Pacific islands together with European reference individuals from the POPRES dataset shows French Polynesian islanders (text labels) clustering with French individuals. Rapanui (diamonds) cluster with Spain or France, depending on whether (green) or not (violet) they also have southern Native American (Chilean) ancestry. The number of samples from each country are given in Supplementary Data Table 3. (b) Identity-by-descent sharing of European ancestry segments in Polynesia is strongest (darker and thicker lines) between island clusters having the same European colonial backgrounds. The islands’ sample sizes are given in Supplementary Data Table 1.
FIGURE 4
FIGURE 4
Origin and spread of early Native American ancestry in Polynesia. (a) Results of a Native American specific IBD analysis reflect the common ancestry and origin of the Native American component in easternmost Polynesia. (b) Our new ancestry-specific principal component analysis (center) separates Pacific rim Native American references along a north-south axis, as shown in a kernel density plot of the numbers of individuals from select reference populations along the first principal component axis. (See Supplementary Figs 14 and 18 for the full two-dimensional plot.) Colours indicate the reference populations’ locations in the Americas (right). The locations of the aggregate Native American specific components for each Pacific island are also plotted (black dots connected by dashed lines to their source island in (a)). The maximum likelihood date for the Native American introgression event in each island population, as determined by a Tracts analysis (Supplementary Fig. 23), is displayed under the corresponding dashed line. The numbers of samples used from each island and each American population are given in Supplementary Data Table 1.

Comment in

References

    1. Brown JM The Riddle of the Pacific. (T. F. Unwin ltd, 1924). doi: 10.1525/california/9780520080027.001.0001 - DOI
    1. Heyerdahl T American Indians in the Pacific. (Allen & Unwin, 1952).
    1. Yen DE The sweet potato and Oceania. (Bishop Museum Press, 1974).
    1. Montenegro A, Avis C & Weaver A Modeling the prehistoric arrival of the sweet potato in Polynesia. J. Archaeological Science 35, 355–367 (2008).
    1. Roullier C, Benoit L, McKey DB & Lebot V Historical collections reveal patterns of diffusion of sweet potato in Oceania obscured by modern plant movements and recombination. Proc. Natl. Acad. Sci. U.S.A 110, 2205–2210 (2013). - PMC - PubMed

Publication types