. 2020 Sep;585(7824):288-292.
doi: 10.1038/s41586-020-2475-6. Epub 2020 Jul 8.

Mitochondrial ubiquinol oxidation is necessary for tumour growth

Affiliations

Mitochondrial ubiquinol oxidation is necessary for tumour growth

Inmaculada Martínez-Reyes et al. Nature. 2020 Sep.

Abstract

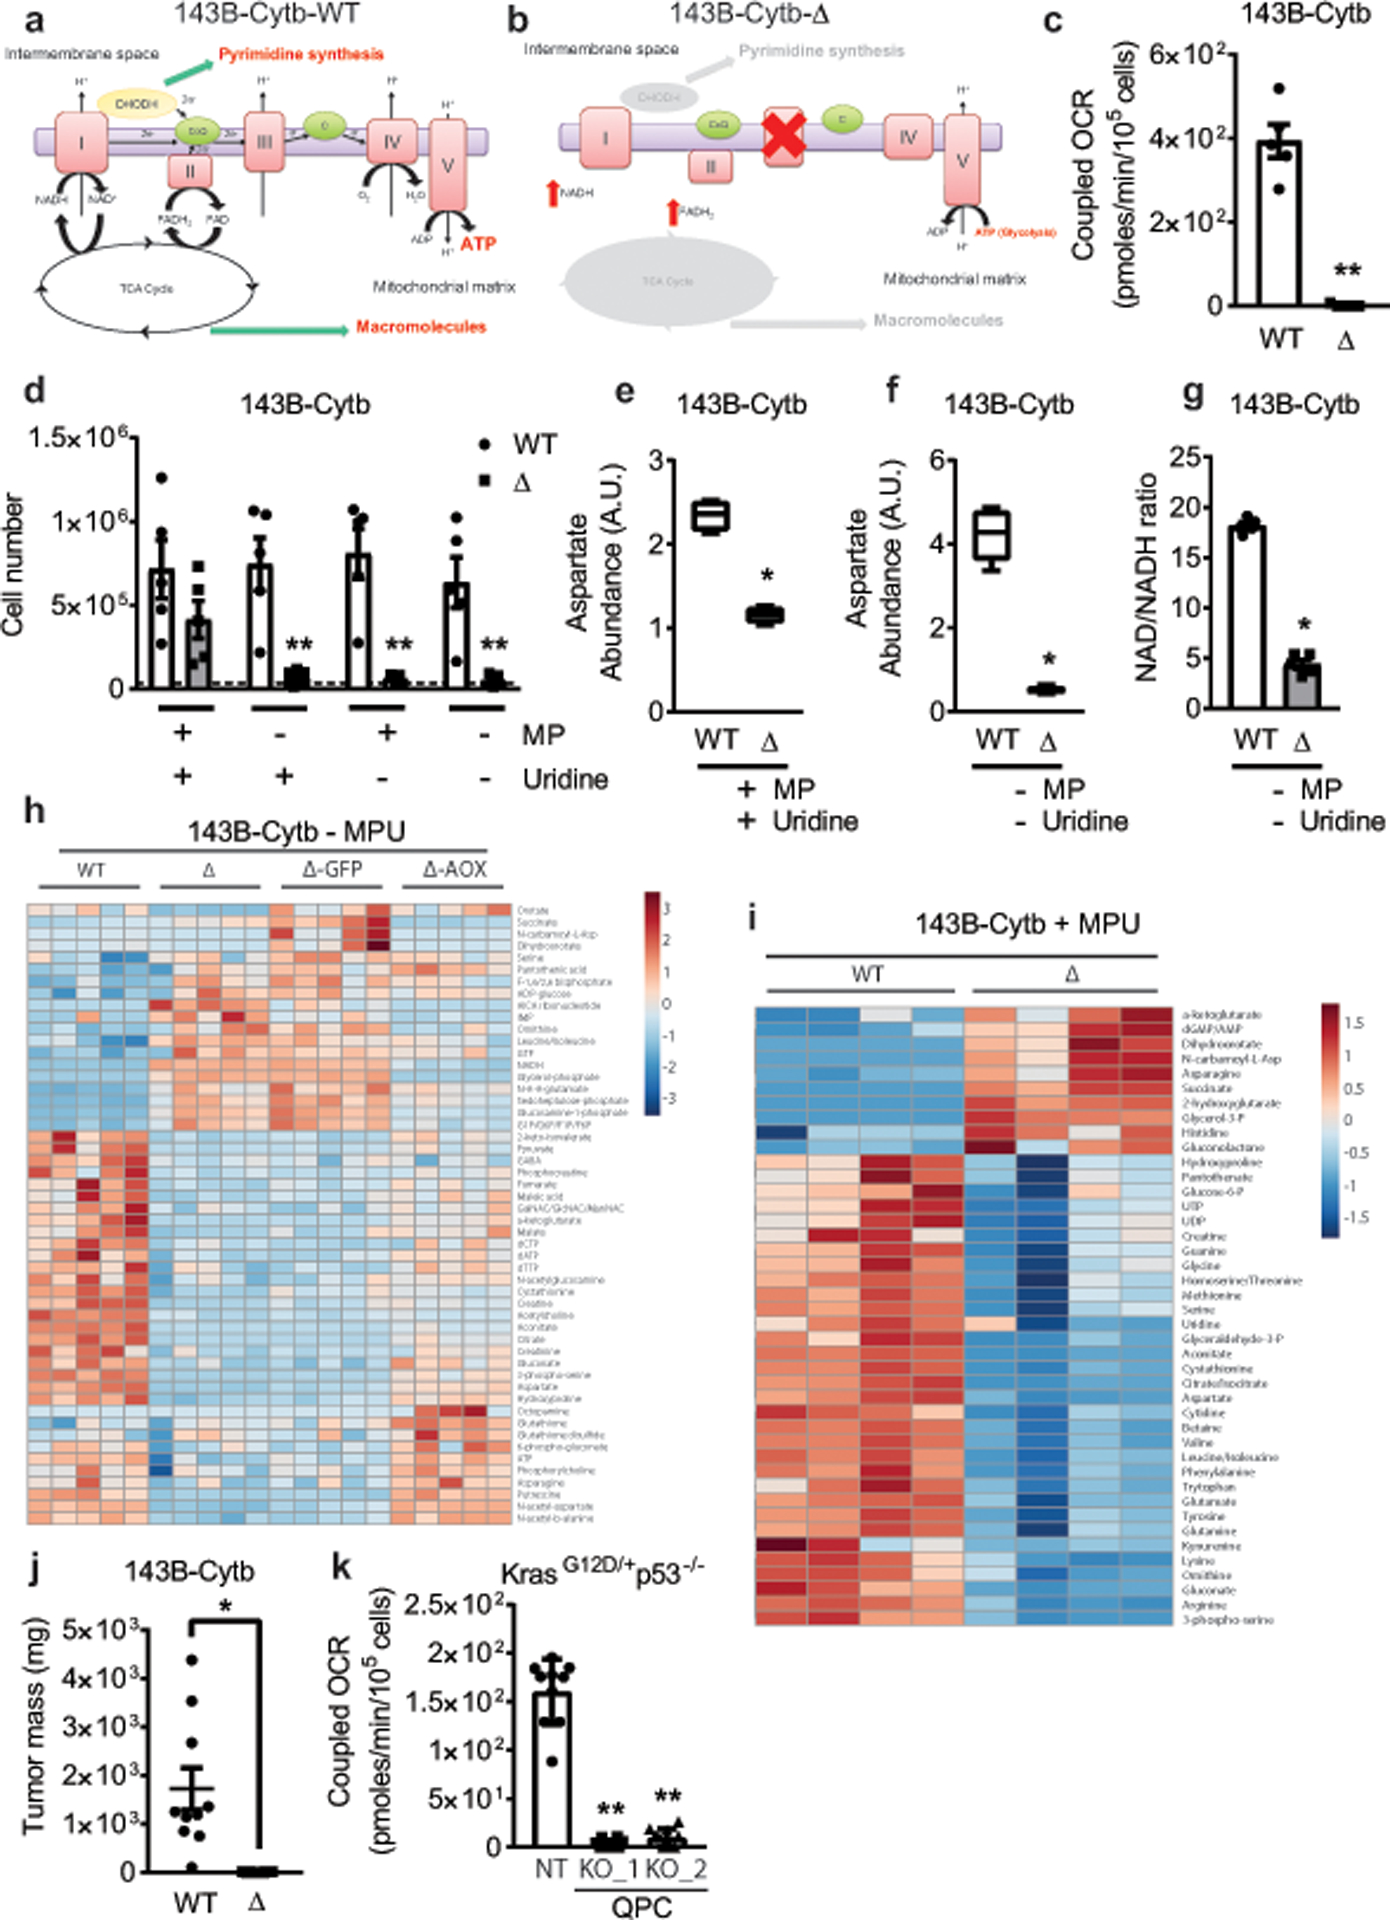
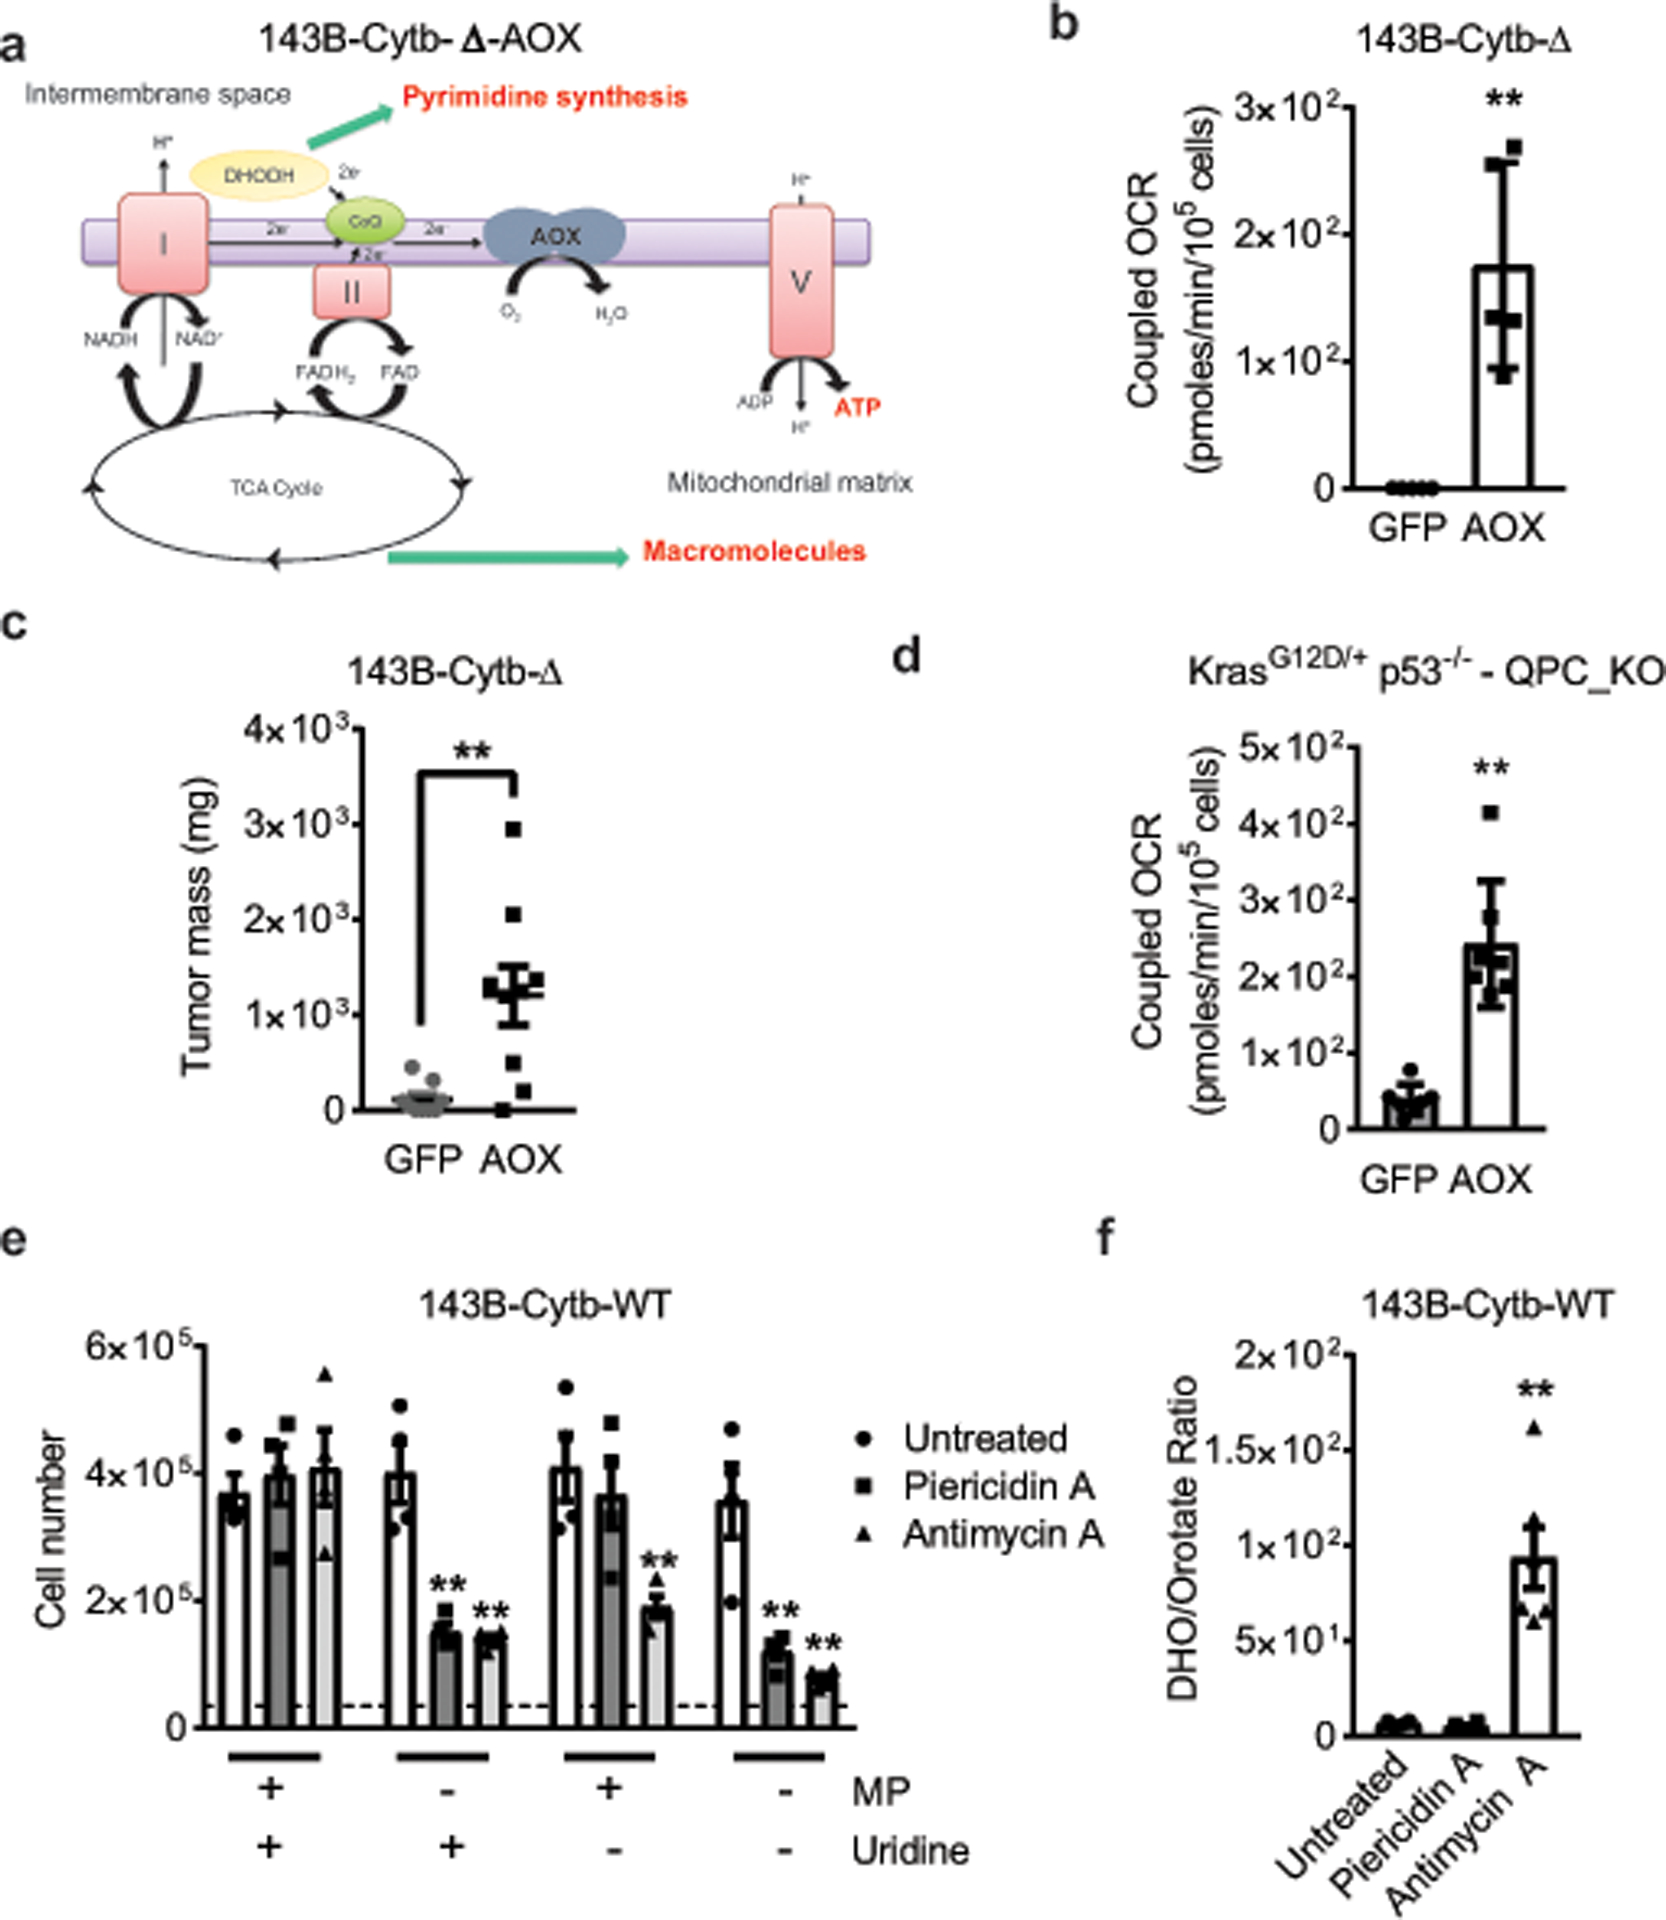
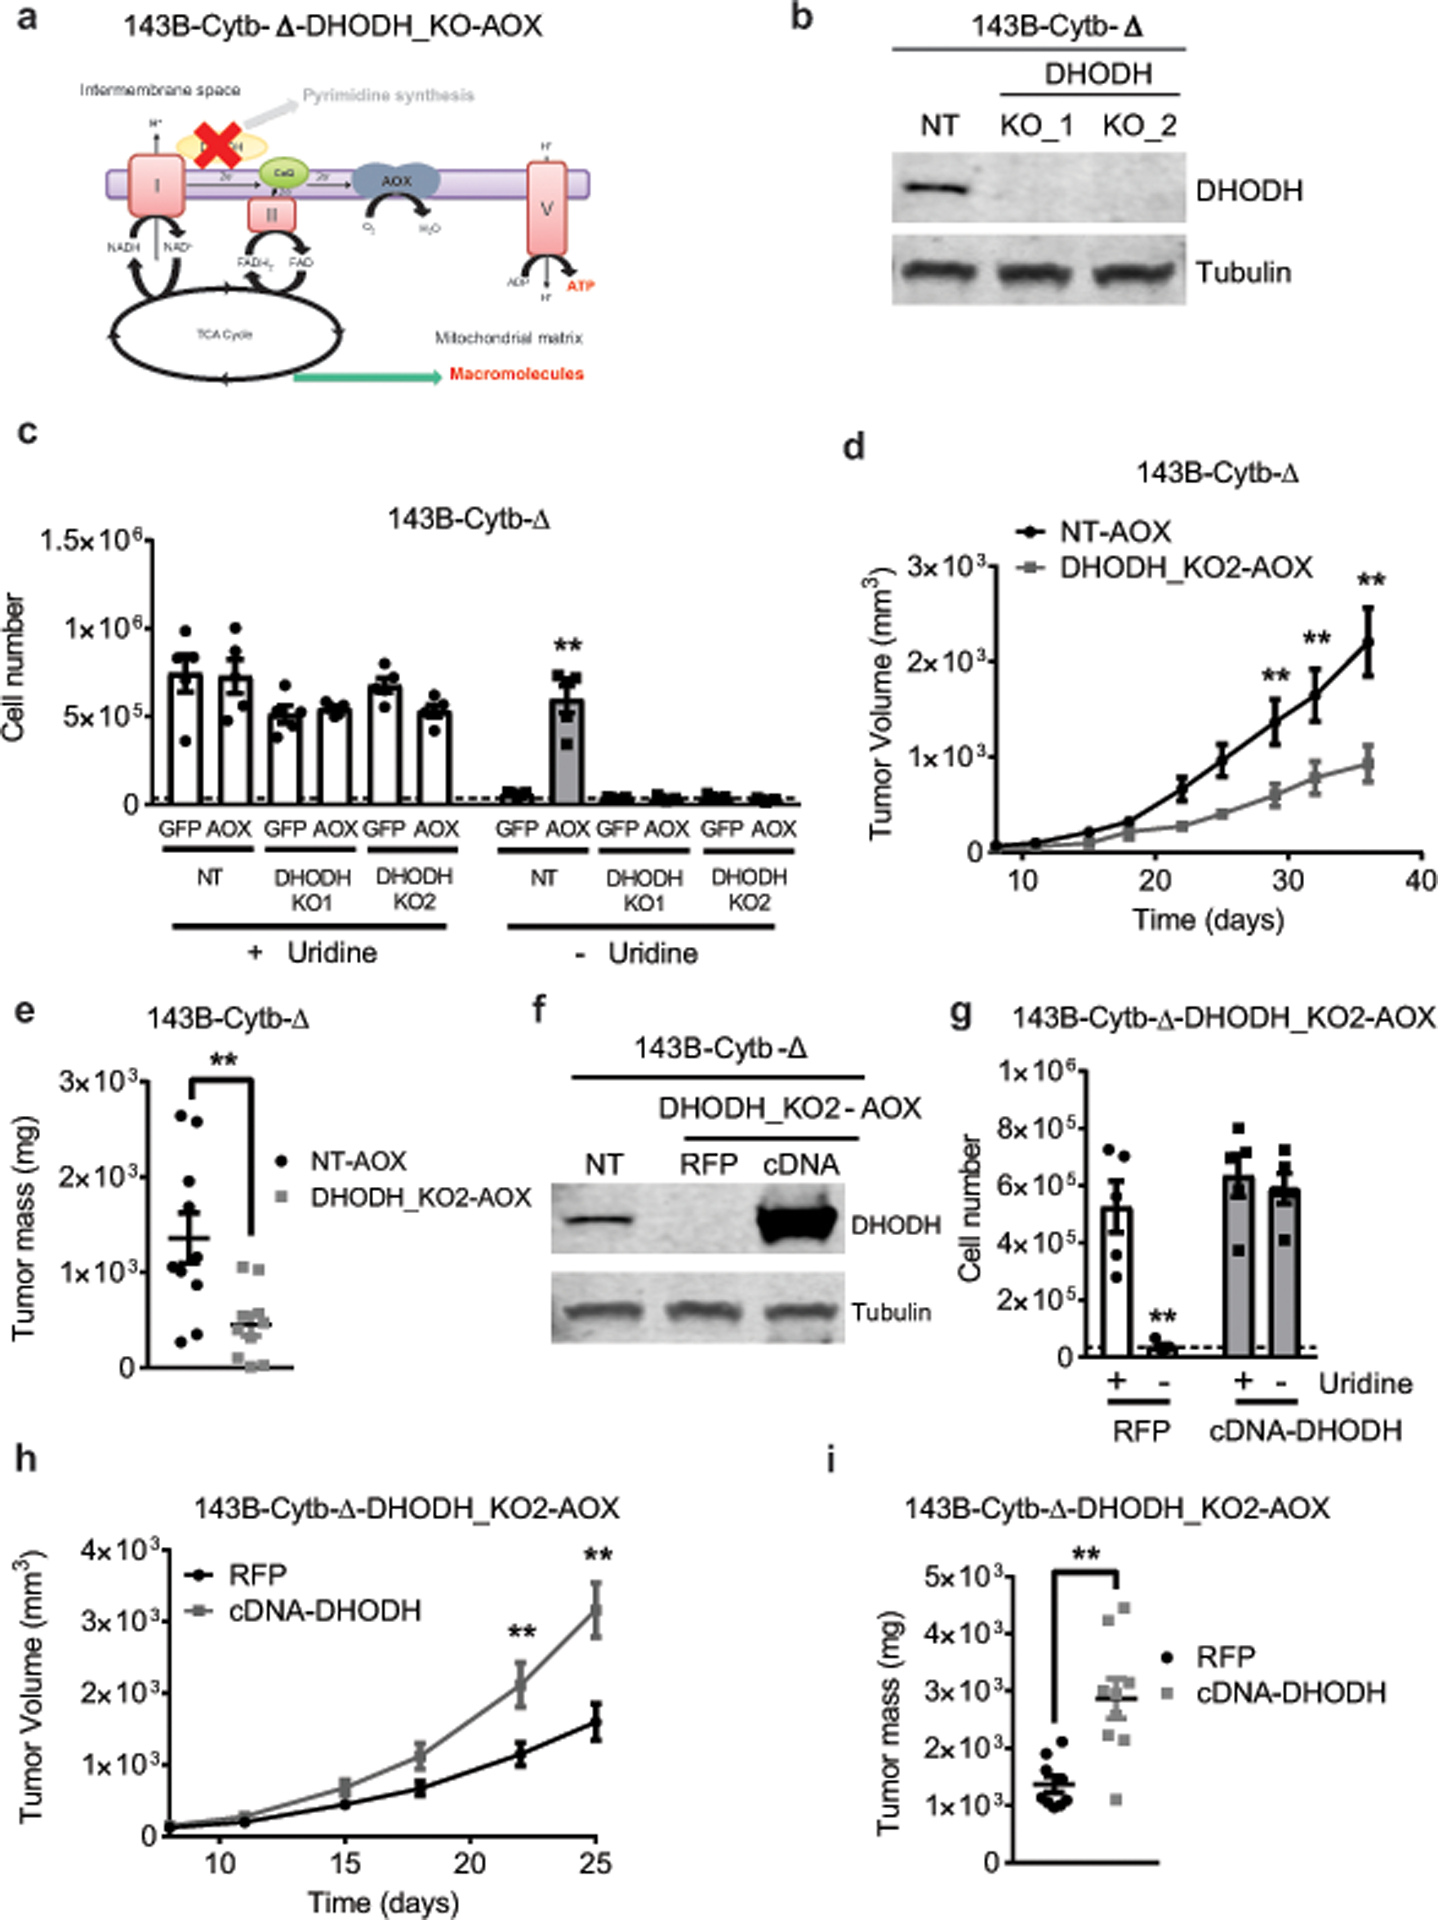
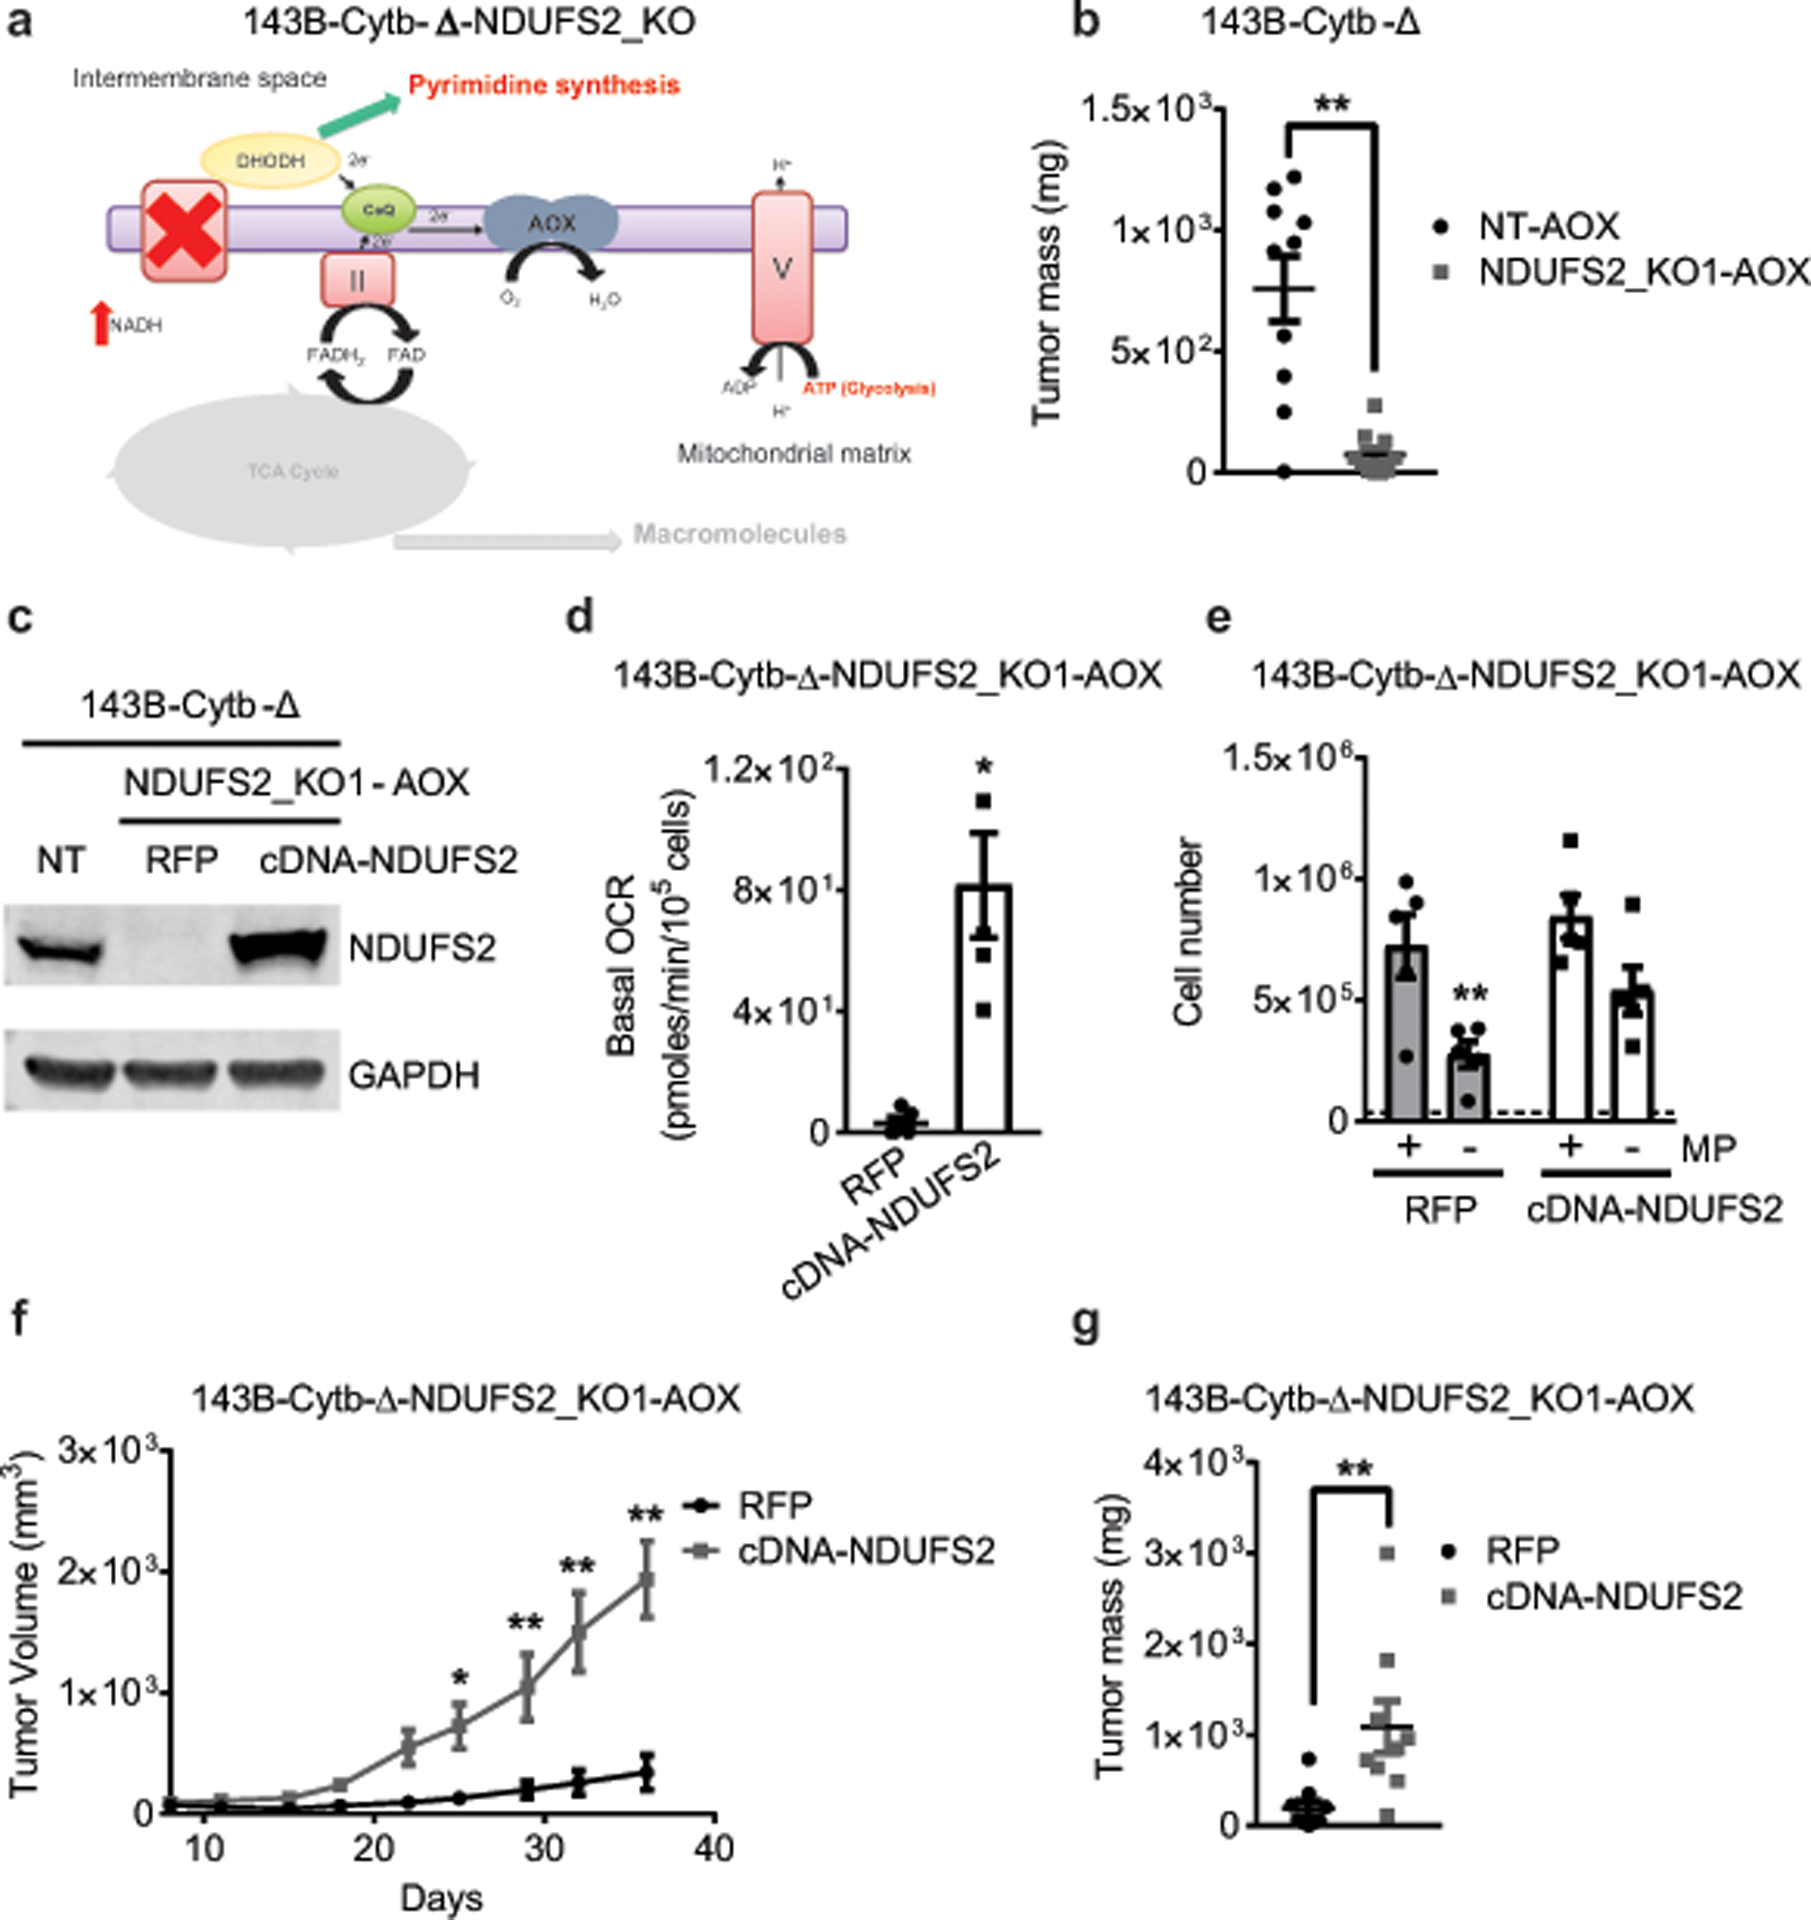
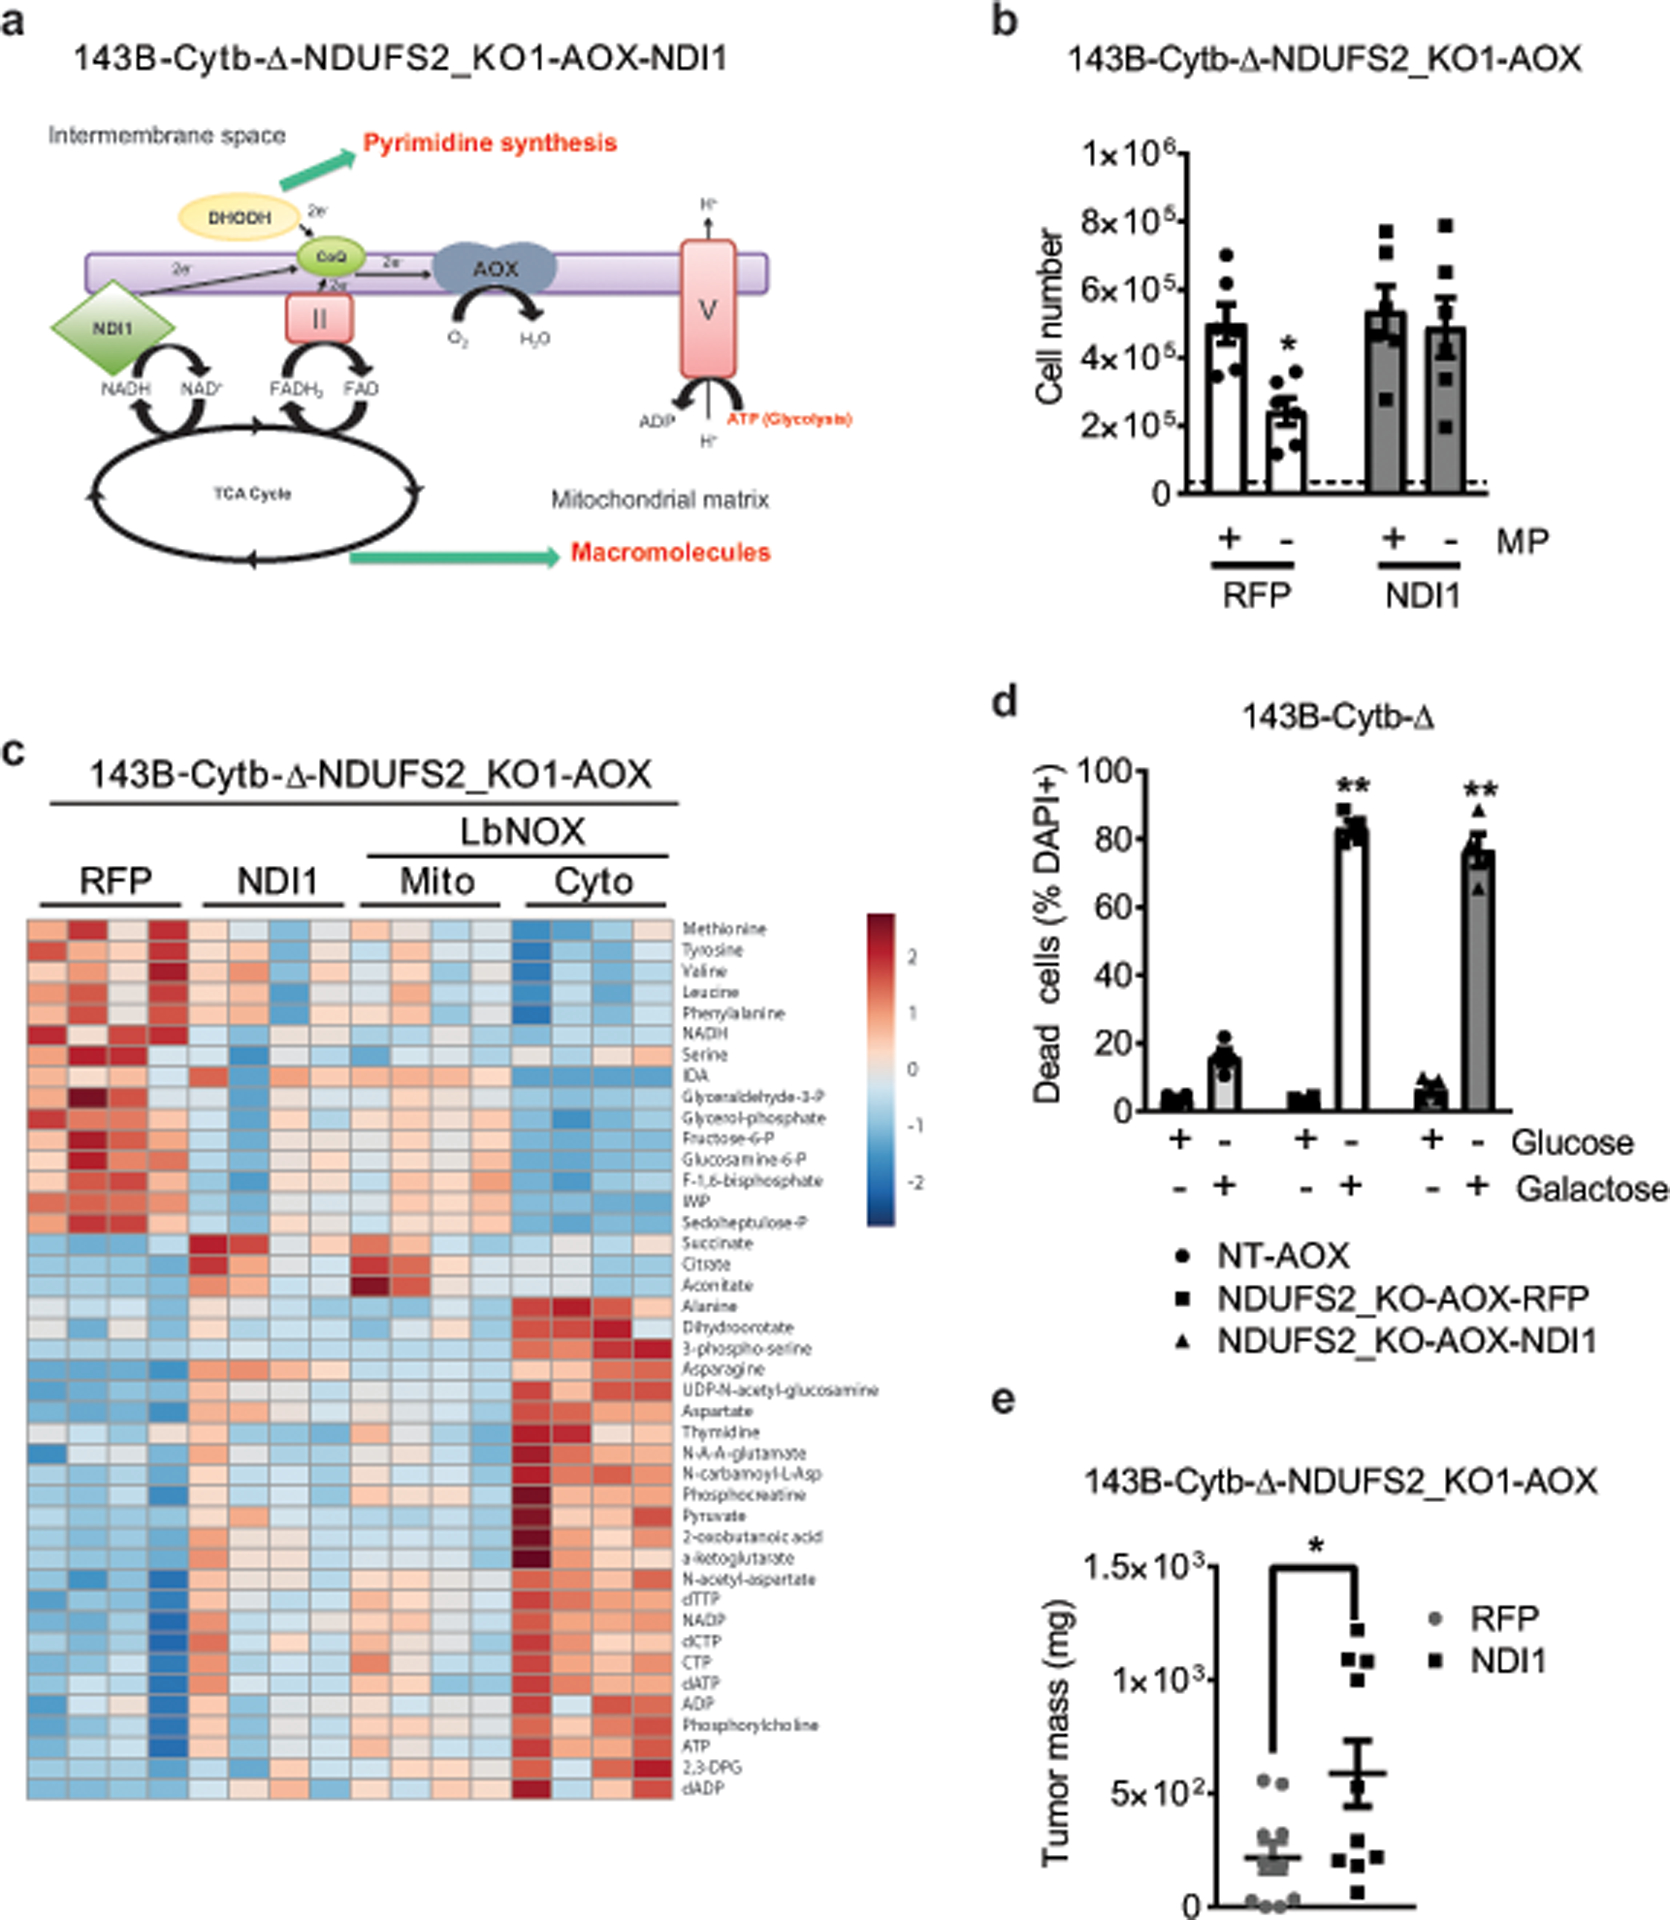
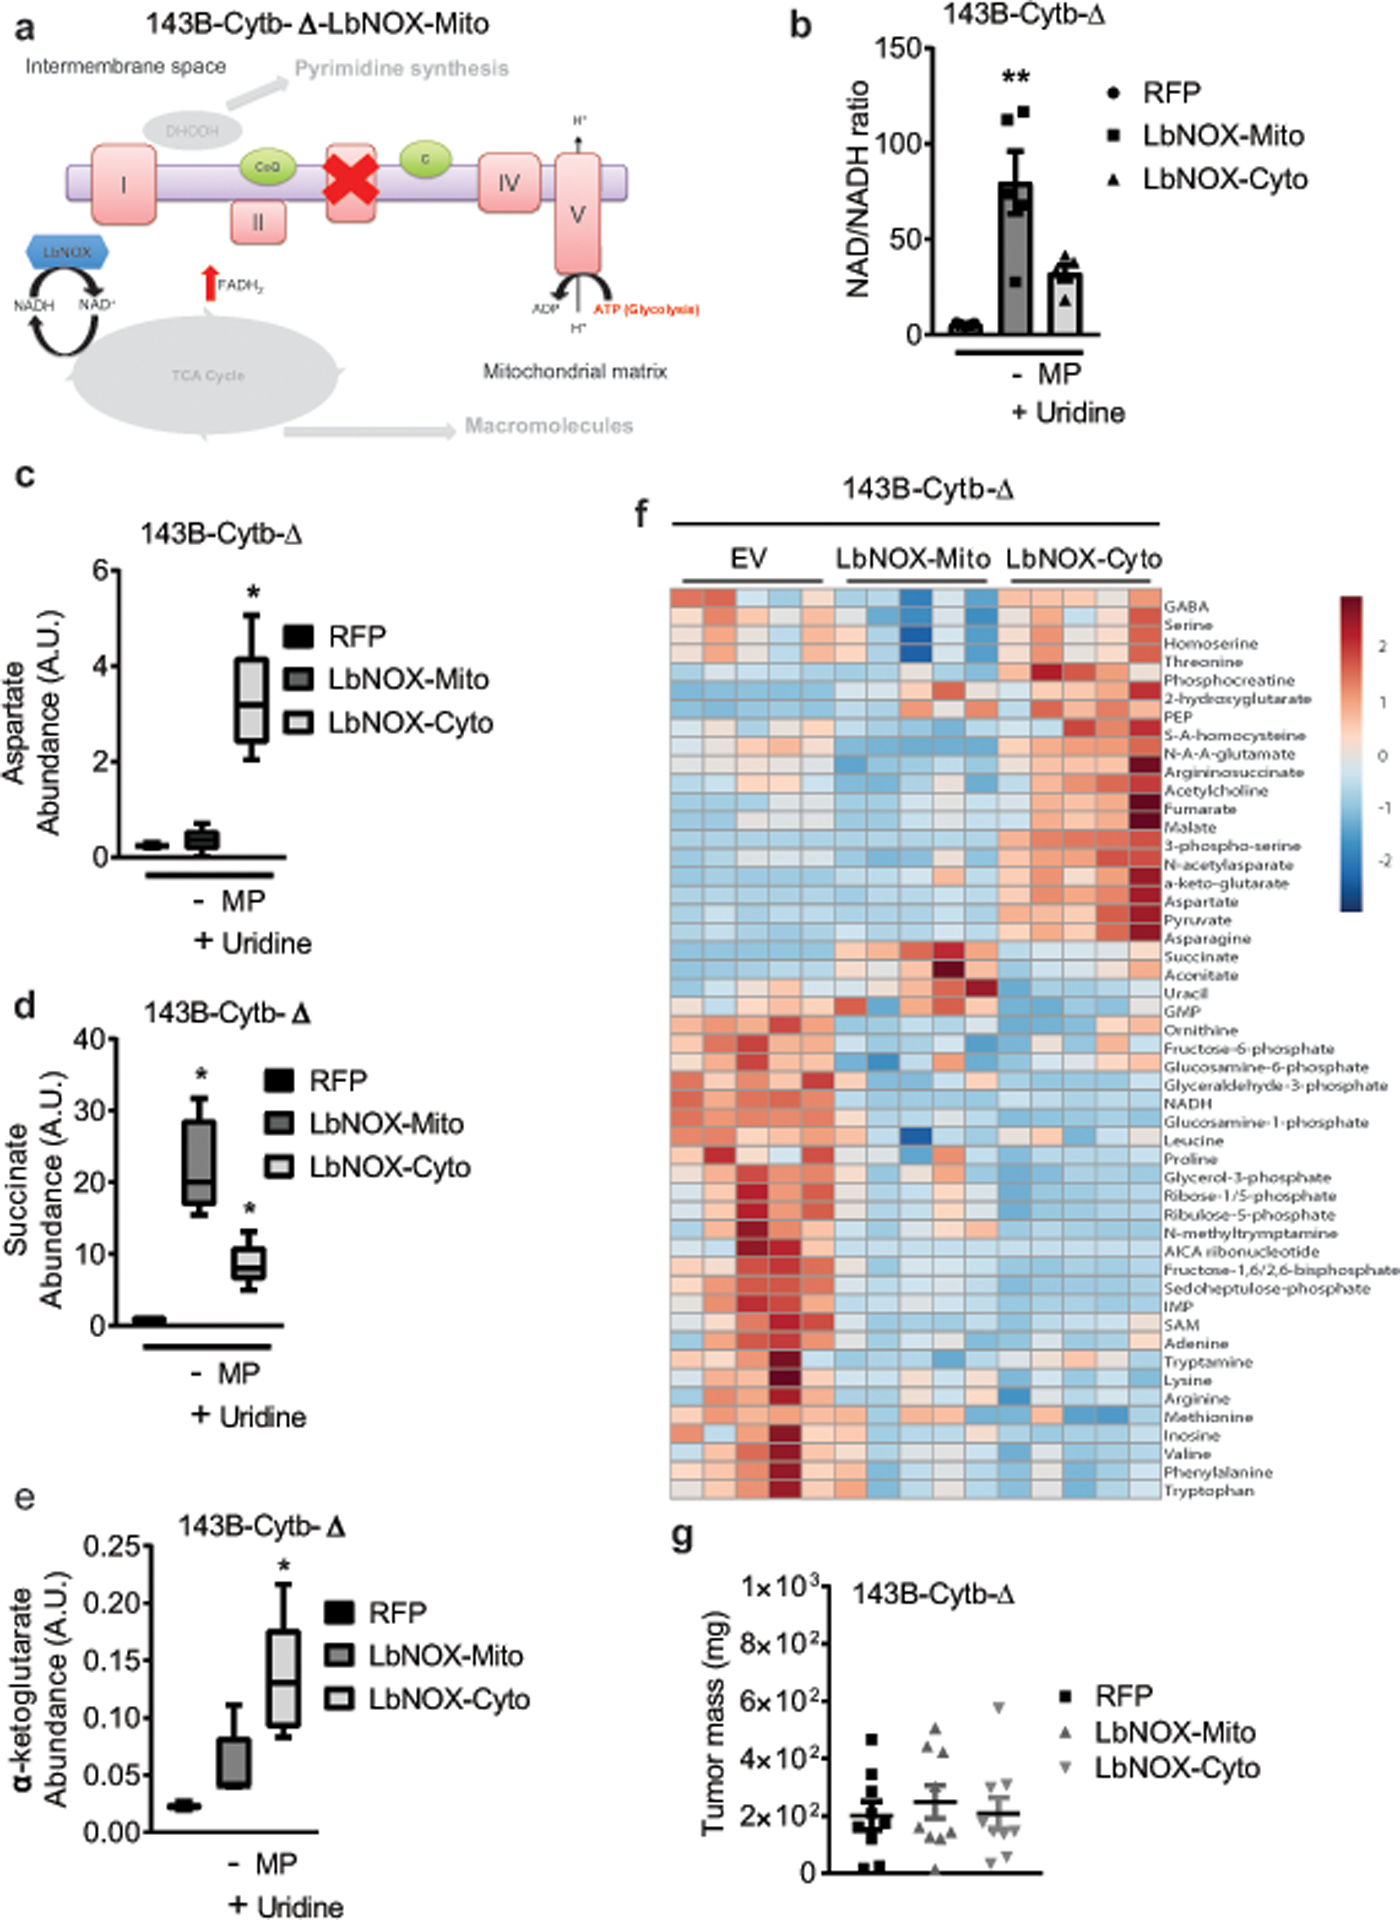
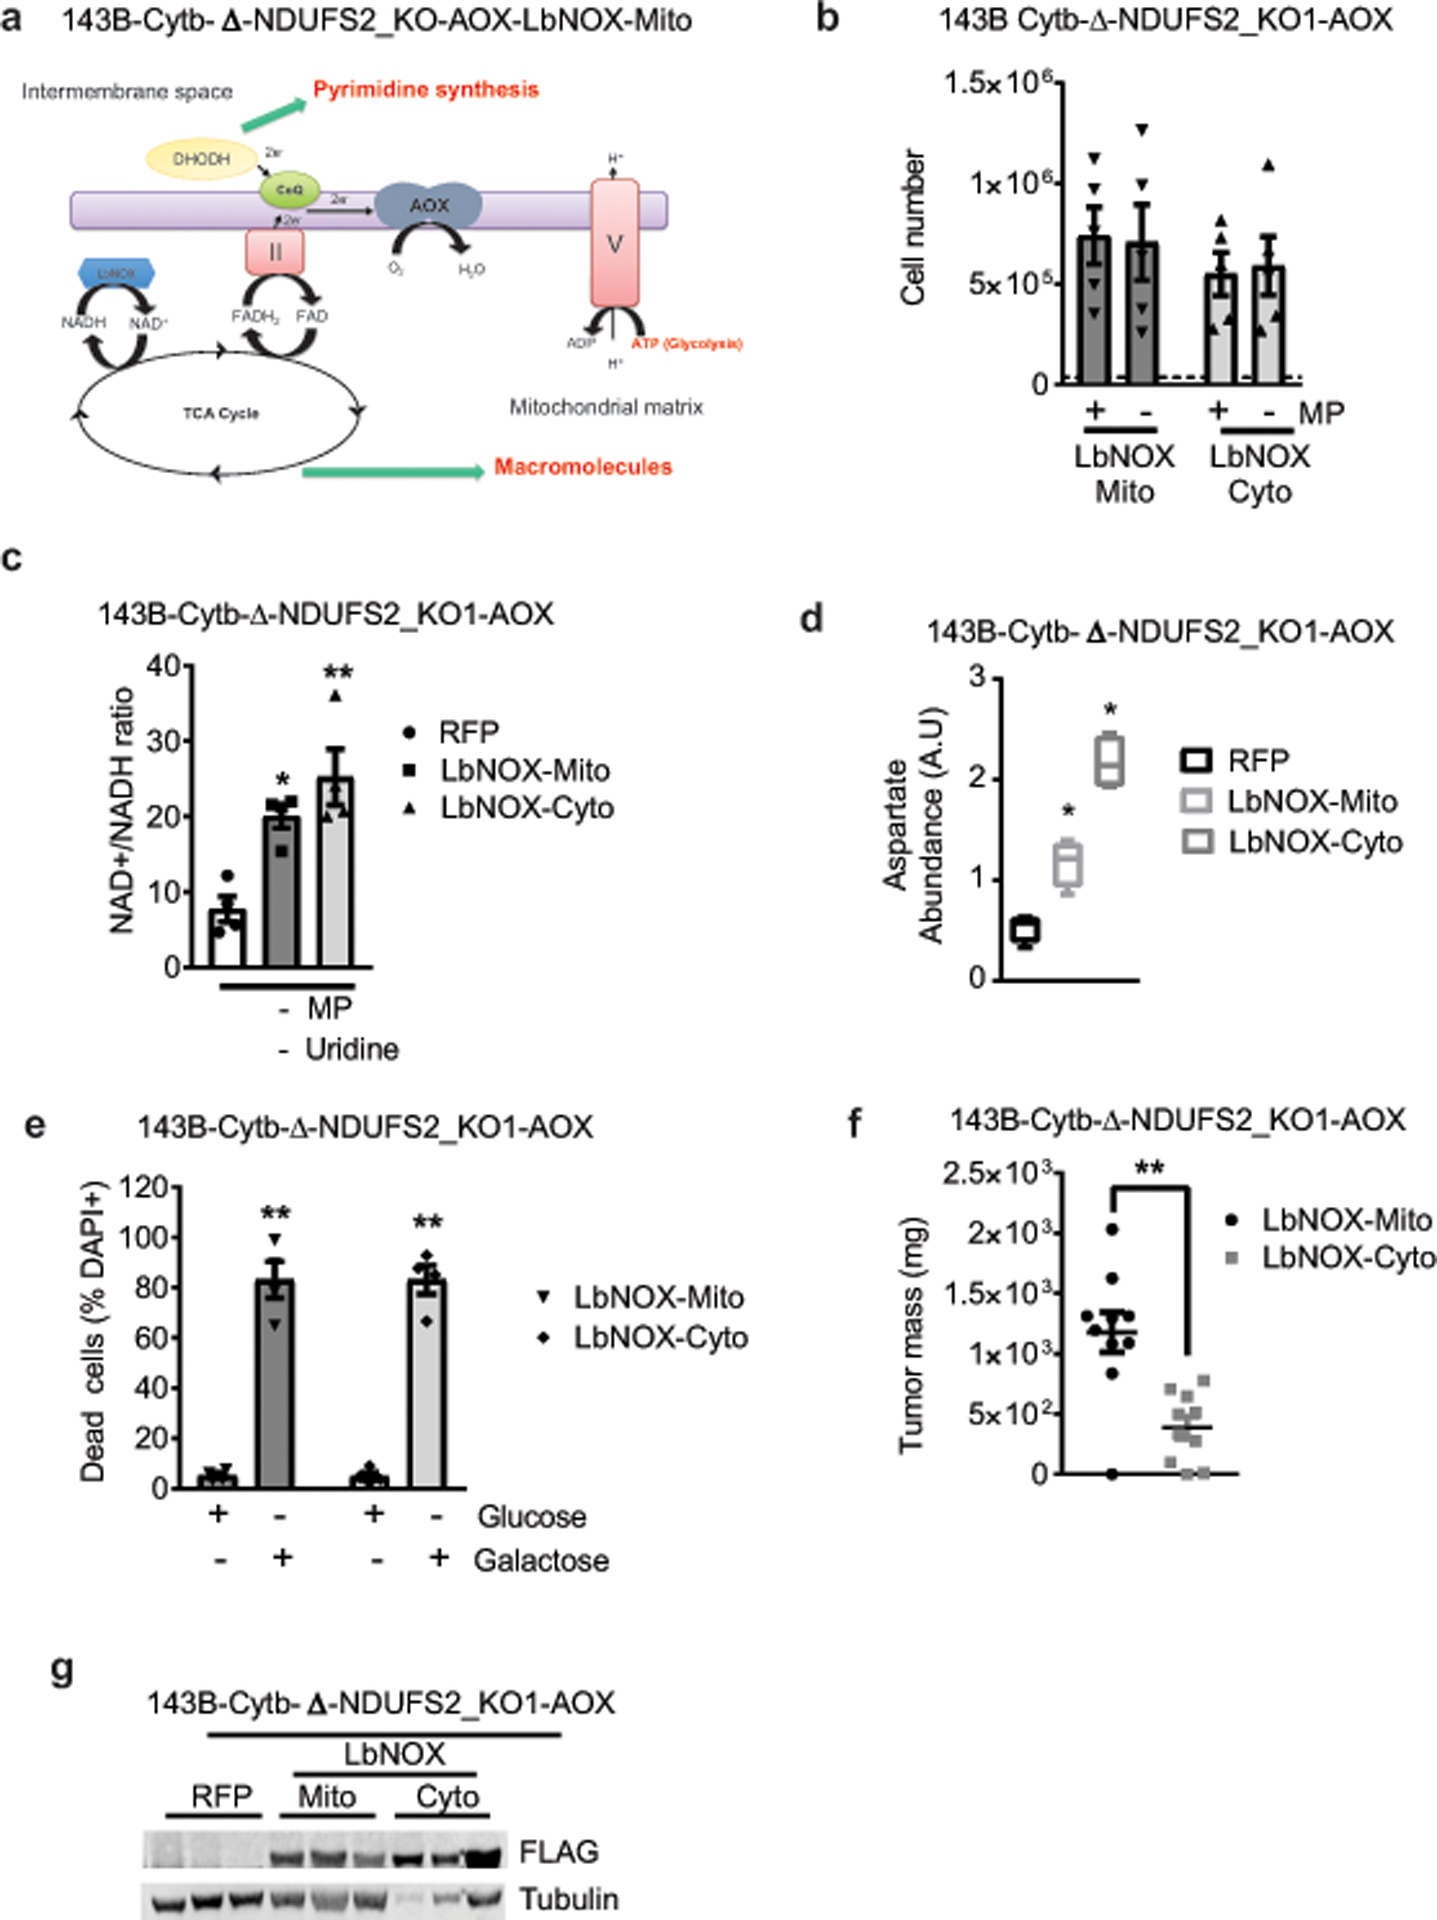
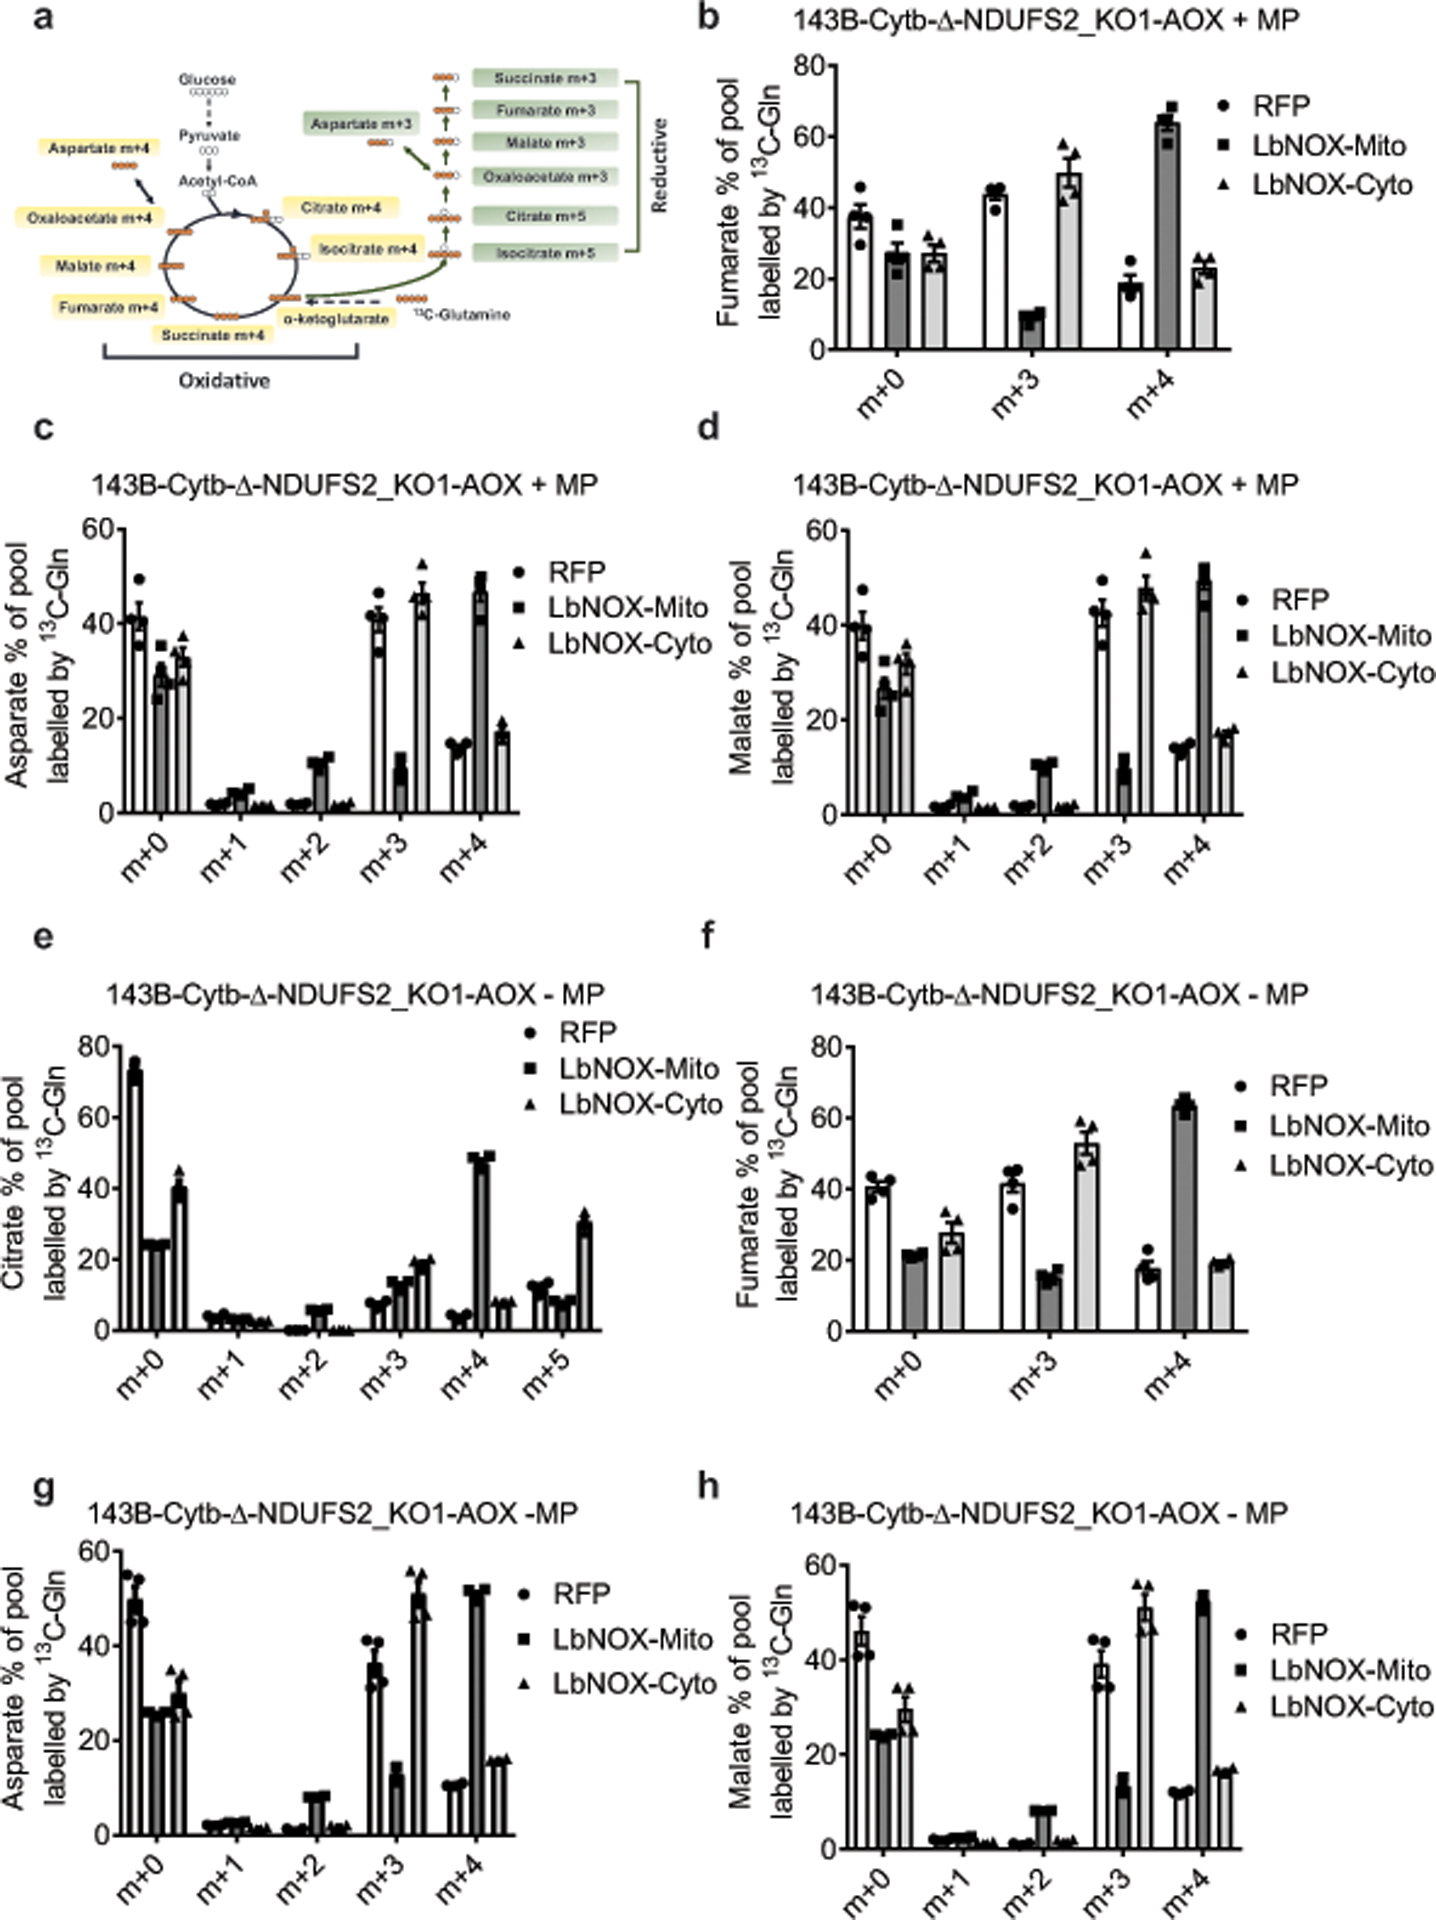
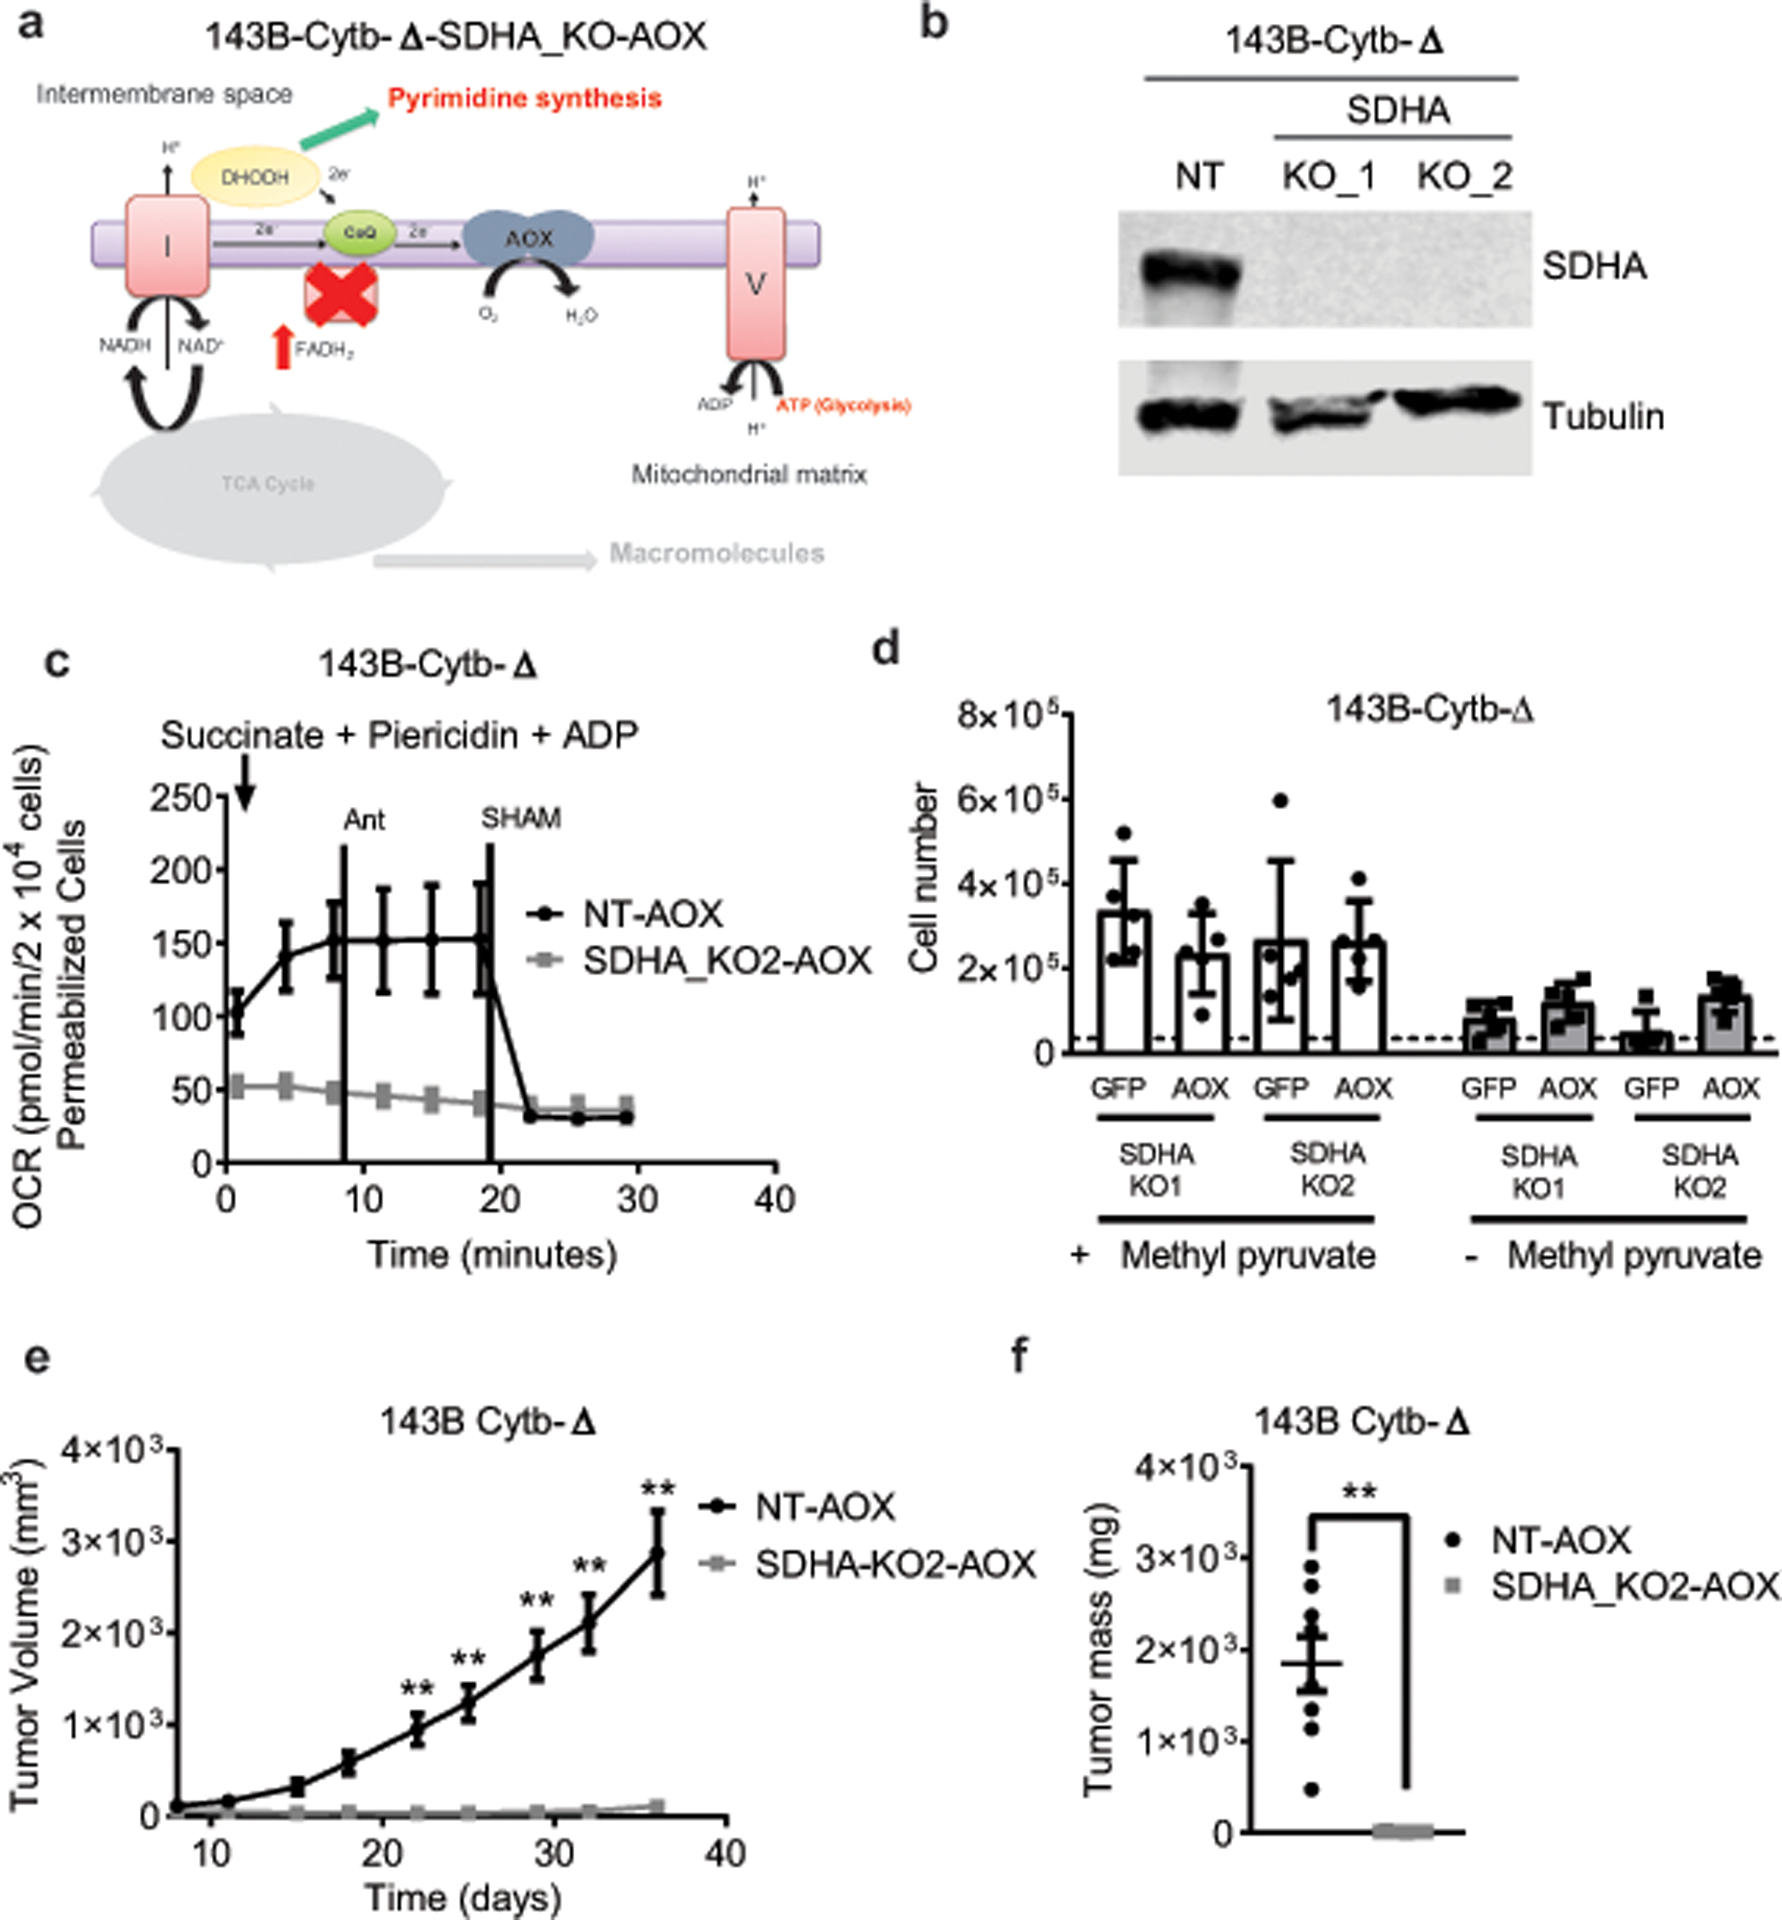
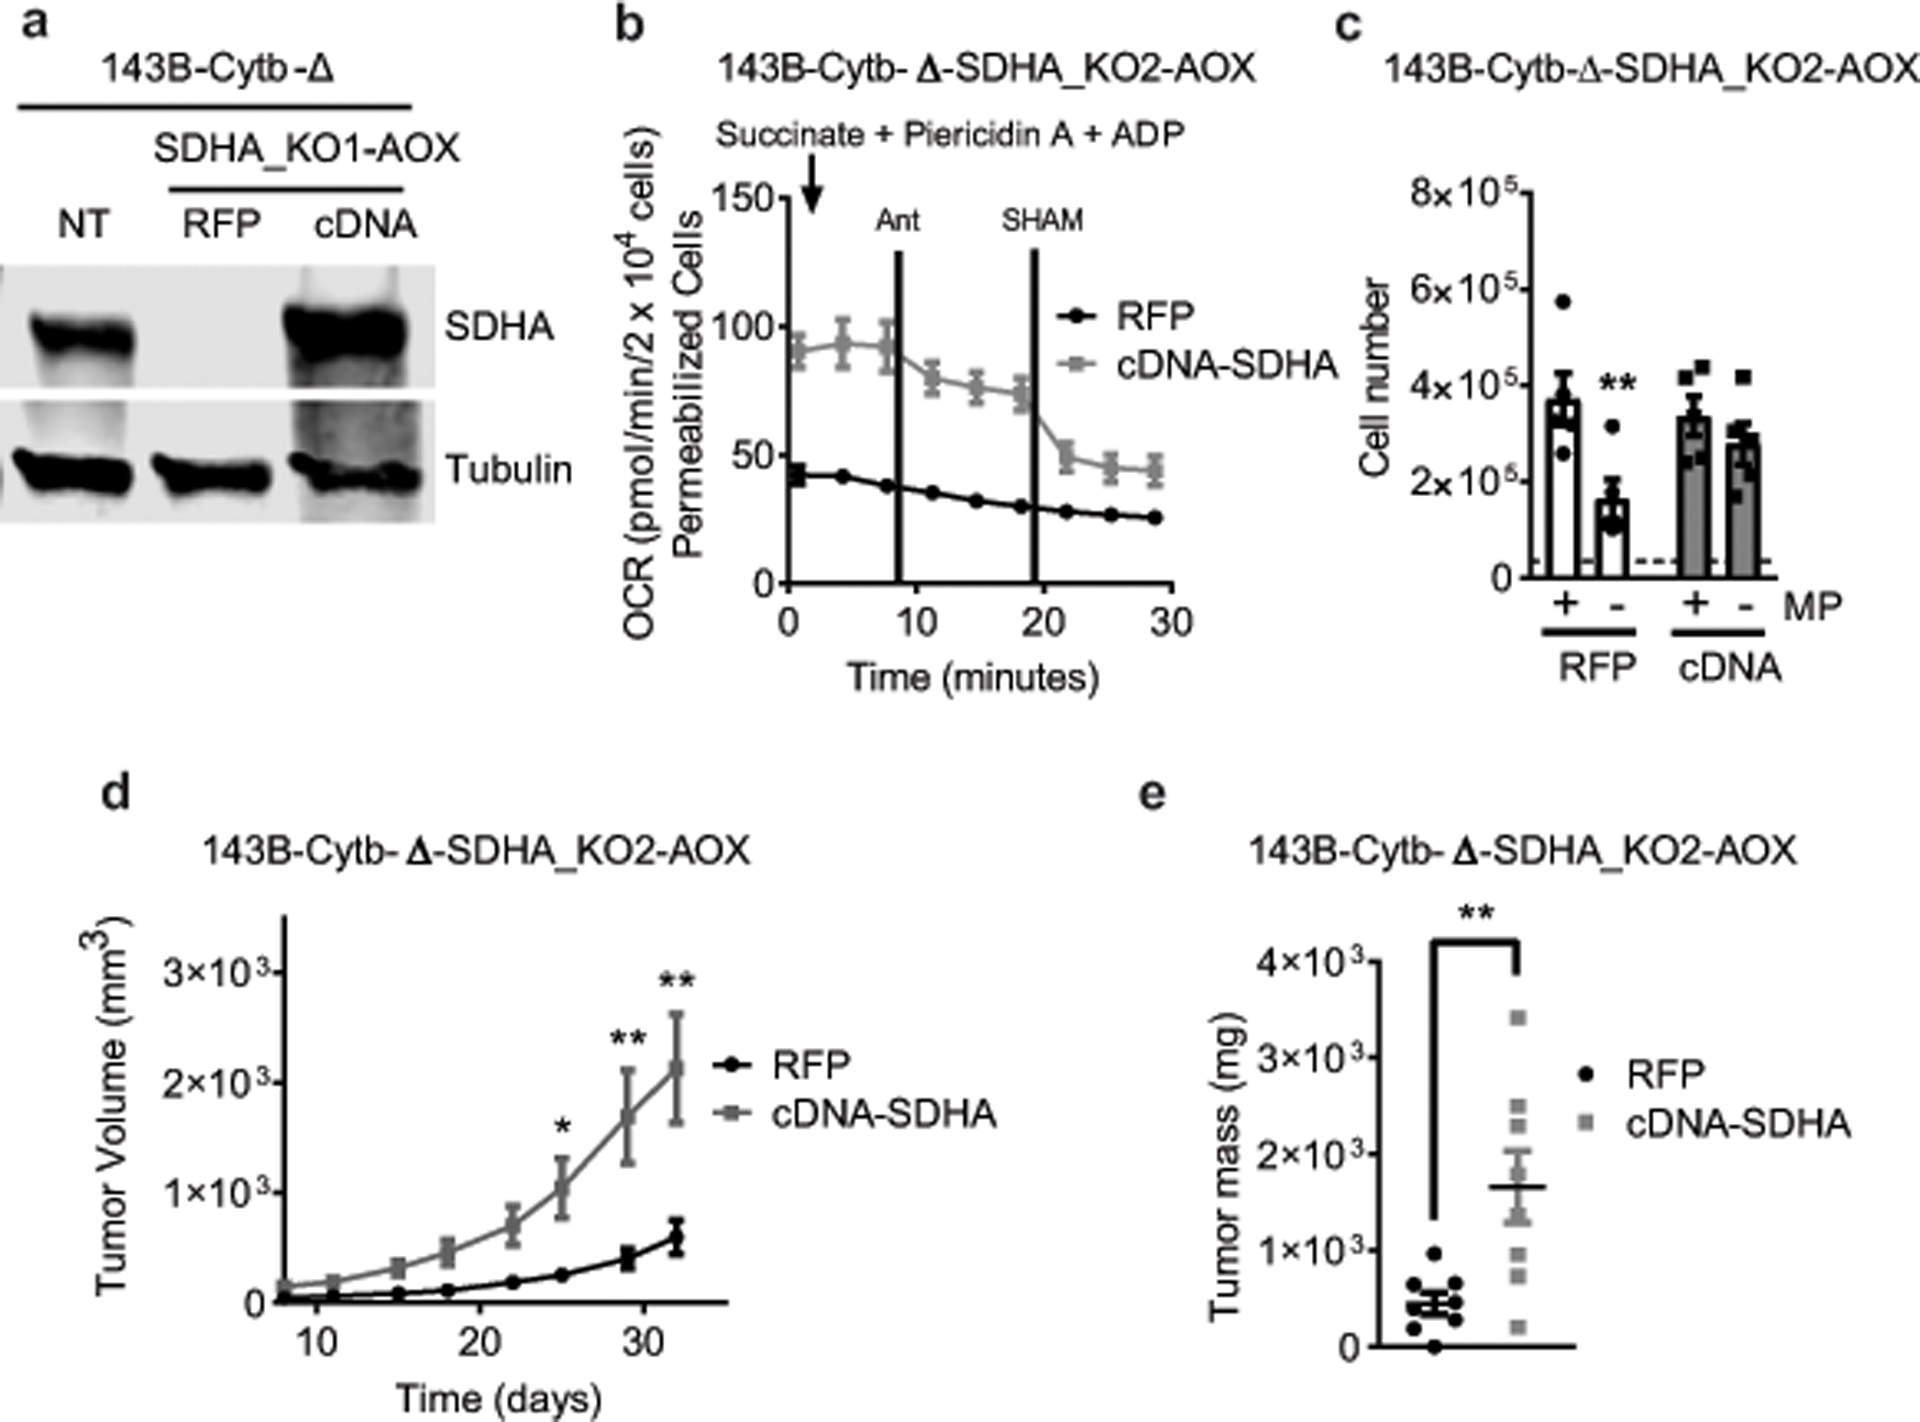
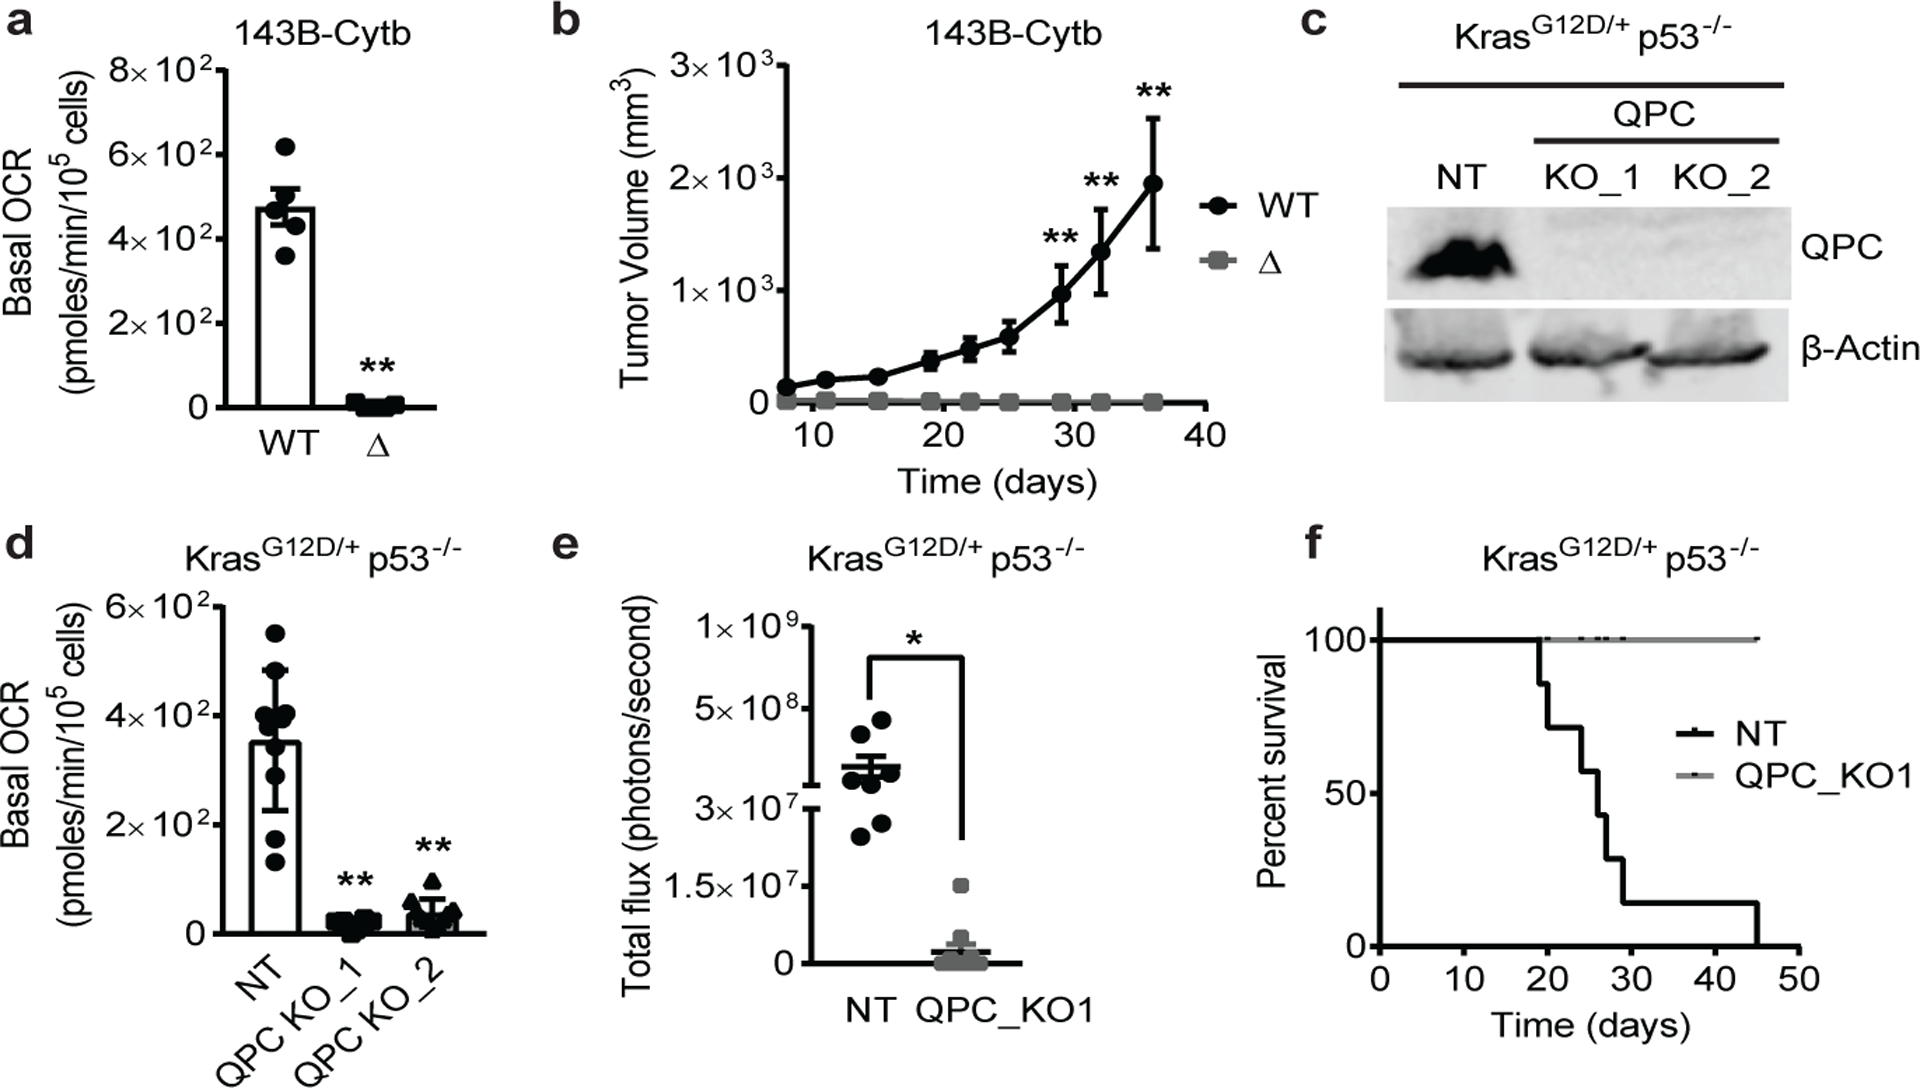
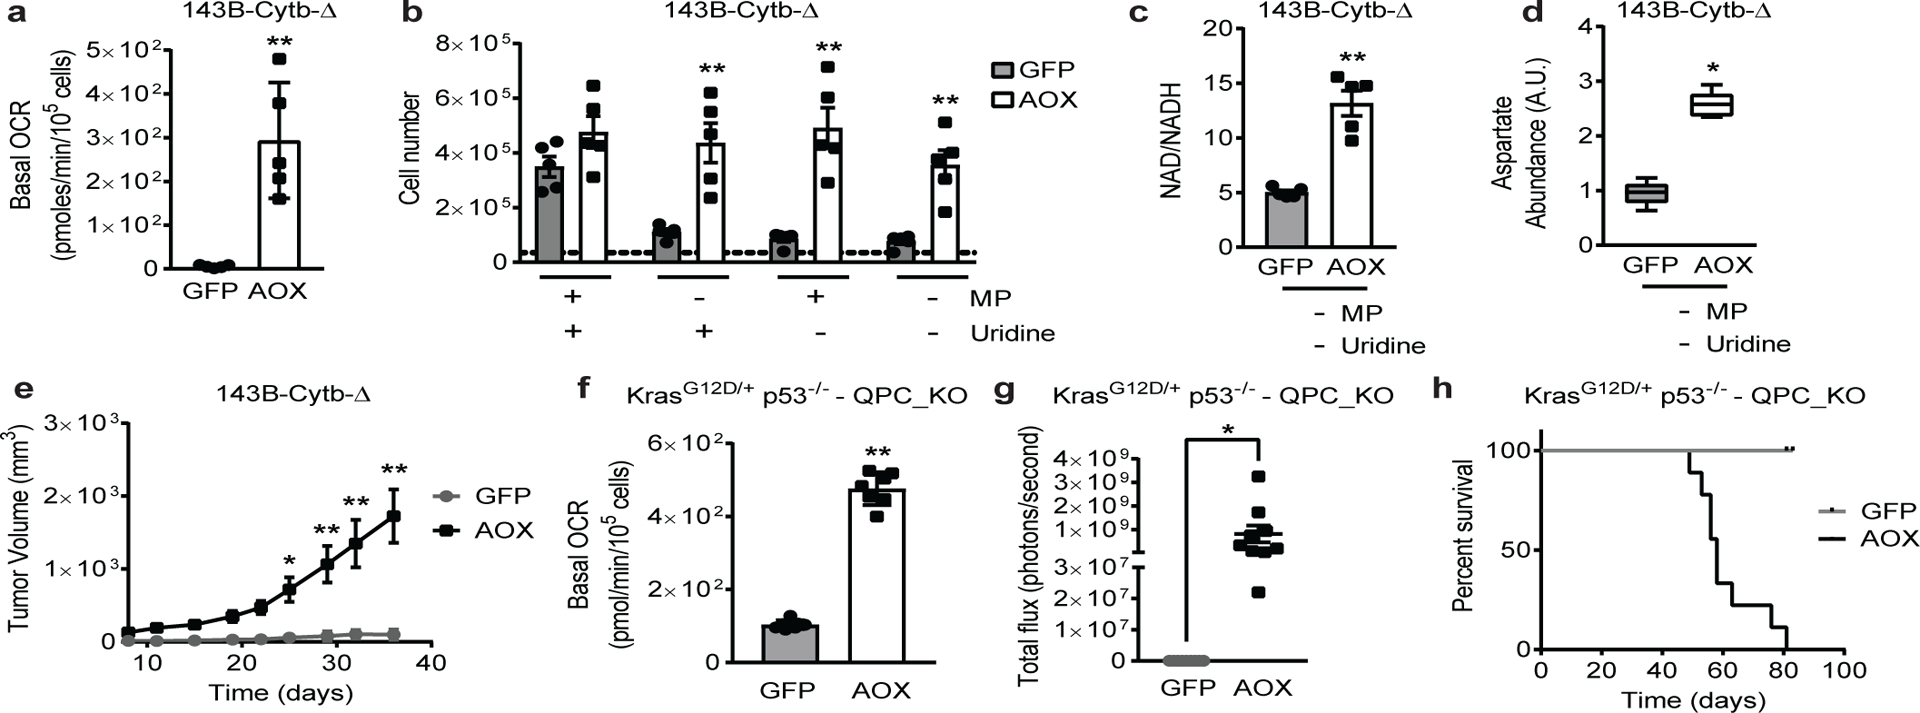
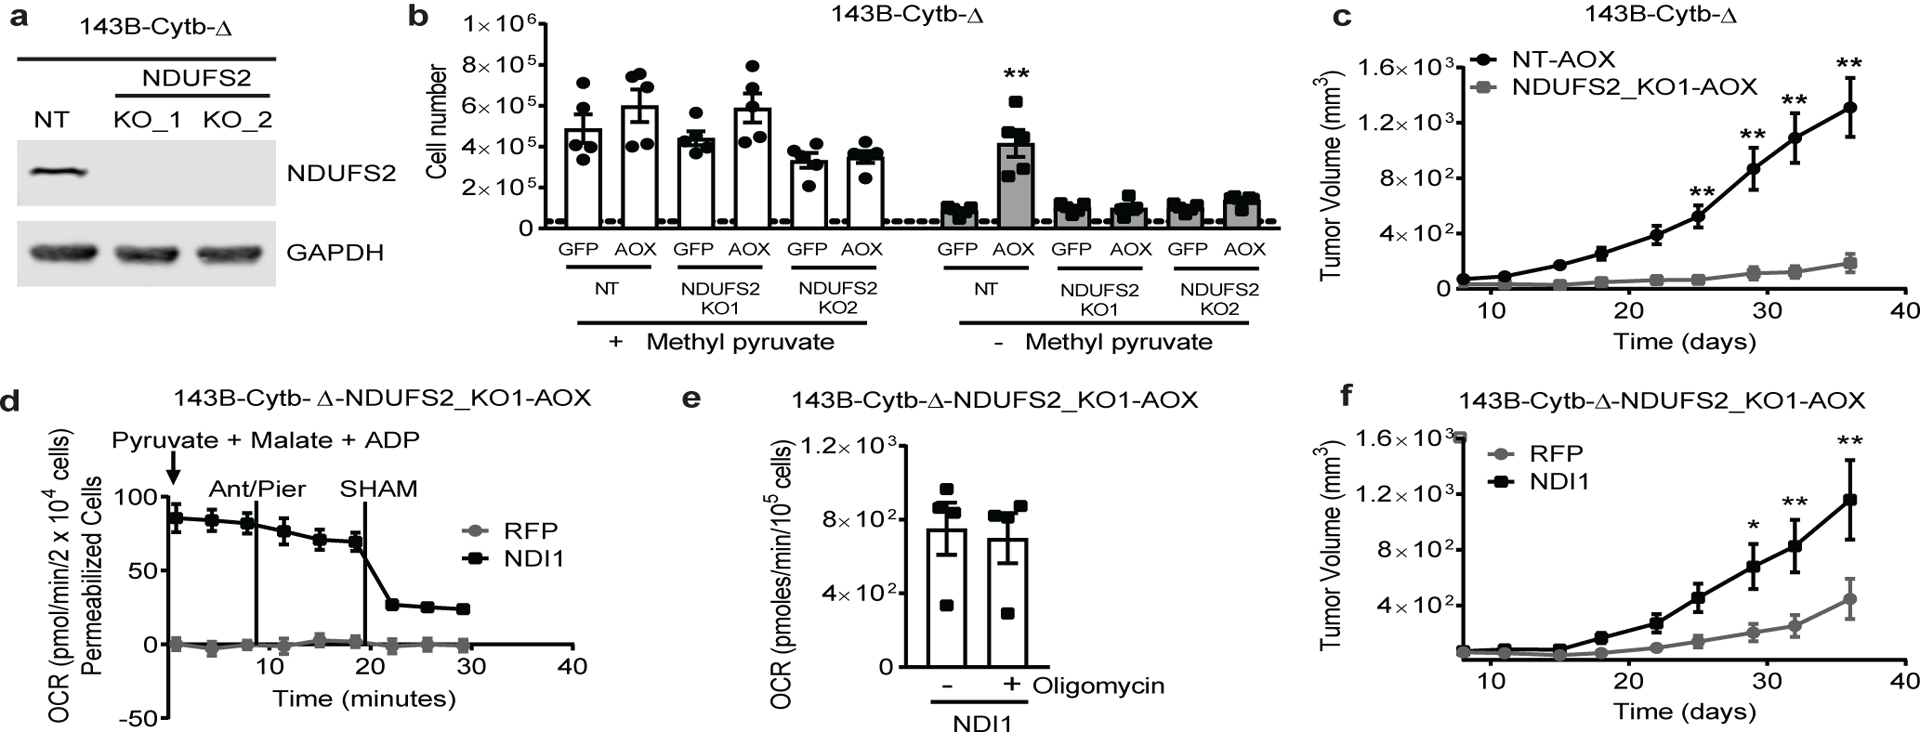
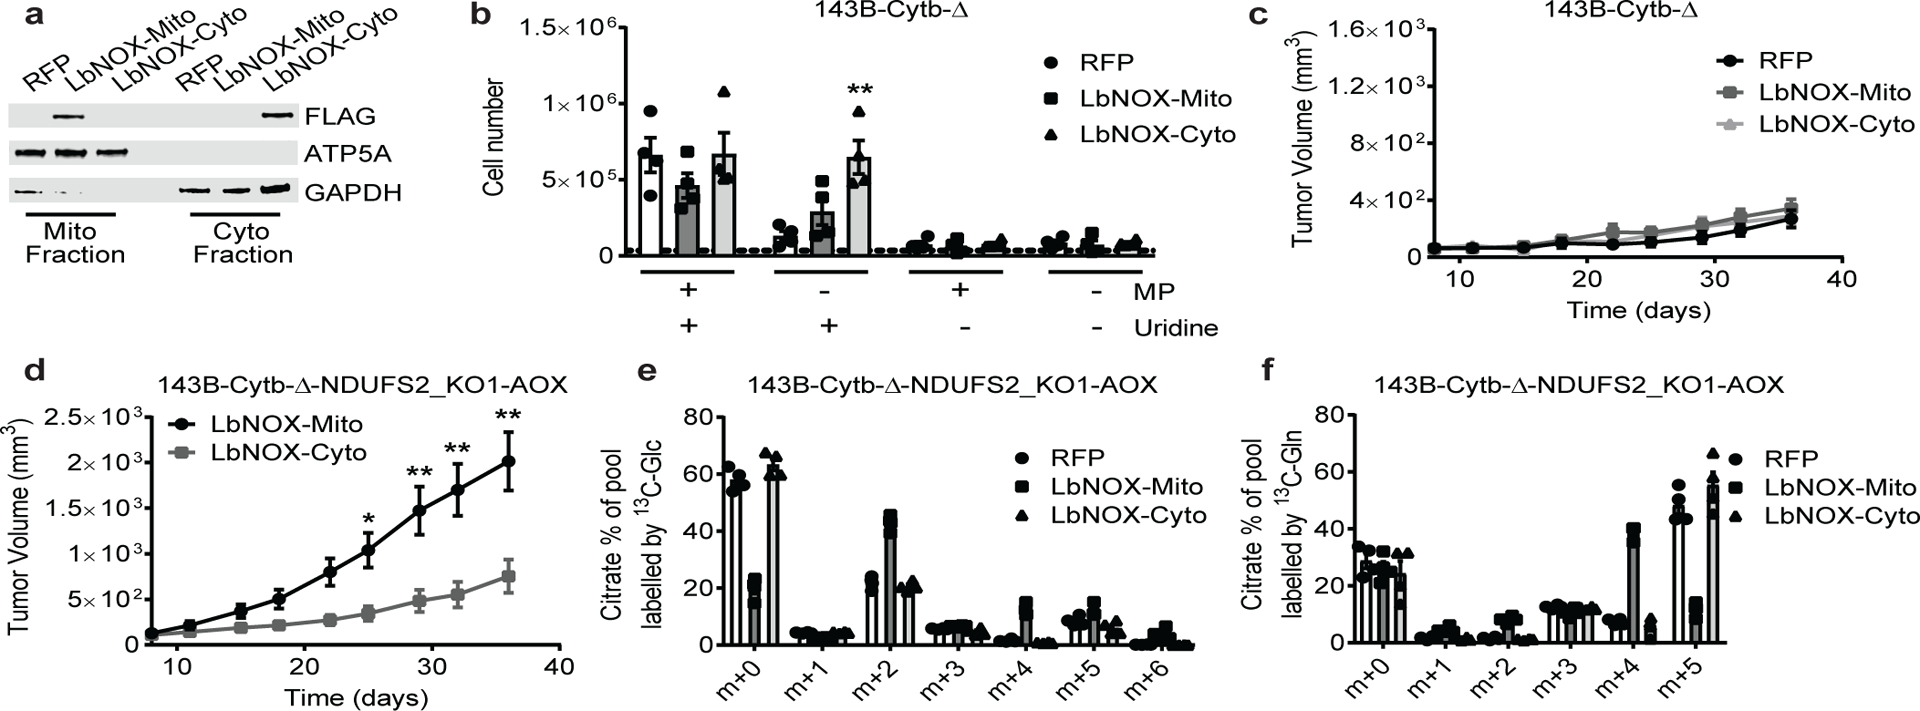
The mitochondrial electron transport chain (ETC) is necessary for tumour growth1-6 and its inhibition has demonstrated anti-tumour efficacy in combination with targeted therapies7-9. Furthermore, human brain and lung tumours display robust glucose oxidation by mitochondria10,11. However, it is unclear why a functional ETC is necessary for tumour growth in vivo. ETC function is coupled to the generation of ATP-that is, oxidative phosphorylation and the production of metabolites by the tricarboxylic acid (TCA) cycle. Mitochondrial complexes I and II donate electrons to ubiquinone, resulting in the generation of ubiquinol and the regeneration of the NAD+ and FAD cofactors, and complex III oxidizes ubiquinol back to ubiquinone, which also serves as an electron acceptor for dihydroorotate dehydrogenase (DHODH)-an enzyme necessary for de novo pyrimidine synthesis. Here we show impaired tumour growth in cancer cells that lack mitochondrial complex III. This phenotype was rescued by ectopic expression of Ciona intestinalis alternative oxidase (AOX)12, which also oxidizes ubiquinol to ubiquinone. Loss of mitochondrial complex I, II or DHODH diminished the tumour growth of AOX-expressing cancer cells deficient in mitochondrial complex III, which highlights the necessity of ubiquinone as an electron acceptor for tumour growth. Cancer cells that lack mitochondrial complex III but can regenerate NAD+ by expression of the NADH oxidase from Lactobacillus brevis (LbNOX)13 targeted to the mitochondria or cytosol were still unable to grow tumours. This suggests that regeneration of NAD+ is not sufficient to drive tumour growth in vivo. Collectively, our findings indicate that tumour growth requires the ETC to oxidize ubiquinol, which is essential to drive the oxidative TCA cycle and DHODH activity.


Conflict of interest statement

Competing interests: Navdeep S. Chandel is SAB member of Rafael Pharmaceuticals.

Figures

Extended Figure 1:
Extended Figure 1:. Metabolite changes in complex III deficient cells in the presence or absence of pyruvate and uridine.
a,b, Schematic representation of the ETC in 143B-Cytb-WT (a) and 143B-Cytb-Δ cells (b). c, Coupled OCR of 143B-Cytb-WT and 143B-Cytb-Δ cells (n=5 biologically independent experiments). d, 143B-Cytb-WT and 143B-Cytb-Δ cells were grown in the presence or absence of methyl pyruvate and/or uridine and cell number was assessed after 72h (n=5 biologically independent experiments). e, Intracellular aspartate levels in the presence of methyl pyruvate and uridine in 143B-Cytb-WT and 143B-Cytb-Δ cells (n=4 biologically independent experiments). f, Intracellular aspartate levels in the absence of methyl pyruvate and uridine in 143B-Cytb-WT and 143B-Cytb-Δ cells (n=5 biologically independent experiments). g, Intracellular NAD+/NADH ratio in the absence of methyl pyruvate and uridine of 143B-Cytb-WT and 143B-Cytb-Δ cells (n=5 biologically independent experiments). h, The heat map displays the relative abundance of significantly changed metabolites in 143B-Cytb-WT, 143B-Cytb-Δ cells and in 143B-Cytb-Δ cells expressing either GFP or AOX in the absence of methyl pyruvate and uridine. A red-blue color scale depicts the abundance of the metabolites (Red: high, Blue: low), (n=5 biologically independent experiments). i, The heat map displays the relative abundance of significantly changed metabolites in 143B-Cytb-WT and 143B-Cytb-Δ cells in the presence of methyl pyruvate and uridine (n=4 biologically independent experiments). j, Tumor mass of xenografts from 143B-Cytb-WT and 143B-Cytb-Δ cells (n=10 mice per group from two independent cohorts). k, Coupled OCR of KP-NT and KP-QPC_KOs cells (n=10 technical replicates from two independent experiments). Data represent mean ± s.e.m. (c-g, j) or mean ± s.d. (k). Statistical significance was determined using two-tailed t-tests (c, g, j), 2-way ANOVA (d) with a Bonferroni test for multiple comparisons or 1-way ANOVA (k) with a Bonferroni test for multiple comparisons (*p < 0.05; **p < 0.01, exact P values in Source Data). Metabolites levels were analyzed with multiple one-way ANOVA using an FDR of 0.1 and Fisher’s least significant difference test post-hoc analyses Q=10%. For 2-group heatmap, t-tests with an FDR cutoff of 0.1 were used to identify significantly changed metabolites. Each row was analyzed individually. (*Q<.1, exact Q values in Source Data).
Extended Figure 2:
Extended Figure 2:. Mitochondrial complex III is required for T-ALL growth in vivo.
a, Schematic representation of the T-ALL experiments. b, c, Percentage of GFP+ T-ALL cells from the spleen (b) or bone marrow (c) of QPC-WT and QPC-KO recipients (WT: n = 7; KO: n = 5 mice). d, e, The absolute number of GFP+ T-ALL cells from the spleen (d) or bone marrow (e) of QPC-WT and QPC-KO recipients (WT: n = 7; KO: n = 5 mice). f, Weight of spleens from QPC-WT and QPC-KO recipients (WT: n = 6; KO: n = 4 mice). g, Survival of mice injected with QPC-WT or QPC-KO T-ALL cells (WT: n = 7; KO: n = 4 mice). Data represent mean ± s.e.m from three independent experiments. Statistical significance was determined using two-tailed t-tests with a Welch’s correction (*p < 0.05; **p < 0.01 exact P values in Source Data). Survival curves were compared using the log-rank test (p<0.0001).
Extended Figure 3:
Extended Figure 3:. Complex III deficient cells are auxotrophic for uridine.
a, Schematic representation of the ETC in AOX expressing 143B-Cytb-Δ cells. b, Coupled OCR of 143B-Cytb-Δ-GFP and 143B-Cytb-Δ-AOX cells (n=5 biologically independent experiments). c, Tumor mass of xenografts from 143B-Cytb-Δ-GFP and 143B-Cytb-Δ-AOX cells (n=9 mice per group from two independent cohorts). d, Coupled OCR of KP-QPC_KO-GFP and KP-QPC_KO-AOX cells (n=7 replicates from one representative of 5 biologically independent experiments). e, 143B-Cytb-WT treated or untreated with Piericidin A (0.5 μM) or Antimycin A (0.5 μM) were grown in the presence or absence of methyl pyruvate and/or uridine and cell number was assessed after 72h (n=4 biologically independent experiments). f, The dihydroorotate to orotate ratio was assessed in 143B-Cytb-WT treated or untreated with Piericidin A (0.5 μM) or Antimycin A (0.5 μM) (n=6 biologically independent experiments). Data represent mean ± s.e.m. (b, c, e, f) or mean ± s.d. (d). Statistical significance was determined using two-tailed t-tests (b, c, d), 2-way ANOVA (e) with a Bonferroni test for multiple comparisons or 1-way ANOVA (f) with a Bonferroni test for multiple comparisons (*p < 0.05; **p < 0.01, exact P values in Source Data).
Extended Figure 4:
Extended Figure 4:. De novo pyrimidine synthesis is necessesary for tumor growth.
a, Schematic representation of the ETC in 143B-Cytb-Δ-AOX-DHODH_KO cells. b, Western blot analysis of DHODH in 143B-Cytb-Δ non targeting (NT) and 143B-Cytb-Δ-DHODH_KOs cells. Tubulin was used as a loading control. Data representative of two independent experiments. c, 143B-Cytb-Δ-NT or 143B-Cytb-Δ-DHODH-KOs expressing GFP or AOX were grown in the presence or absence of uridine and cell number was assessed after 72h (n=5 biologically independent experiments). d,e, Average tumor volume (d) and tumor mass (e) of xenografts from 143B-Cytb-Δ-NT-AOX and 143B-Cytb-Δ-DHODH_KO2-AOX cells (n=10 mice per group from two independent cohorts). f, Western blot analysis of DHODH protein levels in 143B-Cytb-Δ-NT, 143B-Cytb-Δ-DHODH_KO2-AOX-RFP and 143B-Cytb-Δ-DHODH_KO2-AOX-cDNA DHODH cells. Data representative of three independent experiments. g, 143B-Cytb-Δ-DHODH_KO2-AOX-RFP and 143B-Cytb-Δ-DHODH_KO2-AOX-cDNA DHODH cells were grown in the presence or absence of uridine and cell number was assessed after 72h (n=5 biologically independent experiments). h,i, Average tumor volume (h) and tumor mass (i) of xenografts from 143B-Cytb-Δ-DHODH_KO2-AOX-RFP and 143B-Cytb-Δ-DHODH_KO2-AOX-cDNA DHODH cells (n=9 mice per group from two independent cohorts). Data represent mean ± s.e.m. (c-e, g-i) Statistical significance was determined using two-tailed t-tests (e, i) or 2-way ANOVA (c,d,g,h) with a Bonferroni test for multiple comparisons (*p < 0.05; **p < 0.01, exact P values in Source Data). For gel source data, see Supplemental Figure 4.
Extended Figure 5:
Extended Figure 5:. Restoration of complex I by ectopic expression of NDUFS2 cDNA rescues tumor growth.
a, Schematic representation of the ETC in complex I deficient 143B-Cytb-Δ-NDUFS2_KO-AOX cells. b, Tumor mass of xenografts from 143B-Cytb-Δ-NT-AOX and 143B-Cytb-Δ-NDUFS2_KO1-AOX cells (n=10 mice per group from two independent cohorts). c, Western blot analysis of NDUFS2 protein levels in 143B-Cytb-Δ-NT, and in AOX expressing 143B-Cytb-Δ-NDUFS2_KO1 clone transduced with either RFP or human NDUFS2 cDNA. GAPDH was used as a loading control. Data representative of two independent experiments. d, Basal oxygen consumption rate of AOX expressing 143B-Cytb-Δ-NDUFS2_KO1 cells transduced with either RFP or human NDUFS2 cDNA. e,143B-Cytb-Δ-NDUFS2_KO1-AOX-RFP and 143B-Cytb-Δ-NDUFS2_KO1-AOX-cDNA NDUFS2 cells were grown in the presence or absence of methyl pyruvate and cell number was assessed after 72h (n=5 biologically independent experiments). f,g, Average tumor volume (f) and tumor mass (g) of xenografts from AOX expressing 143B-Cytb-Δ-NDUFS2_KO1 cells transduced with either RFP or human NDUFS2 cDNA (n=9 mice per group from two independent cohorts). Data represent mean ± s.e.m. (b,d-g). Statistical significance was determined using two-tailed t-tests (b,d,g) or 2-way ANOVA (e,f) with a Bonferroni test for multiple comparisons (*p < 0.05; **p < 0.01, exact P values in Source Data). For gel source data, see Supplemental Figure 2.
Extended Figure 6:
Extended Figure 6:. NDI1 expression in complex I deficient cells rescues electron transfer but not ATP production.
a, Schematic representation of the ETC in complex I deficient 143B-Cytb-Δ-NDUFS2_KO-AOX cells expressing NDI1. b, 143B-Cytb-Δ-NDUFS2_KO1-AOX-RFP and 143B-Cytb-Δ-NDUFS2_KO1-AOX-NDI1 cells were grown in the presence or absence of methyl pyruvate and cell number was assessed after 72h (n=6 biologically independent experiments). c, The heat map displays the relative abundance of significantly changed metabolites in 143B-Cytb-Δ-NDUFS2-KO1 cells expressing RFP, NDI1 or LbNOX in either mitochondria or cytosol (n=4 biologically independent experiments). A red-blue color scale depicts the abundance of the metabolites (Red: high, Blue: low). Metabolites levels were analyzed with multiple one-way ANOVA using an FDR of 0.1 and Fisher’s least significant difference test post-hoc analyses Q=10%. Each row was analyzed individually. (*Q<.1, exact Q values in Source Data). d, 143B-Cytb-Δ-NT-AOX, 143B-Cytb-Δ-NDUFS2_KO1-AOX-RFP and 143B-Cytb-Δ-NDUFS2_KO1-AOX-NDI1 cells were grown in media containing 10 mM glucose or 10 mM galactose for 48 hr and assessed for cell death (n=4 biologically independent experiments). e, Tumor mass of xenografts from 143B-Cytb-Δ-NDUFS2_KO1 cells expressing AOX and either RFP or NDI1 (n=10 mice per group from two independent cohorts). Data represent mean ± s.e.m. (b, d, e). Statistical significance was determined using two-tailed t-tests (e) or 2-way ANOVA (b,d) with a Bonferroni test for multiple comparisons (*p < 0.05; **p < 0.01, exact P values in Source Data).
Extended Figure 7:
Extended Figure 7:. LbNOX expression in mitochondria or cytosol promotes major changes in the metabolome of complex III deficient cells.
a, Schematic representation of the ETC in 143B-Cytb-Δ cells expressing LbNOX in mitochondria. b, Intracellular NAD+/NADH ratio in 143B-Cytb-Δ-RFP, 143B-Cytb-Δ-LbNOX-Mito and 143B-Cytb-Δ-LbNOX-Cyto cells in the absence of methyl pyruvate (n=5 biologically independent experiments). c,d,e, Intracellular aspartate (c), succinate (d) and α-ketoglutarate levels (e) in 143B-Cytb-Δ-RFP, 143B-Cytb-Δ-LbNOX-Mito and 143B-Cytb-Δ-LbNOX-Cyto cells in the absence of methyl pyruvate (n=5 biologically independent experiments). f, The heat map displays the relative abundance of significantly changed metabolites in 143B-Cytb-Δ-RFP, 143B-Cytb-Δ-LbNOX-Mito and 143B-Cytb-Δ-LbNOX-Cyto cells in the absence of methyl pyruvate (n=5 biologically independent experiments). A red-blue color scale depicts the abundance of the metabolites (Red: high, Blue: low). g, Tumor mass of xenografts from 143B-Cytb-Δ-RFP, 143B-Cytb-Δ-LbNOX-Mito, and 143B-Cytb-Δ-LbNOX-Cyto cells (n=9 mice per group from two independent cohorts). Data represent mean ± s.e.m. (b-e, g); statistical significance was determined using 1-way ANOVA (b,g) with a Bonferroni test for multiple comparisons (*p < 0.05; **p < 0.01, exact P values in Source Data). Metabolites levels (c,d,e,f) were analyzed with multiple one-way ANOVA using an FDR of 0.1 and Fisher’s least significant difference test post-hoc analyses Q=10%. Each row was analyzed individually. (*Q<.1, exact Q values in Source Data).
Extended Figure 8:
Extended Figure 8:. LbNOX expression in mitochondria or cytosol promotes major changes in the metabolome of complex I deficient cells.
a, Schematic representation of the ETC in 143B-Cytb-Δ-NDUFS2_KO-AOX cells expressing LbNOX in mitochondria. b, 143B-Cytb-Δ-NDUFS2_KO1-AOX-LbNOX-Mito and 143B-Cytb-Δ-NDUFS2_KO1-AOX-LbNOX-Cyto were grown in the presence or absence of methyl pyruvate and cell number was assessed after 72h (n=5 biologically independent experiments). c, Intracellular NAD+/NADH ratio of 143B-Cytb-Δ-NDUFS2_KO1-AOX-RFP, 143B-Cytb-Δ-NDUFS2_KO1-AOX-LbNOX-Mito, and 143B-Cytb-Δ-NDUFS2_KO1-AOX-LbNOX-Cyto cells in the absence of methyl pyruvate and uridine (n=4 biologically independent experiments). d, Intracellular aspartate levels of 143B-Cytb-Δ-NDUFS2_KO1-AOX-RFP, 143B-Cytb-Δ-NDUFS2_KO1-AOX-LbNOX-Mito and 143B-Cytb-Δ-NDUFS2_KO1-AOX-LbNOX-Cyto cells in the absence of methyl pyruvate and uridine (n=4 biologically independent experiments). e, 143B-Cytb-Δ-NDUFS2_KO1-AOX-LbNOX-Mito and 143B-Cytb-Δ-NDUFS2_KO1-AOX-LbNOX-Cyto cells were grown in media containing 10 mM glucose or 10 mM galactose for 48 hr and assessed for cell death (n=4 biologically independent experiments). f, Tumor mass of xenografts from 143B-Cytb-Δ-NDUFS2_KO1-AOX cells expressing LbNOX in either mitochondria or cytosol (n=10 mice per group from two independent cohorts). g, Western blot analysis (data representative of two independent experiments) of LbNOX expression in xenograft tumors from 143B-Cytb-Δ-NDUFS2_KO1-AOX-RFP, 143B-Cytb-Δ-NDUFS2_KO1-AOX-LbNOX-Mito and 143B-Cytb-Δ-NDUFS2_KO1-AOX-LbNOX-Cyto cells. Tubulin was used as a loading control. Data represent mean ± s.e.m. (b-f). Statistical significance was determined using two-tailed t-tests (f), 1-way ANOVA (c) with a Bonferroni test for multiple comparisons or a 2-way ANOVA (b, e) with a Bonferroni test for multiple comparisons (*p < 0.05; **p < 0.01, exact P values in Source Data). Metabolites levels (d) were analyzed with multiple one-way ANOVA using an FDR of 0.1 and Fisher’s least significant difference test post-hoc analyses Q=10%. Each row was analyzed individually. (*Q<.1, exact Q values in Source Data). For gel source data, see Supplemental Figure 5.
Extended Figure 9:
Extended Figure 9:. Complex I deficient cells expressing LbNOX in the cytosol perform glutamine reductive carboxylation.
a, Schematic representation for oxidative and reductive glutamine metabolism. Metabolism of [U-13C]glutamine generates fully labeled α-ketoglutarate. Oxidation of α-ketoglutarate in the TCA cycle produces metabolites with four 13C-carbons (m+4), while reduction of α-ketoglutarate through the reductive carboxylation pathway produces citrate with five 13C-carbons (m+5). Further reductive metabolism of the m+5 citrate yields metabolites with three 13C-carbons (m+3). b-h, 143B-Cytb-Δ-NDUFS2_KO1-AOX-RFP, 143B-Cytb-Δ-NDUFS2_KO1-AOX-LbNOX-Mito, and 143B-Cytb-Δ-NDUFS2_KO1-AOX-LbNOX-Cyto cells were labeled for six hours with [U-13C]glutamine in the presence (b-d) or absence of methyl pyruvate (e-h), and percentage of labeled metabolite pools were examined. m+5 and m+3 pools result from glutamine flow through reductive metabolism. m+4 pools result from glutamine flow through oxidative metabolism. Data represent mean ± s.e.m. of 4 biologically independent experiments.
Extended Figure 10:
Extended Figure 10:. Complex II is necessary for tumor growth.
a, Schematic representation of the ETC in complex II deficient 143B-Cytb-Δ cells expressing AOX. b, Western blot analysis of SDHA in 143B-Cytb-Δ non targeting (NT) and 143B-Cytb-Δ-SDHA_KOs cells. Tubulin was used as a loading control. Data representative of two independent experiments. c, Complex II driven oxygen consumption rate of permeabilized 143B-Cytb-Δ-NT-AOX and 143B-Cytb-Δ-SDHA_KO2-AOX cells. Piericidin A (1 μM) and Antimycin A (1 μM) were used to inhibit complex I and III respectively. SHAM (2 mM) was used to inhibit AOX activity (n=4 biologically independent experiments). d, 143B-Cytb-Δ-SDHA-KOs expressing GFP or AOX were grown in the presence or absence of methyl pyruvate and cell number was assessed after 72h (n=5 biologically independent experiments). e,f, Average tumor volume (e) and tumor mass (f) of xenografts from 143B-Cytb-Δ-NT-AOX and 143B-Cytb-Δ-SDHA_KO2-AOX cells (n=8 mice per group from two independent cohorts). Data represent mean ± s.e.m. (c-f). Statistical significance was determined using two-tailed t-tests (f) or 2-way ANOVA (d,e) with a Bonferroni test for multiple comparisons (*p < 0.05; **p < 0.01, exact P values in Source Data). For gel source data, see Supplemental Figure 6.
Extended Figure 11:
Extended Figure 11:. Restoration of complex II by ectopic expression of SDHA cDNA rescues tumor growth.
a, Western blot analysis of SDHA protein levels in 143B-Cytb-Δ-NT, 143B-Cytb-Δ-SDHA_KO2-AOX-RFP and 143B-Cytb-Δ-SDHA_KO2-AOX-cDNA SDHA cells. Data representative of three independent experiments. b, Complex II driven oxygen consumption rate of permeabilized 143B-Cytb-Δ-SDHA_KO2-AOX-RFP and 143B-Cytb-Δ-SDHA_KO2-AOX-cDNA SDHA cells. Succinate and ADP were provided as substrates. Piericidin A (1 μM) and Antimycin A (1 μM) were used to inhibit complex I and III respectively. SHAM (2 mM) was used to inhibit AOX activity (n=4 biologically independent experiments). c, 143B-Cytb-Δ-SDHA_KO2-AOX-RFP and 143B-Cytb-Δ-SDHA_KO2-AOX-cDNA SDHA cells were grown in the presence or absence of methyl pyruvate and cell number was assessed after 72h (n=5 biologically independent experiments). d,e, Average tumor volume (d) and tumor mass (e) of xenografts from 143B-Cytb-Δ-SDHA_KO2-AOX-RFP and 143B-Cytb-Δ-SDHA_KO2-AOX-cDNA SDHA cells (n=8 mice per group from two independent cohorts). Data represent mean ± s.e.m. (b-e). Statistical significance was determined using two-tailed t-tests (e) or 2-way ANOVA (c,d) with a Bonferroni test for multiple comparisons (*p < 0.05; **p < 0.01, exact P values in Source Data). For gel source data, see Supplemental Figure 6.
Figure 1:
Figure 1:. Complex III is necessary for tumor growth.
a, Basal OCR of 143B-Cytb-WT and 143B-Cytb-Δ cells (n=5 biologically independent experiments). b, Average tumor volume of xenografts from 143B-Cytb-WT and 143B-Cytb-Δ cells (n=10 mice). c, Western blot analysis of QPC in KP-non targeting (NT) and knockout (KO) clones. β-Actin used as a loading control. d, Basal OCR of KP-NT and KP-QPC_KOs cells (n=10 replicates from two independent experiments). e, Luminescence values from the tumors. Values between day 19 and day 33 post-implantation with KP-NT cells (n=7 mice), or day 33 post-implantation with KP-QPC_KO cells (n=10 mice). f, Survival of mice implanted with KP-NT (n=7) and QPC_KO cells (n=10). Data represent mean ± s.e.m. (a, b, e) or mean ± s.d. (d). Statistical significance was determined using two-tailed t-tests (a,e), 2-way ANOVA (b) with a Bonferroni test for multiple comparisons and 1-way ANOVA (d) with a Bonferroni test for multiple comparisons (*p < 0.05; **p < 0.01, exact P values in Source Data). Survival curves were compared using the log-rank test (p<0.0001). Tumor studies are from two independent cohorts. For gel source data, see Supplemental Figure 1.
Figure 2:
Figure 2:. Ubiquinol oxidation by complex III is necessary for tumor growth.
a, Basal OCR of 143B-Cytb-Δ-GFP and 143B-Cytb-Δ-AOX cells (n=5 biologically independent experiments). b, 143B-Cytb-Δ-GFP and 143B-Cytb-Δ-AOX cells were grown in the presence or absence of methyl pyruvate and/or uridine and cell number was assessed after 72h (n=5 biologically independent experiments). c,d, Intracellular NAD+/NADH ratio (c) and aspartate levels (d) of 143B-Cytb-Δ-GFP and 143B-Cytb-Δ-AOX cells in the absence of methyl pyruvate and uridine (n=5 biologically independent experiments). e, Average tumor volume of xenografts from 143B-Cytb-Δ-GFP and 143B-Cytb-Δ-AOX cells (n=9 mice). f, Basal OCR of KP-QPC_KO-GFP and KP-QPC_KO-AOX cells (n=7 technical replicates; representative of five biologically independent experiments). g, Luminescence values from the tumors. Values prior to euthanasia between day 49 and day 83 post-implantation with KP-QPC_KO-AOX, or day 81 or 83 post-implantation with KP-QPC_KO-GFP cells (n=9 mice). h, Survival of mice implanted with KP-QPC_KO-GFP and KP-QPC_KO-AOX cells. (n=9 mice). Data represent mean ± s.e.m. (a-e, g) or mean ± s.d. (f). Statistical significance was determined using two-tailed t-tests (a, c, f, g) or 2-way ANOVA (b, e) with a Bonferroni test for multiple comparisons (*p < 0.05; **p < 0.01, exact P values in Source Data). Survival curves were compared using the log-rank test (p<0.0001). Aspartate levels (d) were analyzed with multiple one-way ANOVA using an FDR of 0.1 and Fisher’s least significant difference test post-hoc analyses Q=10%. (*Q<.1 0.001, exact Q values in Source Data). Tumor studies are from two independent cohorts.
Figure 3:
Figure 3:. Complex I is necessary for tumor growth.
a, Western blot analysis of NDUFS2 protein levels in 143B-Cytb-Δ non targeting (NT) and 143B-Cytb-Δ-NDUFS2_KOs cells. GAPDH used as a loading control. Representative of two independent experiments. b, 143B-Cytb-Δ-NT and 143B-Cytb-Δ-NDUFS2_KOs cells expressing either GFP or AOX were grown in media containing uridine and in the presence or absence of methyl pyruvate and cell number was assessed after 72h. (n=5 biologically independent experiments). c, Average tumor volume of xenografts from 143B-Cytb-Δ-NT-AOX and 143B-Cytb-Δ-NDUFS2_KO1-AOX cells (n=10 mice). d, Complex I driven oxygen consumption rate of permeabilized 143B-Cytb-Δ-NDUFS2_KO1 cells expressing AOX and either RFP or NDI1. Piericidin A (1 μM) and Antimycin A (1 μM) were used to inhibit complex I and III respectively. SHAM (2 mM) was used to inhibit AOX activity (n=6 biologically independent experiments). e, OCR in the presence or absence of oligomycin in 143B-Cytb-Δ-NDUFS2_KO1 cells expressing AOX and NDI1 (n=4 biologically independent experiments). f, Average tumor volume of xenografts from 143B-Cytb-Δ-NDUFS2_KO1 cells expressing AOX and either RFP or NDI1 (n=10 mice). Data represent mean ± s.e.m. (b-f). Statistical significance was determined using two-tailed t-tests (e) or 2-way ANOVA (b, c, f) with a Bonferroni test for multiple comparisons (*p < 0.05; **p < 0.01, exact P values in Source Data). For gel source data, see Supplemental Figure 2. Tumor studies are from two independent cohorts.
Figure 4:
Figure 4:. Mitochondrial NAD+ regeneration is necessary but not sufficient for tumor growth in vivo.
a, Subcellular localization of LbNOX in 143B-Cytb-Δ cells determined by cell fractionation. ATP5A is a mitochondrial marker and GAPDH is a cytosolic marker. Representative of three independent experiments. b, 143B-Cytb-Δ-RFP, 143B-Cytb-Δ-LbNOX-Mito and 143B-Cytb-Δ-LbNOX-Cyto were grown in the presence or absence of methyl pyruvate and/or uridine and cell number was assessed after 72h (n=4 biologically independent experiments). c, Average tumor volume of xenografts from 143B-Cytb-Δ-RFP, 143B-Cytb-Δ-LbNOX-Mito, and 143B-Cytb-Δ-LbNOX-Cyto cells (n=9 mice). d, Average tumor volume of xenografts from 143B-Cytb-Δ-NDUFS2_KO1 cells expressing AOX and either LbNOX-Mito or Cyto (n=10 mice). e,f, 143B-Cytb-Δ-NDUFS2_KO1-AOX cells expressing either RFP or LbNOX in mitochondria or cytosol were labeled for 6h with [U-13C]glucose (e) or [U-13C]glutamine (f) in the presence of methyl pyruvate, and percentage of labeled citrate pools was examined. m+0 pools represent unlabeled fractions (n=4 biologically independent experiments) . Data represent mean ± s.e.m. (b-f). Statistical significance was determined using 2-way ANOVA (b, c, d) with a Bonferroni test for multiple comparisons (*p < 0.05; **p < 0.01, exact P values in Source Data). For gel source data, see Supplemental Figure 3. Tumor studies are from two independent cohorts.

References

    1. DeBerardinis RJ & Chandel NS We need to talk about the Warburg effect. Nature Metabolism 2, 127–129, doi:10.1038/s42255-020-0172-2 (2020). - DOI - PubMed
    1. Weinberg F et al. Mitochondrial metabolism and ROS generation are essential for Kras-mediated tumorigenicity. Proc Natl Acad Sci U S A 107, 8788–8793, doi:10.1073/pnas.1003428107 (2010). - DOI - PMC - PubMed
    1. Tan AS et al. Mitochondrial genome acquisition restores respiratory function and tumorigenic potential of cancer cells without mitochondrial DNA. Cell Metab 21, 81–94, doi:10.1016/j.cmet.2014.12.003 (2015). - DOI - PubMed
    1. Ju YS et al. Origins and functional consequences of somatic mitochondrial DNA mutations in human cancer. Elife 3, doi:10.7554/eLife.02935 (2014). - DOI - PMC - PubMed
    1. Kuntz EM et al. Targeting mitochondrial oxidative phosphorylation eradicates therapy-resistant chronic myeloid leukemia stem cells. Nat Med 23, 1234–1240, doi:10.1038/nm.4399 (2017). - DOI - PMC - PubMed

Publication types

MeSH terms