. 2020 May 30;10(16):7111-7130.
doi: 10.7150/thno.45286. eCollection 2020.

Fgfr3 mutation disrupts chondrogenesis and bone ossification in zebrafish model mimicking CATSHL syndrome partially via enhanced Wnt/β-catenin signaling

Affiliations

Fgfr3 mutation disrupts chondrogenesis and bone ossification in zebrafish model mimicking CATSHL syndrome partially via enhanced Wnt/β-catenin signaling

Xianding Sun et al. Theranostics. .

Abstract

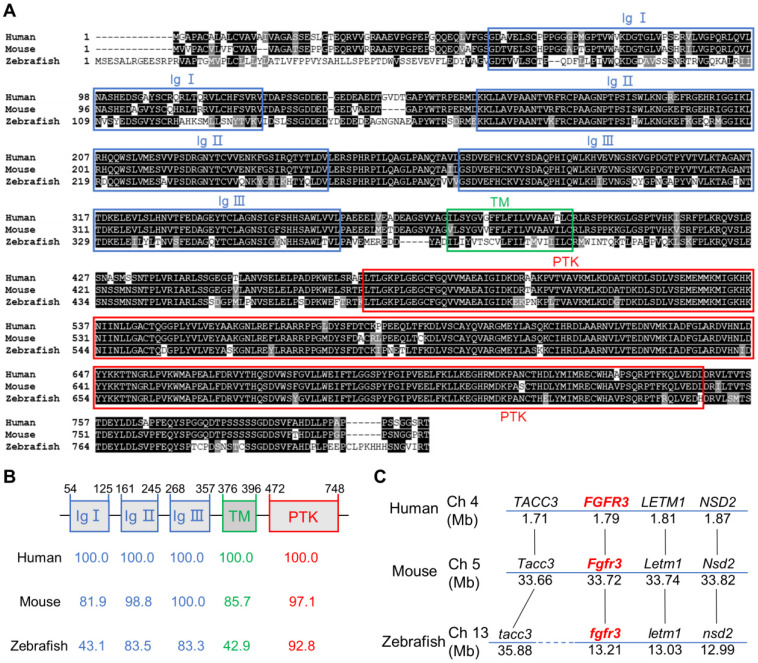
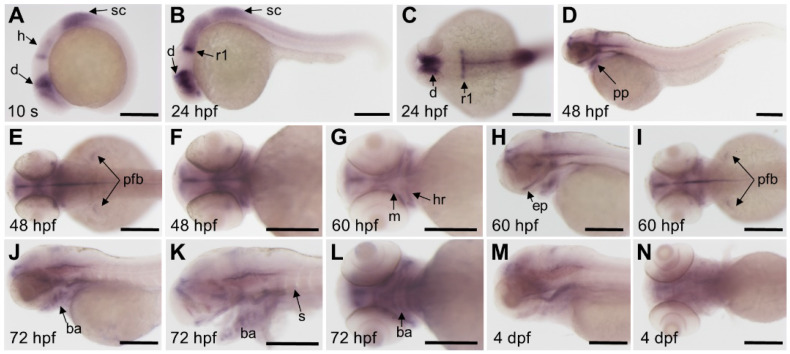
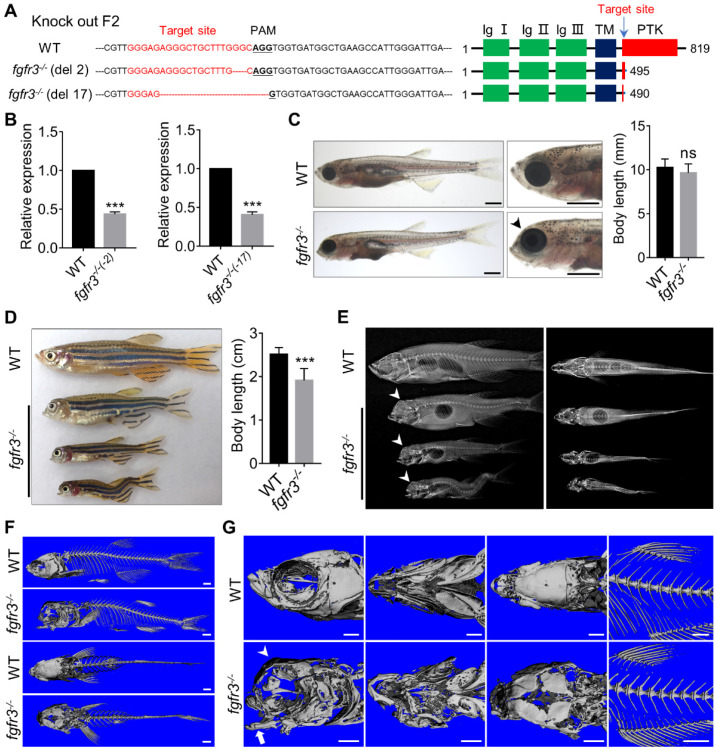
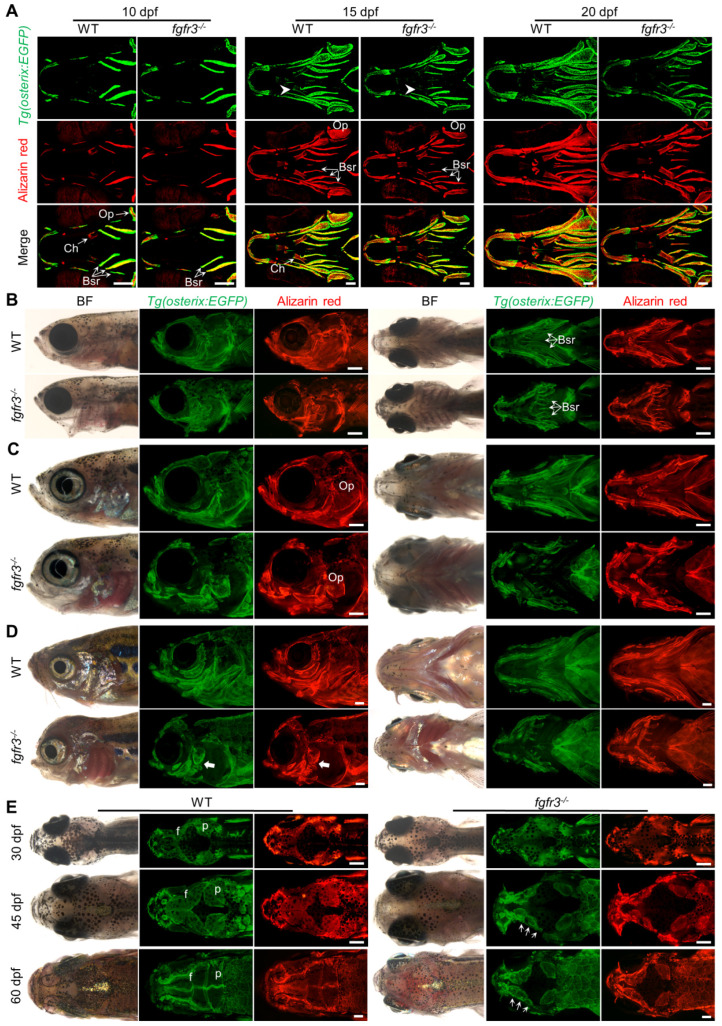
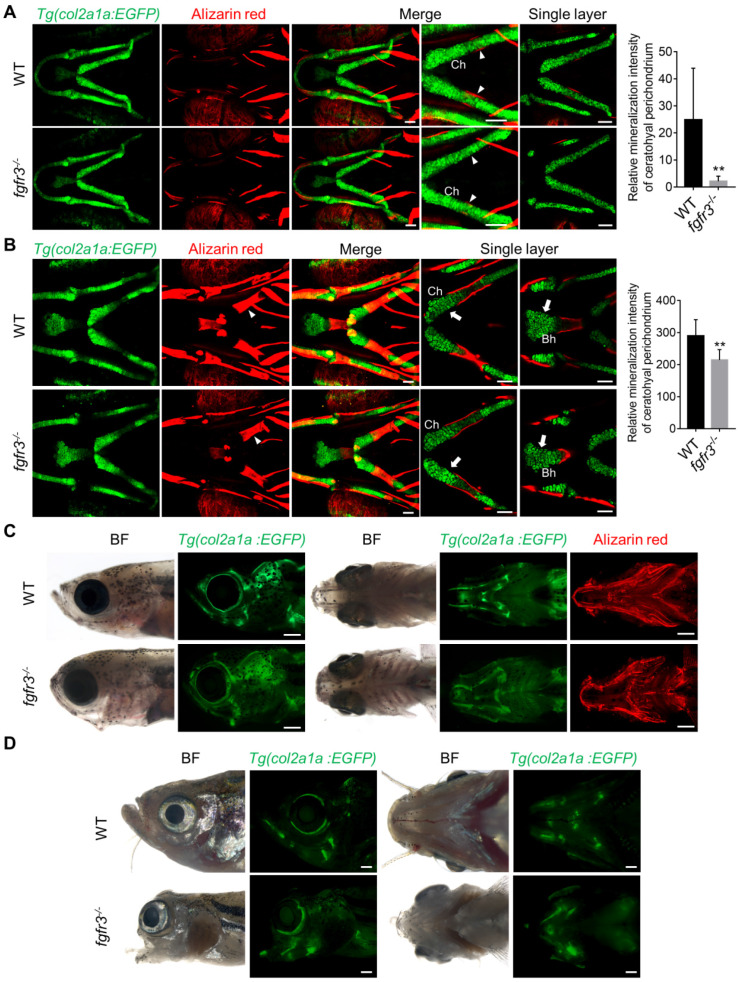
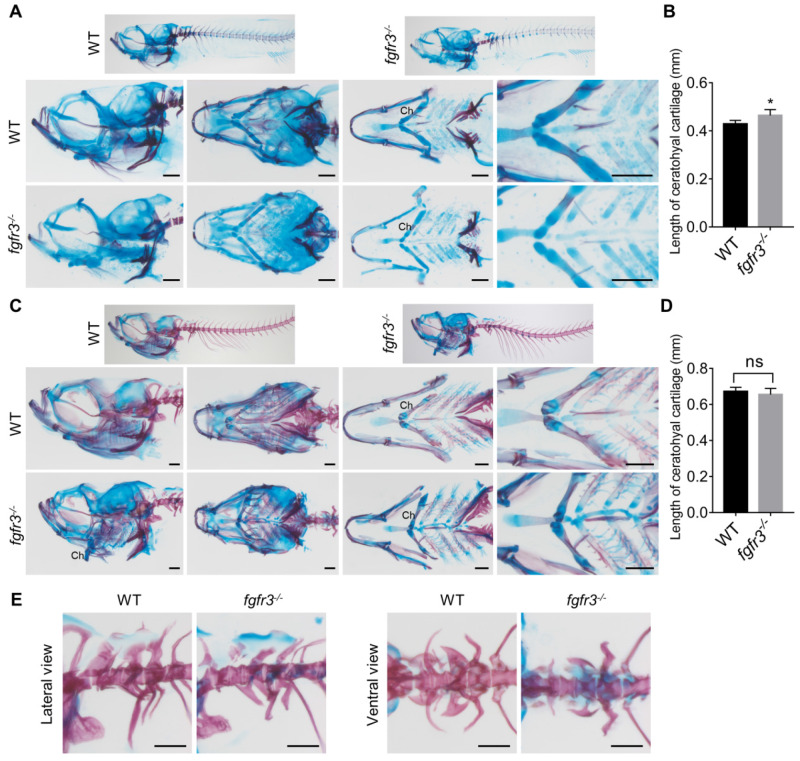
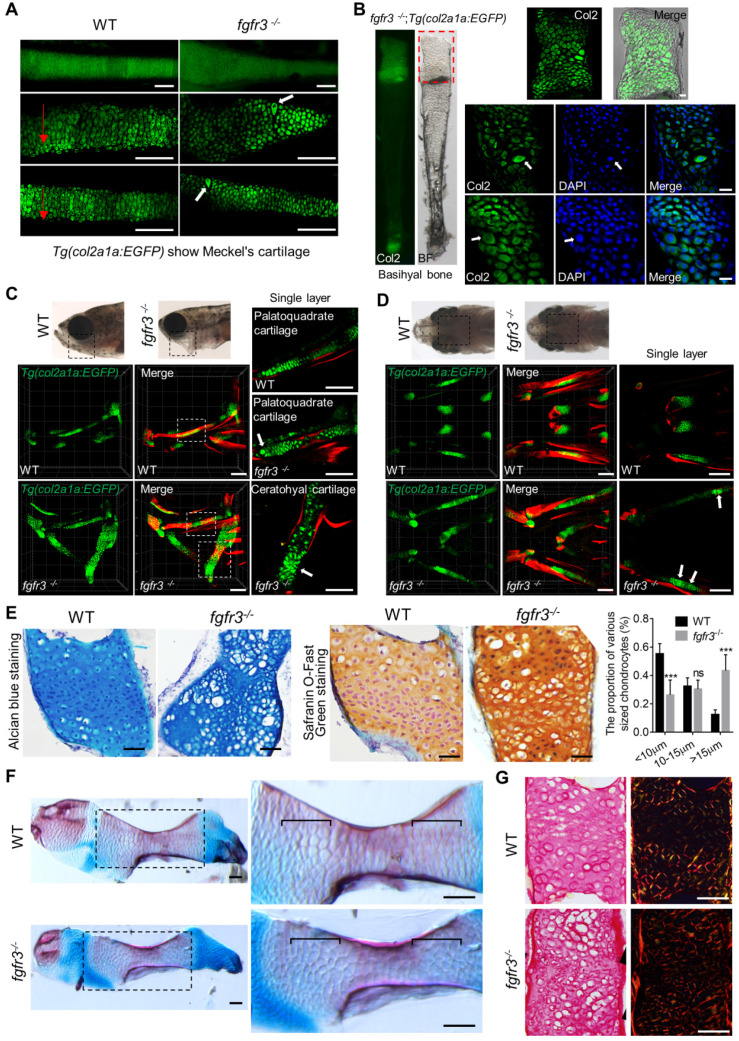
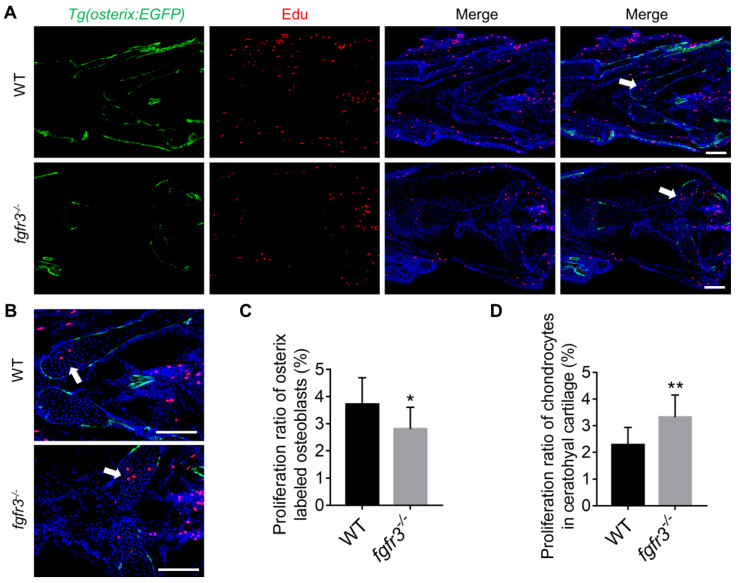
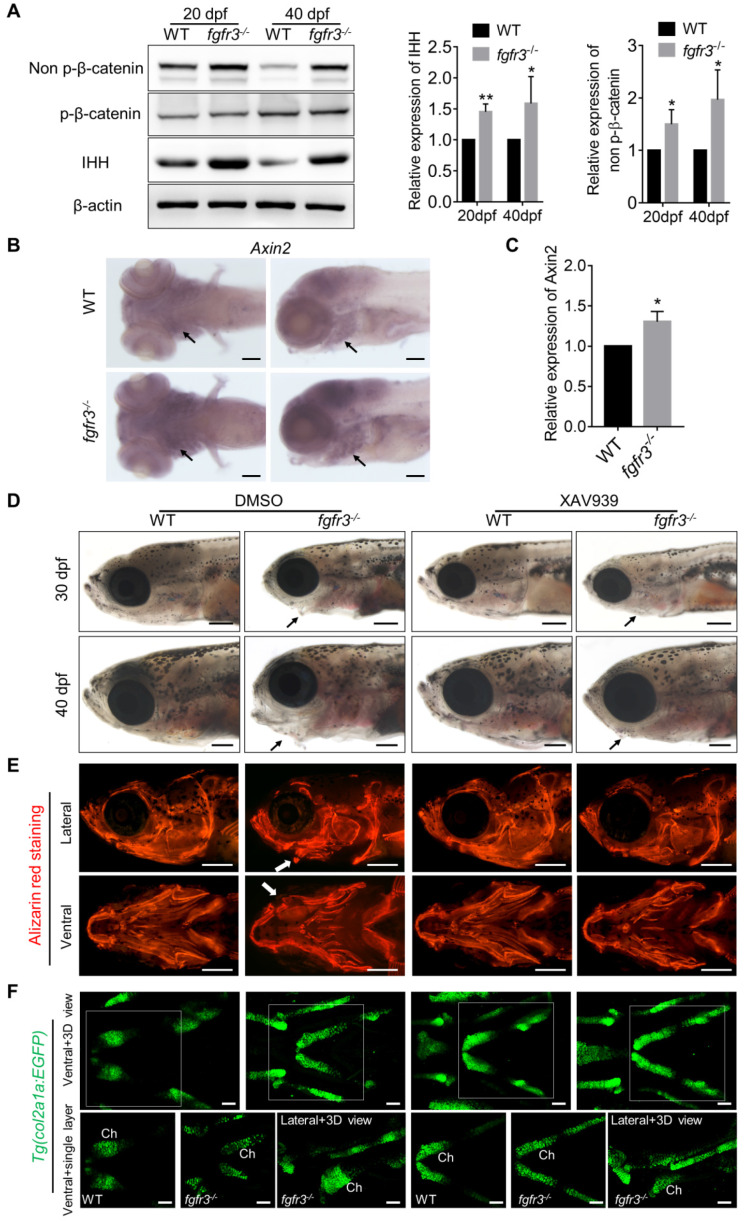
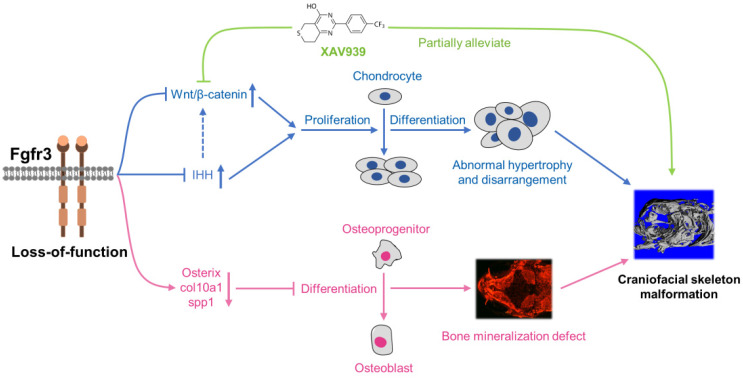
CATSHL syndrome, characterized by camptodactyly, tall stature and hearing loss, is caused by loss-of-function mutations of fibroblast growth factor receptors 3 (FGFR3) gene. Most manifestations of patients with CATSHL syndrome start to develop in the embryonic stage, such as skeletal overgrowth, craniofacial abnormalities, however, the pathogenesis of these phenotypes especially the early maldevelopment remains incompletely understood. Furthermore, there are no effective therapeutic targets for this skeleton dysplasia. Methods: We generated fgfr3 knockout zebrafish by CRISPR/Cas9 technology to study the developmental mechanisms and therapeutic targets of CATSHL syndrome. Several zebrafish transgenic lines labeling osteoblasts and chondrocytes, and live Alizarin red staining were used to analyze the dynamical skeleton development in fgfr3 mutants. Western blotting, whole mount in situ hybridization, Edu labeling based cell proliferation assay and Wnt/β-catenin signaling antagonist were used to explore the potential mechanisms and therapeutic targets. Results: We found that fgfr3 mutant zebrafish, staring from early development stage, showed craniofacial bone malformation with microcephaly and delayed closure of cranial sutures, chondroma-like lesion and abnormal development of auditory sensory organs, partially resembling the clinical manifestations of patients with CATSHL syndrome. Further studies showed that fgfr3 regulates the patterning and shaping of pharyngeal arches and the timely ossification of craniofacial skeleton. The abnormal development of pharyngeal arch cartilage is related to the augmented hypertrophy and disordered arrangement of chondrocytes, while decreased proliferation, differentiation and mineralization of osteoblasts may be involved in the delayed maturation of skull bones. Furthermore, we revealed that deficiency of fgfr3 leads to enhanced IHH signaling and up-regulated canonical Wnt/β-catenin signaling, and pharmacological inhibition of Wnt/β-catenin could partially alleviate the phenotypes of fgfr3 mutants. Conclusions: Our study further reveals some novel phenotypes and underlying developmental mechanism of CATSHL syndrome, which deepens our understanding of the pathogenesis of CATSHL and the role of fgfr3 in skeleton development. Our findings provide evidence that modulation of Wnt/β-catenin activity could be a potential therapy for CATSHL syndrome and related skeleton diseases.

Keywords: CATSHL syndrome; FGFR3; Skeletal development; Wnt/β-catenin; Zebrafish.


Conflict of interest statement

Competing Interests: The authors have declared that no competing interest exists.

Figures

Figure 1
Figure 1
Zebrafish fgfr3 is highly conserved across multiple species. (A) Multiple alignment of amino acids of FGFR3 for human (806 aa), mouse (800 aa) and zebrafish (819 aa). Identical amino acids are shaded. The three Ig-like domains (Ig I-III), transmembrane domain (TM), and tyrosine-protein kinase domain (PTK) are marked with blue, green and red boxes, respectively. (B) The identity of multiple domains of each FGFR3 protein for human, mouse and zebrafish, as referred to human FGFR3. (C) Conserved synteny analysis for FGFR3 gene in zebrafish, human and mouse. Numbers next to the gene names represent megabase pair (Mbp) of gene location on the chromosome. Chromosome segments are represented with blue lines and dashed blue lines represent discontinuous segments. Orthologs are connected with black lines.
Figure 2
Figure 2
Expression patterns of fgfr3 detected by whole mount in situ hybridization in wild-type zebrafish. (A) Lateral view of 10-somite stage; (B-C) show 24 hpf embryo in lateral view (B) and head region in dorsal view (C). (D-F) show 48 hpf embryo in lateral view (D) and head region in dorsal view (E) and in ventral view (F). (G-I) show head region of 60 hpf embryo in ventral view (G), in lateral view (H) and in dorsal view (I). (J-L) show head region of 72 hpf embryo in lateral view with yolk (J) and in lateral view without yolk (K), 72 hpf embryo in ventral view (L); (M-N) show head region of 4 dpf embryo in lateral view (M) and in ventral view (N). n = 30 embryos for A-N. Abbreviations: ba, branchial arch; d, diencephalon; ep, ethmoid plate; h, hindbrain; ha, hyoid arch; m, mandibular arch; pfb, pectoral fin bud; pp, pharyngeal pouches; r1, rhombomere 1; s, somites; sc, spinal cord. Scale bars: 200 µm in A-N.
Figure 3
Figure 3
Fgfr3 knockout in zebrafish disrupts craniofacial development. (A) The WT and two fgfr3 mutant lines in F2 generation generated by CRISPR/Cas9 technology. Left panel show the target sequence (red), PAM sequence (bold dashed line) and 2 bp or 17 bp deletion of the mutant lines. Right panel diagram domains of WT and predicted mutants of Fgfr3 protein. (B) RT-qPCR analysis of the expression level of fgfr3 in 2 bp deletion mutant line and 17 bp deletion mutant line at 20 dpf (SL 7.5 mm). n = 3 independent experiments. ***p < 0.001. (C, D) Bright-field images showing the WT and fgfr3 mutant at 1 month (SL 10.0 mm) (C) and the adult stage about 3 months (SL 26.0 mm) with different degrees of skull deformity (D). The quantification of body length for (C) and (D) is show in the right panel. n = 10, ***p < 0.001, no significance (ns). (E) X-rays of the corresponding zebrafish of (D) in lateral view (left) and dorsal view (right). (F, G) The micro-CT reconstruction images of WT and fgfr3 mutant, the (F) are magnified in the (G). Note that the domed-shaped skull (arrowheads), drooped hyoid arch (arrow), malformed jaw bone and delayed closure of cranial sutures in fgfr3 mutants. Scale bars: 1 mm in C, F-G.
Figure 4
Figure 4
Fgfr3 is required for the timely bone ossification. (A) Confocal imaging of WT and fgfr3 mutants in Tg(osterix:EGFP) background live stained with Alizarin red at 10 dpf (SL 5.0 mm) (left), 15 dpf (SL 6.0 mm) (middle) and 20 dpf (SL 7.5 mm) (right). White arrowheads indicate less osteoblasts at the mineralized bone collars of ceratohyal perichondrium. (B-D) Stereo fluorescence microscope imaging of WT and fgfr3 mutants at 30 dpf (SL 10.0 mm) (B), 45 dpf (SL 14.0 mm) (C) and 60 dpf (SL 18.0 mm) (D) in lateral view (left) and ventral view (right) after live stained with Alizarin red in Tg(osterix:EGFP). White arrows indicate some small bone islands at the margin of the opercle bone. (E) Bright field (left), Tg(osterix:EGFP) images (middle) and Alizarin red staining images (right) showing the development of parietal (p) and frontal (f) bones of WT and fgfr3 mutants in dorsal view at 30 dpf (SL 10.0 mm) (left), 45 dpf (SL 14.0 mm) (middle) and 60 dpf (SL 18.0 mm) (right). White arrows indicate several small separated bones in fgfr3 mutants. Abbreviations: Bsr, branchiostegal rays; Ch, ceratohyal bone; Op, opercle. Scale bars: 100 µm in A, 400 µm in B-E.
Figure 5
Figure 5
Fgfr3 regulates the patterning and shaping of pharyngeal arche. (A-B) Confocal imaging of WT and fgfr3 mutants in Tg(col2a1a:EGFP) background live stained with Alizarin red at 10 dpf (SL 5.0 mm) (A) and 20 dpf (SL 7.5 mm) (B). From left to right are 3D view of Tg(col2a1a:EGFP) image, Alizarin red staining image, merged 3D view image and merged single layer image. The right panel are the quantification of relative mineralization intensity of ceratohyal perichondrium for WT and fgfr3 mutants. White arrowheads indicate that perichondral ossification of ceratohyal cartilage was delayed in fgfr3 mutants. White arrows indicate disarrangement of chondrocytes of ceratohyal cartilage and basihyal cartilage in fgfr3 mutants in contrast to WT. n = 10, **p < 0.01. (C) Stereo fluorescence microscope imaging of WT and fgfr3 mutants at 30 dpf (SL 10.0 mm) in lateral view (left) and ventral view (right) after live stained with Alizarin red in Tg(col2a1a:EGFP). (D) Stereo fluorescence microscope imaging of WT and fgfr3 mutants at about 3 months (SL 26.0 mm) in lateral view (left) and ventral view (right) in Tg(col2a1a:EGFP). Ch: ceratohyal cartilage; Bh: basihyal cartilage. Scale bars: 50 µm in A and B, 400 µm in C and D.
Figure 6
Figure 6
The phenotype of fgfr3 mutant zebrafish detected by Alizarin red and Alcian blue whole skeleton staining. (A, C) Alizarin red and Alcian blue whole skeleton staining of the WT and fgfr3 mutant at 20 dpf (SL 7.5 mm) (A) and 30 dpf (SL 10.0 mm) (C). Left two panels show the lateral view and dorsal view of the craniofacial bone. Right two panels show the dissected pharyngeal arches and the magnified ceratohyal bone. (B, D) Quantification of ceratohyal cartilage length for WT and fgfr3 mutants at 20 dpf (SL 7.5 mm) (B) and 30 dpf (SL 10.0 mm) (D). n = 6, *p<0.05, no significance (ns). (E) Lateral view (left) and ventral view (right) of the Weberian apparatus of the WT and fgfr3 mutant at 30 dpf (SL 10.0 mm). Ch: ceratohyal cartilage. Scale bar, 200 µm in A, C and E.
Figure 7
Figure 7
Fgfr3 mutation leads to abnormal chondrocyte hypertrophy and arrangement. (A) Images show the dissected Meckel's cartilage of WT and fgfr3 mutants at 2 months (SL 18.0 mm) in Tg(col2a1a:EGFP) background. The top panel is the stereo fluorescence microscope image, the middle and bottom panel are the confocal images. Red arrows indicate the uniform arrangement of chondrocytes in WT and the white arrows indicate abnormal hypertrophy and disorganized chondrocyte orientation in fgfr3 mutants. (B) Images show the dissected basihyal bone of fgfr3 mutants at 2 months (SL 18.0 mm) in Tg(col2a1a:EGFP) background. The left panel shows the stereo fluorescence microscope image, the right panel shows the confocal images. White arrows indicate the abnormally enlarged chondrocytes and the nuclei in basihyal cartilage of fgfr3 mutants. (C-D) Confocal imaging of WT and fgfr3 mutants in Tg(col2a1a:EGFP) background live stained with Alizarin red at 30 dpf (SL 10.0 mm) in lateral view (C) and ventral view (D). Boxed regions in the top bright field images are magnified in the bottom 3D confocal image. The right panel show the single layer image. White arrows indicate abnormal hypertrophy and disarrangement of ceratohyal and palatoquadrate chondrocytes in fgfr3 mutants. (E) Alcian blue staining (left) and Safranin O-Fast Green staining (right) of epiphysial growth plate of ceratohyal cartilage in WT and fgfr3 mutants at 1.5 month (SL 14.0 mm). The right panel are the quantification of the proportion of various sized chondrocytes in epiphysial growth plates of ceratohyal cartilage. n = 5, ***p<0.001, no significance (ns). (F) Alizarin red and Alcian blue whole skeleton staining of dissected ceratohyal bone of WT and fgfr3 mutants at 1.5 months (SL 14.0 mm). Boxed regions are magnified in the right panel. Brackets indicate that the chondrocytes in growth plate were ordered in WT and disorganized in fgfr3 mutants. (G) Picric-sirius red staining for epiphysial growth plate of WT and fgfr3 mutants, the left panel show the image from ordinary light microscope and the right panel show the image from polarized light microscopy. Scale bars: 100 µm in A, C and D, 20 µm in B, 50 µm in E-G.
Figure 8
Figure 8
Fgfr3 mutation promotes chondrocyte proliferation and inhibits osteoblast proliferation. (A) Edu incorporation assay in WT and fgfr3 mutants of Tg(osterix:EGFP) background at 1 month (SL 10.0 mm), (B) is the higher magnification of ceratohyal cartilage. White arrows indicate the increased proliferation of chondrocytes in ceratohyal cartilage of fgfr3 mutants. (C) Quantification of the proliferation ratio of osterix labeled osteoblasts in (A), n = 10, *p < 0.05. (D) Quantification of the proliferation ratio of chondrocytes in ceratohyal cartilage in (A), n = 10, **p < 0.01. Scale bars: 100 µm in A.
Figure 9
Figure 9
Fgfr3 mutation upregulates canonical Wnt/β-catenin signaling and Wnt inhibition partially alleviates the phenotype of fgfr3 mutants. (A) Western blot detecting the protein levels of phosphorylated-β-catenin, non-phosphorylated β-catenin (activated β-catenin) and IHH in WT and mutant zebrafish at 20 dpf (SL 7.5 mm) and 40 dpf (SL 13.0 mm), β-actin was used as loading control. Quantitative analyses of the relative expressions of IHH and non-phosphorylated β-catenin are show in the right panel. n = 3 independent experiments, **p < 0.01, *p < 0.05. (B) Expression level of axin2 examined by in situ hybridization at 7 dpf. Black arrows indicate pharyngeal cartilage. (C) RT-qPCR analysis of the expression level of axin2 at 20 dpf (SL 7.5 mm). n = 3 independent experiments, *p < 0.05. (D-F) WT and fgfr3 mutants treated with 2.5 µM XAV939 (right) or DMSO (left) from 10 dpf (SL 5.0 mm) to 20 dpf (SL 7.5 mm). (D) show the lateral view of head region detected by light microscopy at 30 dpf (SL 10.0 mm) (top) and 40 dpf (SL 13.0 mm) (bottom). Arrows indicate that the mandibular deformity with hyoid arch drooping toward the ventral side was partially rescued in XAV939-treated mutants. (E) show the lateral view (top) and ventral view (bottom) of craniofacial bone at 40 dpf (SL 13.0 mm) with living Alizarin red staining. (F) is the confocal images showing the ceratohyal cartilage (Ch) at 30 dpf (SL 10.0 mm) of WT and fgfr3 mutants in Tg (col2a1a:EGFP) transgenic background. Boxed regions in the 3D confocal image are showed the single layer in the bottom. Scale bar, 100 µm in C, 400 µm in D and E, 50 µm in F.
Figure 10
Figure 10
Schematic diagram of the mechanisms underlying the role of fgfr3 in zebrafish skeleton development. Deletion of Fgfr3 in zebrafish results in enhanced IHH signaling and up-regulated canonical Wnt/β-catenin signaling that may lead to increased chondrocyte proliferation, abnormal hypertrophy and disordered arrangement of chondrocytes in growth plates. Fgfr3 mutation leads to decreased proliferation and differentiation of osteoblasts and decreased mineralization in skull bone. A combination of above mechanisms may lead to disrupted chondrogenesis and bone ossification resulting in craniofacial skeleton malformation in fgfr3 mutant zebrafish.

Similar articles

Cited by

References

    1. Toydemir RM, Brassington AE, Bayrak-Toydemir P, Krakowiak PA, Jorde LB, Whitby FG. et al. A novel mutation in FGFR3 causes camptodactyly, tall stature, and hearing loss (CATSHL) syndrome. Am J Hum Genet. 2006;79:935–41. - PMC - PubMed
    1. Makrythanasis P, Temtamy S, Aglan MS, Otaify GA, Hamamy H, Antonarakis SE. A novel homozygous mutation in FGFR3 causes tall stature, severe lateral tibial deviation, scoliosis, hearing impairment, camptodactyly, and arachnodactyly. Hum Mutat. 2014;35:959–63. - PubMed
    1. Escobar LF, Tucker M, Bamshad M. A second family with CATSHL syndrome: Confirmatory report of another unique FGFR3 syndrome. Am J Med Genet A. 2016;170:1908–11. - PubMed
    1. Ornitz DM, Marie PJ. Fibroblast growth factors in skeletal development. Curr Top Dev Biol. 2019;133:195–234. - PubMed
    1. Du X, Xie Y, Xian CJ, Chen L. Role of FGFs/FGFRs in skeletal development and bone regeneration. J Cell Physiol. 2012;227:3731–43. - PubMed

Publication types

MeSH terms

Substances

Supplementary concepts

LinkOut - more resources