. 2020 Jun 1;10(16):7178-7192.
doi: 10.7150/thno.43093. eCollection 2020.

Inflammatory IFIT3 renders chemotherapy resistance by regulating post-translational modification of VDAC2 in pancreatic cancer

Affiliations

Inflammatory IFIT3 renders chemotherapy resistance by regulating post-translational modification of VDAC2 in pancreatic cancer

Zhefang Wang et al. Theranostics. .

Abstract

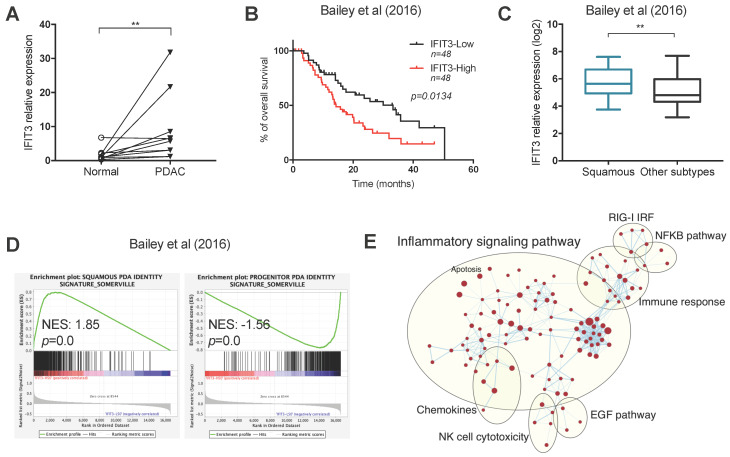
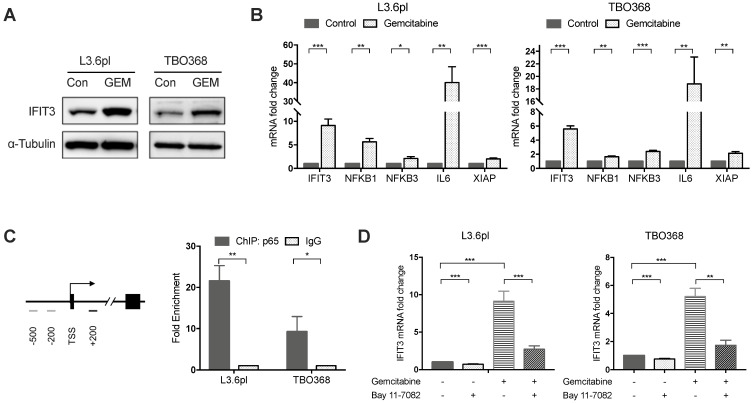
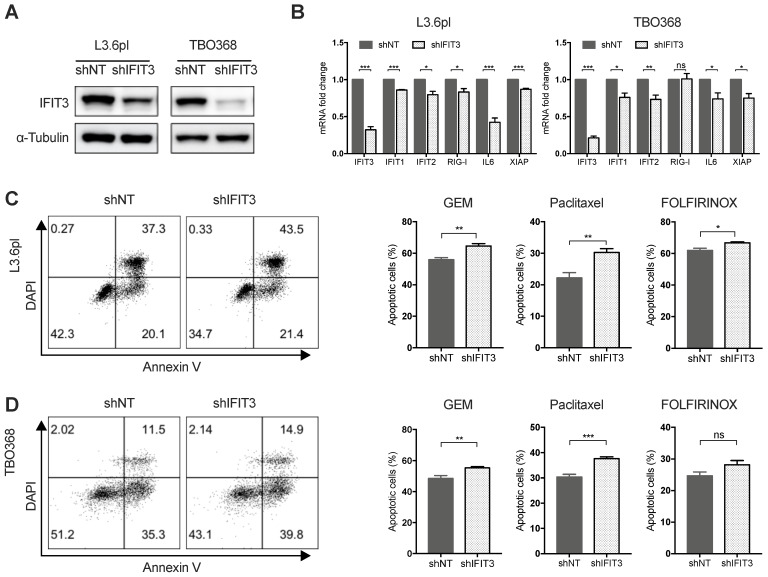
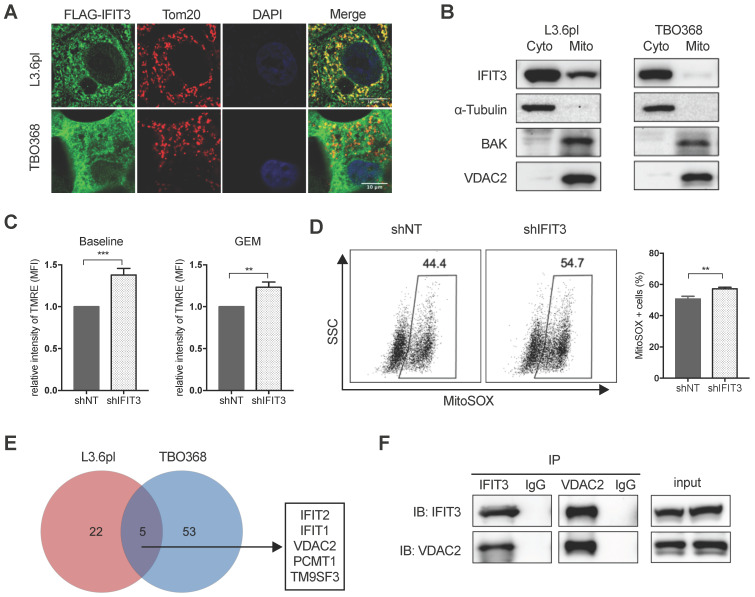
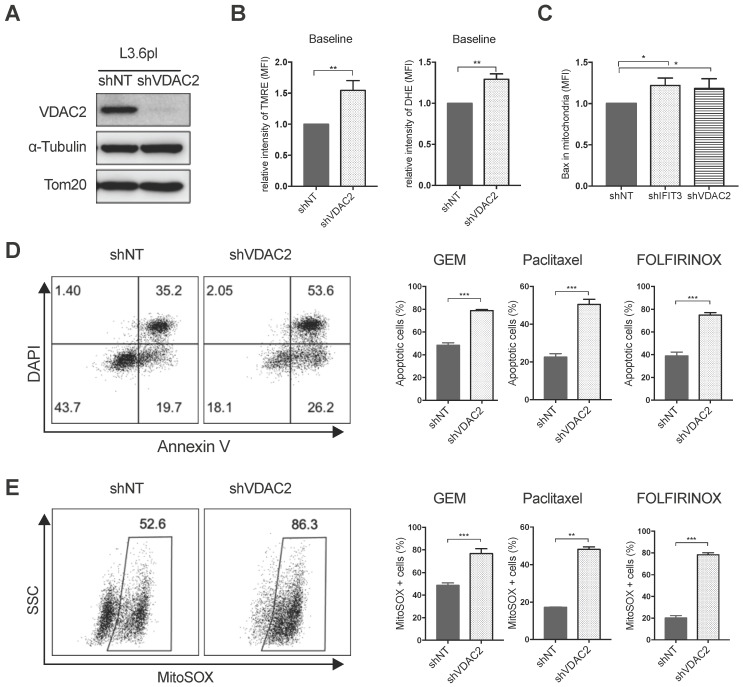
Pancreatic ductal adenocarcinoma (PDAC) is one of the most lethal cancers worldwide and effective therapy remains a challenge. IFIT3 is an interferon-stimulated gene with antiviral and pro-inflammatory functions. Our previous work has shown that high expression of IFIT3 is correlated with poor survival in PDAC patients who receive chemotherapy suggesting a link between IFIT3 and chemotherapy resistance in PDAC. However, the exact role and molecular mechanism of IFIT3 in chemotherapy resistance in PDAC has been unclear. Methods: A group of transcriptome datasets were downloaded and analyzed for the characterization of IFIT3 in PDAC. Highly metastatic PDAC cell line L3.6pl and patient-derived primary cell TBO368 were used and IFIT3 knockdown and the corresponding knockin cells were established for in vitro studies. Chemotherapy-induced apoptosis, ROS production, confocal immunofluorescence, subcellular fractionation, chromatin-immunoprecipitation, co-immunoprecipitation and mass spectrometry analysis were determined to further explore the biological role of IFIT3 in chemotherapy resistance of PDAC. Results: Based on PDAC transcriptome data, we show that IFIT3 expression is associated with the squamous molecular subtype of PDAC and an increase in inflammatory response and apoptosis pathways. We further identify a crucial role for IFIT3 in the regulation of mitochondria-associated apoptosis during chemotherapy. Knockdown of IFIT3 attenuates the chemotherapy resistance of PDAC cells to gemcitabine, paclitaxel, and FOLFIRINOX regimen treatments, independent of individual chemotherapy regimens. While IFIT3 overexpression was found to promote drug resistance. Co-immunoprecipitation identified a direct interaction between IFIT3 and the mitochondrial channel protein VDAC2, an important regulator of mitochondria-associated apoptosis. It was subsequently found that IFIT3 regulates the post-translational modification-O-GlcNAcylation of VDAC2 by stabilizing the interaction of VDAC2 with O-GlcNAc transferase. Increased O-GlcNAcylation of VDAC2 protected PDAC cells from chemotherapy induced apoptosis. Conclusions: These results effectively demonstrate a central mechanism by which IFIT3 expression can affect chemotherapy resistance in PDAC. Targeting IFIT3/VDAC2 may represent a novel strategy to sensitize aggressive forms of pancreatic cancer to conventional chemotherapy regimens.

Keywords: Chemotherapy resistance; IFIT3; PDAC; VDAC2; post-translational modification.


Conflict of interest statement

Competing Interests: The authors have declared that no competing interest exists.

Figures

Figure 1
Figure 1
Expression and characterization of IFIT3 in PDAC. (A) IFIT3 expression is higher in PDAC tissues compare to adjacent normal tissues. Ten pairs of PDAC tissues and adjacent normal tissues were collected and analyzed with qRT-PCR. 18s rRNA was used as internal control. (B-E) Datasets from Bailey et al. were downloaded and analyzed. Samples were stratified into quantiles based on the expression of IFIT3 (lower 50% and upper 50% of values, n=48 for each group). (B) Kaplan-Meier survival analysis shows IFIT3 expression is associated with poor survival of PDAC patients. (C) IFIT3 expression is higher in squamous subtype of PDAC. Data are presented as box-and-whisker plot (Min to Max). (D) Gene set enrichment analysis shows enrichment of squamous signature in IFIT3-high group and progenitor signature in IFIT3-low group. (E) Enrichment map analysis shows IFIT3 expression is enriched with inflammatory response, immune response, NF-κB pathway and apoptosis. **p < 0.01.
Figure 2
Figure 2
IFIT3 interplays with NF-κB pathway during chemotherapy. (A) Western blot showed IFIT3 was up-regulated after gemcitabine treatment. Protein samples were collected from L3.6pl and TBO368 cells with or without gemcitabine treatment (3 ng/ml for L3.6pl and 400 ng/ml for TBO368) for indicated time. Membrane was stripped after IFIT3 detection and re-probed with α-Tubulin. (B) IFIT3 and NF-kB pathway was activated after gemcitabine treatment in L3.6pl and TBO368. NFKB1, NFKB3, IL6 and XIAP were selected as indicators for activation of NF-κB pathway. RNA samples were collected from L3.6pl and TBO368 cells with or without gemcitabine treatment for indicated time. (C) Three putative p65 binding sites on IFIT3 gene promoter are depicted. Chromatin immunoprecipitation indicates direct binding of p65 to the promoter region of IFIT3 (TSS +122 to +342, black bar). Chromatin was extracted from 1% PFA fixed L3.6pl and TBO368 cells pre-treated with gemcitabine and immunoprecipitated with anti-p65 antibody or normal IgG. (D) Expression of IFIT3 was diminished by NF-κB inhibitor Bay 11-7082 with or without gemcitabine treatment. Bay 11-7082, 10 µM. Data are presented as mean ± SEM of three independent experiments. *p < 0.05, **p < 0.01, ***p < 0.001.
Figure 3
Figure 3
IFIT3 renders chemotherapy resistance in PDAC cells. (A) IFIT3 knockdown was confirmed with western blot in both L3.6pl and TBO368 cells. Membrane was stripped after IFIT3 detection and re-probed with α-Tubulin. (B) IFN pathway and NF-κB pathway targeted genes, IFIT1, IFIT2, RIG-I, IL6, and XIAP were significantly down-regulated after knockdown of IFIT3. (C-D) Knockdown of IFIT3 increased sensitivity of L3.6pl (C) and TBO368 (D) to chemotherapy. Cells were treated with gemcitabine (3 ng/ml for L3.6pl and 400 ng/ml for TBO368), paclitaxel (10 nM) or FOLFIRINOX (Oxaliplatin: Irinotecan: Folinic acid Calcium: 5-Fluorouracil=1:2:4:25 µM as 1X, used as 0.025X for L3.6pl and 0.5X for TBO368) for indicated time. Apoptosis was determined by flow cytometry analysis of Annexin V/DAPI staining. Representative FACS dot plots are shown on the left. Bar graphs are presented as mean ± SEM of three independent experiments. *p < 0.05, **p < 0.01, ***p < 0.001, ns: non-significant, p > 0.05.
Figure 4
Figure 4
IFIT3 regulates mitochondria-associated apoptosis. (A) Confocal immunofluorescence labeled with anti-FLAG (green), anti-Tom20 (red), and counterstained with DAPI (blue), showed co-localization of FLAG-tagged IFIT3 and Tom20 in mitochondria. L3.6pl and TBO368 cells stably express FLAG-tagged IFIT3 were used here. Scale was shown in the lower-right corner. (B) Western blot showed localization of IFIT3 in cytosol and mitochondria of L3.6pl and TBO368. Mitochondria were isolated as indicated in methods section. Cyto represent cytosol and Mito represent mitochondria. We probed α-Tubulin as cytosolic marker, BAK and VDAC2 as mitochondrial marker. (C) IFIT3 knockdown in L3.6pl altered mitochondrial membrane potential (ΔΨm) with or without gemcitabine treatment. TMRE was used to determine the mitochondrial membrane potential (ΔΨm). MFI: mean fluorescence intensity. (D) IFIT3 knockdown in L3.6pl showed more MitoSOX positive cells when treated with gemcitabine. Representative FACS dot plot and bar graph are shown. (E) Mass spectrometry results of immunoprecipitated samples by anti-IFIT3 antibody are shown in Venn diagram. Cells were treated with gemcitabine for indicated time before harvest. Proteins with p < 0.01 and log2 difference > 1 are considered significant. Proteins identified in the intersection of L3.6pl and TBO368 are listed beside the diagram. (F) Interaction between IFIT3 and VDAC2 was confirmed with western blot in L3.6pl. Data are presented as mean ± SEM of three independent experiments. **p < 0.01, ***p < 0.001.
Figure 5
Figure 5
VDAC2 protects PDAC cells from chemotherapy induced apoptosis. (A) VDAC2 Knockdown was confirmed with western blot in L3.6pl. α-Tubulin and Tom20 were probed as loading control. (B) VDAC2 knockdown significantly increased the mitochondrial membrane potential (ΔΨm) and ROS production of L3.6pl in baseline. TMRE and DHE were used to determine the mitochondrial membrane potential (ΔΨm) and ROS production. (C) Translocation of BAX to mitochondria was increased after knockdown of IFIT3 and VDAC2 in L3.6pl. Cells were treated with gemcitabine for 48h before permeabilization and fixation. Samples were analyzed with flow cytometry. (D-E) VDAC2 knockdown increased sensitivity of L3.6pl to chemotherapy, as indicated by apoptotic assay (D) and MitoSOX staining (E). Representative FACS dot plot and bar graph are shown. Data are presented as mean ± SEM of three independent experiments. *p < 0.05, **p < 0.01, ***p < 0.001.
Figure 6
Figure 6
IFIT3 modulates the O-GlcNAc level of VDAC2 through OGT. (A) IFIT3 knockdown did not alter the protein level of VDAC2 in both L3.6pl and TBO368. Membranes were probed with IFIT3, VDAC2 and OGT, then stripped and re-probed with α-Tubulin as loading control. (B) IFIT3 knockdown decreased the O-GlcNAc modification level of VDAC2. O-GlcNAc modified proteins were immunoprecipitated with anti-O-GlcNAc (RL2) antibody and blot was probed with anti-VDAC2 antibody. Input of VDAC2 was probed for loading control. (C) TMG reduced gemcitabine induced apoptosis in L3.6pl while show no difference in TBO368. Cells were treated as indicated for 48 h and 72 h, in L3.6pl and TBO368, respectively. TMG, 5 µM. Data are presented as mean ± SEM of three independent experiments. (D) OGT level in mitochondrial fraction was decreased in IFIT3 knockdown cells compared to non-target control cells. Mitochondria were isolated as indicated in methods section. VDAC2 was used as loading control. (E) Immunoprecipitation of OGT showed less binding of VDAC2 after knockdown of IFIT3 in both L3.6pl and TBO368, with or without gemcitabine treatment. (E) Schematic picture of IFIT3 regulating the O-GlcNAc modification of VDAC2 and protecting PDAC cells from chemotherapy induced apoptosis. *p < 0.05, **p < 0.01, ***p < 0.001, ns: non-significant, p > 0.05.

References

    1. Kamisawa T, Wood LD, Itoi T, Takaori K. Pancreatic cancer. Lancet. 2016;388:73–85. - PubMed
    1. Neuzillet C, Tijeras-Raballand A, Bourget P, Cros J, Couvelard A, Sauvanet A. et al. State of the art and future directions of pancreatic ductal adenocarcinoma therapy. Pharmacol Ther. 2015;155:80–104. - PubMed
    1. Gillen S, Schuster T, Meyer Zum Büschenfelde C, Friess H, Kleeff J. Preoperative/neoadjuvant therapy in pancreatic cancer: a systematic review and meta-analysis of response and resection percentages. PLoS Med. 2010;7:e1000267. - PMC - PubMed
    1. Groot VP, Rezaee N, Wu W, Cameron JL, Fishman EK, Hruban RH. et al. Patterns, Timing, and Predictors of Recurrence Following Pancreatectomy for Pancreatic Ductal Adenocarcinoma. Ann Surg. 2018;267:936–45. - PubMed
    1. Von Hoff DD, Ervin T, Arena FP, Chiorean EG, Infante J, Moore M. et al. Increased survival in pancreatic cancer with nab-paclitaxel plus gemcitabine. N Engl J Med. 2013;369:1691–703. - PMC - PubMed

Publication types

MeSH terms

Substances