. 2020 Jun 5;10(16):7335-7350.
doi: 10.7150/thno.45971. eCollection 2020.

KRAS Mutation-Responsive miR-139-5p inhibits Colorectal Cancer Progression and is repressed by Wnt Signaling

Affiliations

KRAS Mutation-Responsive miR-139-5p inhibits Colorectal Cancer Progression and is repressed by Wnt Signaling

Feng Du et al. Theranostics. .

Abstract

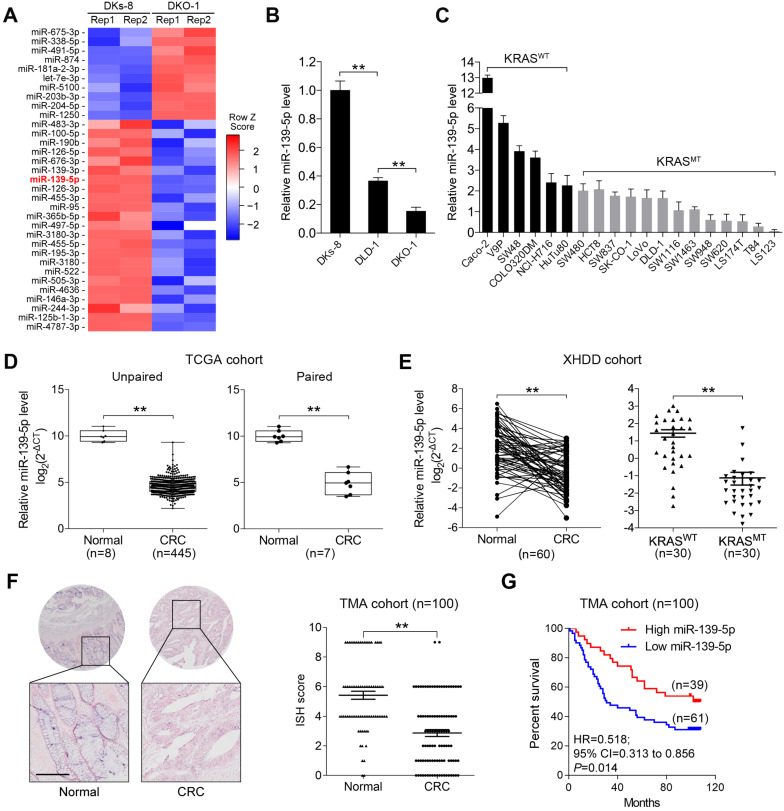
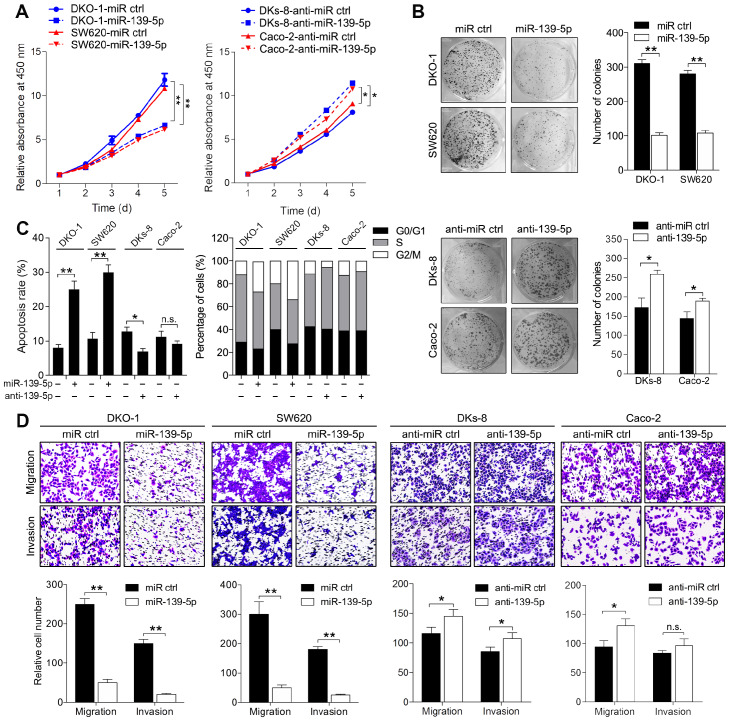
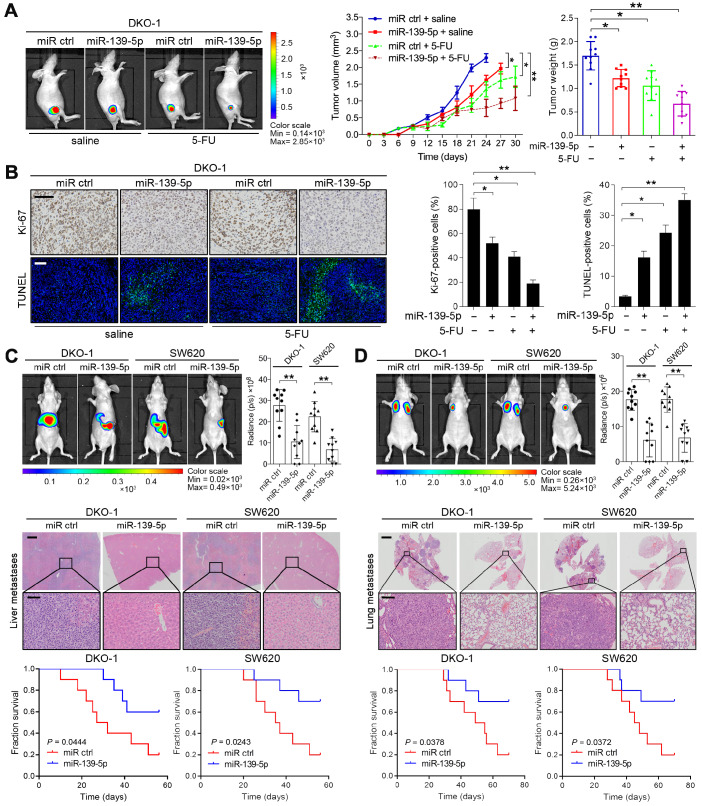
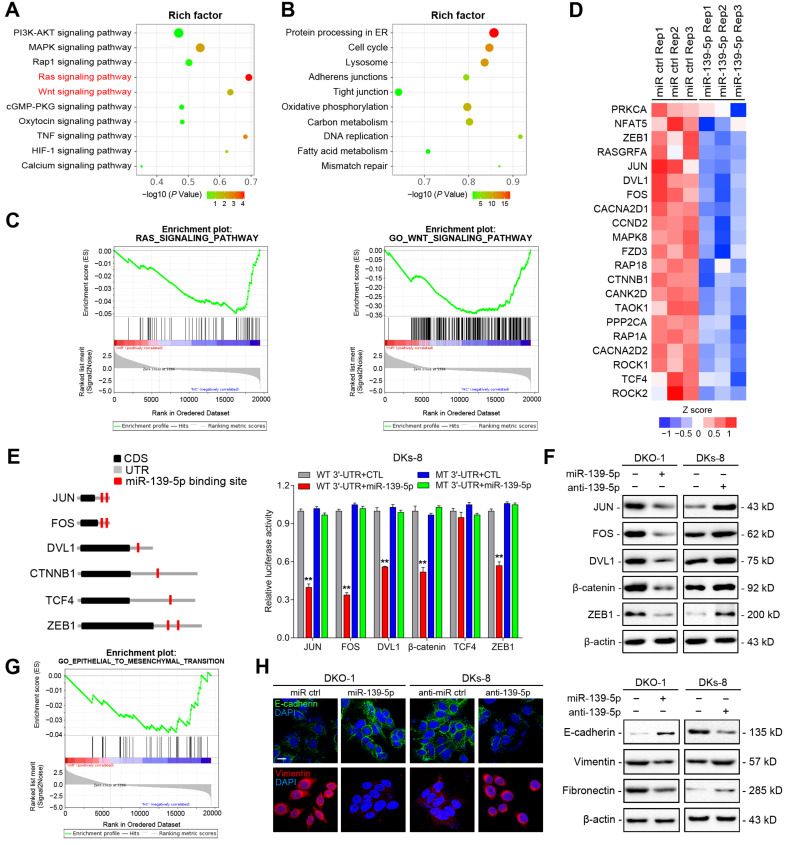
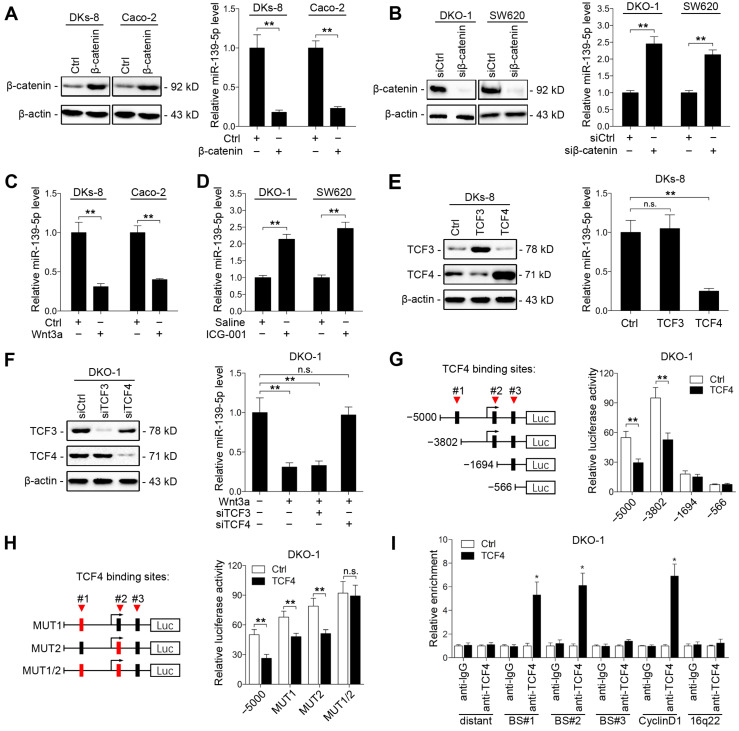
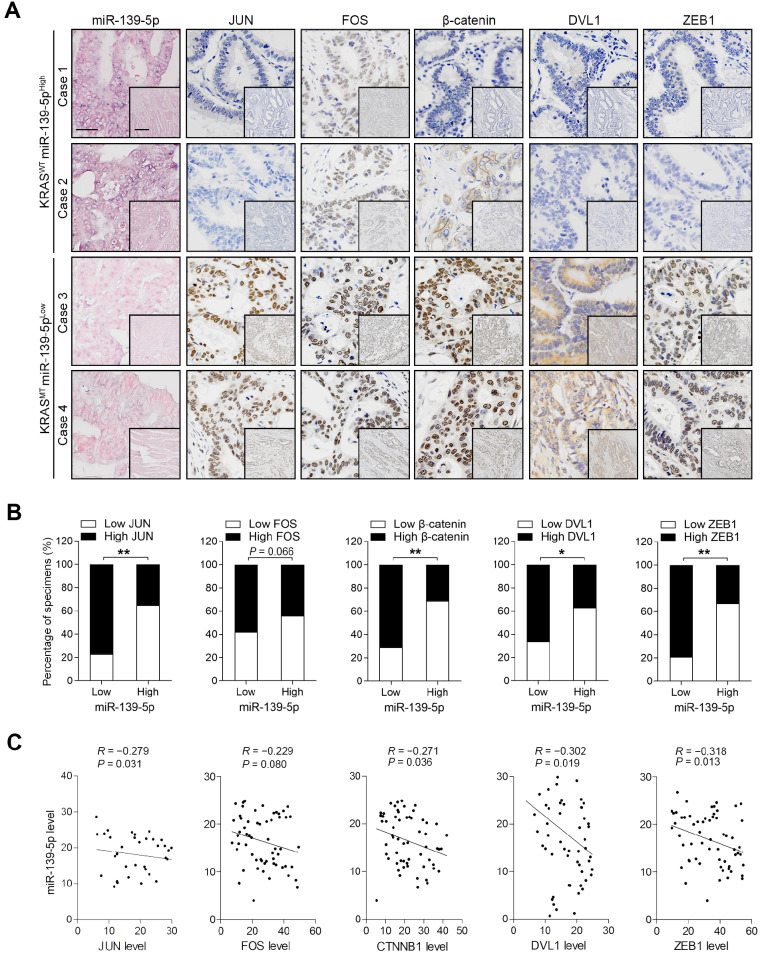
Introduction: Colorectal cancer (CRC) frequently harbors KRAS mutations that result in chemoresistance and metastasis. MicroRNAs (miRNAs) are usually dysregulated and play important regulatory roles in tumor progression. However, the KRAS mutation-responsive miRNA profile in CRC remains uninvestigated. Methods: miR-139-5p was identified and evaluated by small RNA sequencing, qRT-PCR and in situ hybridization. The roles of miR-139-5p in CRC cells with and without KRAS mutation were determined by Cell Counting Kit-8 (CCK-8), colony formation, flow cytometry and transwell assays in vitro and by tumorigenesis and metastasis assays in vivo. Microarrays followed by bioinformatic analyses, luciferase reporter assays and Western blotting were applied for mechanistic studies. Results: miR-139-5p was significantly downregulated in KRAS-mutated CRC cells and tissues compared with their wild-type counterparts. Low miR-139-5p expression was associated with aggressive phenotypes and poor prognosis in CRC patients. miR-139-5p overexpression inhibited CRC cell proliferation, migration and invasion in vitro, sensitized tumors to chemotherapy, and impaired tumor growth and metastasis in vivo. Transcriptomic profiling identified multiple modulators in the Ras (JUN and FOS) and Wnt (CTNNB1 and DVL1) signaling pathways and the epithelial-to-mesenchymal transition (EMT) process (ZEB1) as direct targets of miR-139-5p, and inverse correlations were confirmed in CRC clinical tissues. Aberrantly activated Wnt signaling in KRAS-mutant cells was demonstrated to transcriptionally repress miR-139-5p through TCF4, forming a miR-139-5p/Wnt signaling double-negative feedback loop. Conclusions: We identified miR-139-5p as a KRAS-responsive miRNA and demonstrated its involvement in CRC progression. KRAS mutation disrupted the miR-139-5p/Wnt signaling reciprocal negative feedback mechanism, which might cause miR-139-5p downregulation and derepression of oncogenic signaling pathways and EMT. These results reveal a transcriptional regulatory mode of KRAS-driven malignant transformation and highlight miR-139-5p as a novel regulator of crosstalk between the Ras and Wnt signaling pathways in CRC.

Keywords: CRC; KRAS mutation; Ras signaling; Wnt/β-catenin signaling; miR-139-5p.


Conflict of interest statement

Competing Interests: The authors have declared that no competing interest exists.

Figures

Figure 1
Figure 1
miR-139-5p is downregulated in KRAS-mutant CRC cells and tissues. (A) miRNA heatmap showing the altered miRNAs (|log2(FC)|>1 and P<0.01) in DKO-1 (mutant KRAS) versus DKs-8 (WT KRAS) cells. (B) The expression level of miR-139 were examined in DLD-1 isogenic cell lines using qRT-PCR. (C) Expression level of miR-139 in a panel of CRC cell lines grouped based on their expression of WT KRAS (KRASWT) versus mutant KRAS (KRASMT). (D) Box plots showing the expression of miR-139-5p in CRC tissues compared with unpaired (left) or paired (right) adjacent normal tissues in TCGA cohorts. (E) Left, qRT-PCR results showing miR-139-5p level in 60 pairs of matched human CRC specimens and adjacent normal tissues in the XHDD cohort. Right, miR-139-5p level in WT and KRAS-mutant CRC tissues from the XHDD cohort. Each symbol represents the mean value of an individual patient. U6 snRNA served as the internal control. Independent experiments were performed in triplicate. **, P<0.01. (F) Representative ISH images are shown. The ISH scores showed that miR-139-5p expression was downregulated in CRC tissues compared with adjacent normal tissues. (G) Kaplan-Meier overall survival curves for CRC patients with low or high expression of miR-139-5p.
Figure 2
Figure 2
miR-139-5p inhibits CRC proliferation, migration and invasion in vitro. (A) Growth curves of CRC cells transfected with an agomir (miR-139-5p) or antagomir (anti-miR-139-5p) of miR-139-5p or their negative controls, as revealed by CCK-8 analyses. (B) Colony formation assays were performed on CRC cells transfected with miR-139-5p, anti-miR-139-5p, or corresponding negative controls. (C) Apoptosis rates and cell cycle distributions of CRC cells transfected with miR-139-5p, anti-miR-139-5p, or their negative controls. (D) Transwell migration and invasion assays were performed on CRC cells transfected with miR-139-5p, anti-miR-139-5p, or their negative controls. The results are representative results (n=3) from experiments performed in triplicate. The results are expressed as the means±SDs. **, P<0.01.
Figure 3
Figure 3
miR-139-5p suppresses CRC tumorigenesis and metastasis in vivo. (A) The indicated cells were injected subcutaneously into nude mice (n=10). After the tumor size reached approximately 100 mm3, the mice received 5-FU treatment (8 mg/kg/d, i.p. injection). Left, representative bioluminescent images captured from subcutaneous tumors. Middle, growth curves of tumors in nude mice injected with the indicated cells. Right, calculated weights and volumes of tumors isolated on day 30 after treatment. **P<0.01 by one-way ANOVA followed by Dunnett's test compared with the miR ctrl group. (B) Left, representative images of tumor samples that were stained via IHC for Ki-67 and TUNEL staining. Right, the percentages of Ki-67- and TUNEL-positive cells. Bars: 200 µm. (C) In vivo liver metastasis assay results. Top, representative bioluminescent images and radiance levels of liver metastases in the different groups at 8 weeks after intrasplenic inoculation. Middle, representative hematoxylin and eosin (H&E) staining showing metastatic nodules in liver tissues of nude mice. Bars: 200 µm (upper); 50 µm (lower). Bottom, overall survival times of the nude mice in the different groups. (D) In vivo lung metastasis assay results. Top, representative bioluminescent images and radiance levels of lung metastases in the different groups at 8 weeks after tail vein injection. Middle, representative H&E staining showing metastatic nodules in the lungs of nude mice. Bars: 1000 µm (upper); 50 µm (lower). Bottom, overall survival times of the nude mice in the different groups. The data are presented as the means±SDs. **, P<0.01; n.s., not significant.
Figure 4
Figure 4
High-throughput screening and identification of miR-139-5p targets in CRC cells. (A) Major signaling pathways and (B) cellular processes suppressed by miR-139-5p expression in DKO-1 cells, as revealed by KEGG pathway analysis. (C) GSEA revealed negative enrichment of miR-139-5p-altered genes in the RAS (left) and Wnt (right) signaling gene sets. (D) Heatmap of representative RAS- or Wnt-related genes that were predicted to possess miR-139-5p binding sites from the DKO-1 cell transcriptomic results. (E) Left, predicted miR-139-5p binding sites in the 3'-UTRs of human JUN, FOS, DVL1, CTNNB1, TCF4 and ZEB1. CDS, coding sequence. Right, luciferase activity derived from the indicated 3'-UTR reporter constructs after cotransfection of DKO-1 cells with miR-139-5p or negative controls. The results show the means±SDs (error bars) for three experiments performed in triplicate. (F) Immunoblots of JUN, FOS, ZEB1, CTNNB1 and DVL1 levels in the indicated cells after miR-139-5p overexpression or inhibition. (G) EMT gene sets negatively enriched in miR-139-5p-overexpressing DKO-1 cells, as revealed by GSEA. (H) Left, immunofluorescence staining of E-cadherin and Vimentin in the indicated cells after miR-139-5p overexpression or inhibition. Right, immunoblots of E-cadherin, Vimentin and Fibronectin in the indicated CRC cells.
Figure 5
Figure 5
Wnt/β-catenin signaling transcriptionally represses miR-139-5p in KRAS-mutant CRC cells. (A) Left, immunoblots of β-catenin expression in DKs-8 and Caco-2 cells transfected with β-catenin and control plasmids. Right, miR-139-5p expression detected in the indicated cells by qRT-PCR. (B) Left, immunoblots of β-catenin expression in DKO-1 and SW620 cells transfected with β-catenin siRNA (siβ-catenin) or control siRNA (siCtrl). Right, miR-139-5p expression detected in the indicated cells by qRT-PCR. (C) DKs-8 and Caco-2 cells were treated with Wnt3a (5 ng/mL) or DMSO for 24 h. miR-139-5p expression was detected by qRT-PCR. (D) DKO-1 and SW620 cells were treated with ICG-001 (2 µg/mL) or DMSO for 24 h. miR-139-5p expression was detected by qRT-PCR. (E) DKs-8 cells were transfected with TCF3, TCF4, or control plasmid for 48 h. Immunoblotting was performed to examine the expression of TCF3 and TCF4. miR-139-5p expression was detected by qRT-PCR. (F) DKO-1 cells were transfected with TCF3 siRNA (siTCF3) and TCF4 siRNA (siTCF4) for 48 h. Immunoblotting was performed to examine the expression of TCF3 and TCF4. miR-139-5p expression was detected by qRT-PCR. (G) Left, schematic representation of consecutive deletion constructs spanning the promoter region (-5000 to +1) of MIR139, with the site -2373 nucleotides upstream of MIR139 sequence as the transcription start site . The putative TCF4-binding sites in the miR-139 promoter region are shown in black boxes. Right, luciferase activity in DKO-1 cells transfected with the luciferase vector pGL3 driven by either the WT or deletion promoter. (H) Left, schematic representation of the mutation constructs of the miR-139 promoter. Right, luciferase activity in DKO-1 cells transfected with the luciferase vector pGL3 driven by either the WT or mutant promoter. (I) The ChIP assay demonstrated the direct binding of TCF4 to the miR-139 promoter in DKO-1 cells. qRT-PCR was carried out to quantitate the immunoprecipitated products using primers within the miR-139 promoter. Primers within the cyclin D1 and 16q22 promoters served as the positive and negative controls, respectively. *P< 0.05; **P <0.01; n.s., not significant.
Figure 6
Figure 6
Expression patterns of miR-139-5p and its targets in human CRC tissues. (A) ISH of miR-139-5p and IHC of JUN, FOS, CTNNB1, DVL1 and ZEB1 expression in WT (KRASWT) and KRAS-mutant (KRASMT) CRC tissues from the XHDD cohort. Bars: 100 µm (main); 500 µm (inset). (B) Associations between miR-139-5p expression and JUN, FOS, CTNNB1, DVL1 and ZEB1 expression in the XHDD cohort CRC tissues. *P<0.05; **P<0.01. (C) Correlations between the mRNA expression levels of miR-139-5p and those of JUN, FOS, CTNNB1, DVL1 and ZEB1 in XHDD cohort CRC tissues.

References

    1. Siegel RL, Miller KD, Jemal A. Cancer statistics, 2018. CA Cancer J Clin. 2018;68:7–30. - PubMed
    1. Fakih MG. Metastatic colorectal cancer: Current state and future directions. J Clin Oncol. 2015;33:1809–1824. - PubMed
    1. De Roock W, De Vriendt V, Normanno N, Ciardiello F, Tejpar S. KRAS, BRAF, PIK3CA, and PTEN mutations: Implications for targeted therapies in metastatic colorectal cancer. Lancet Oncol. 2011;12:594–603. - PubMed
    1. Roberts PJ, Stinchcombe TE. KRAS mutation: Should we test for it, and does it matter? J Clin Oncol. 2013;31:1112–1121. - PubMed
    1. Fakih MG. Metastatic colorectal cancer: Current state and future directions. J Clin Oncol. 2015;33:1809–1824. - PubMed

Publication types

MeSH terms