. 2020 Jun 22:11:e00138.
doi: 10.1016/j.mec.2020.e00138. eCollection 2020 Dec.

Improving protein solubility and activity by introducing small peptide tags designed with machine learning models

Affiliations

Improving protein solubility and activity by introducing small peptide tags designed with machine learning models

Xi Han et al. Metab Eng Commun. .

Abstract

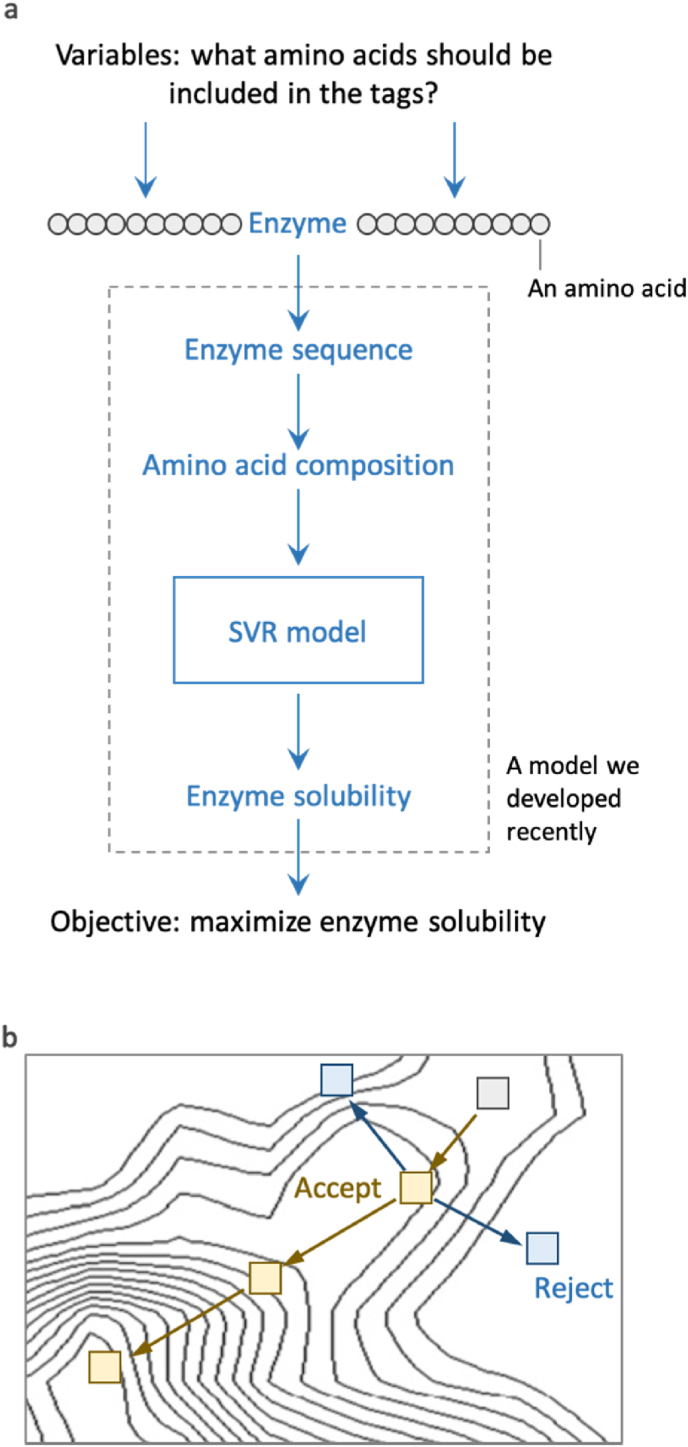
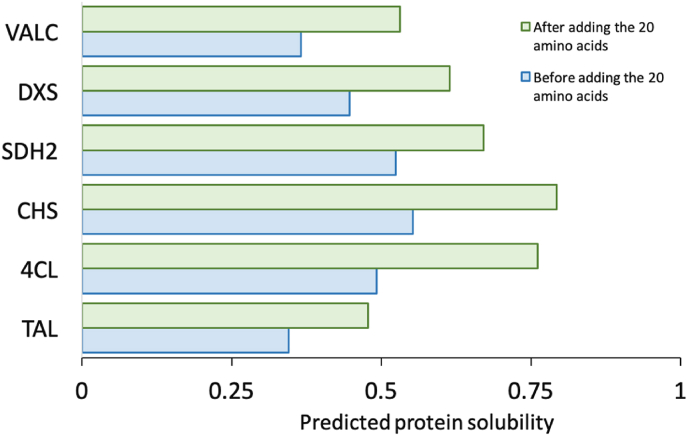
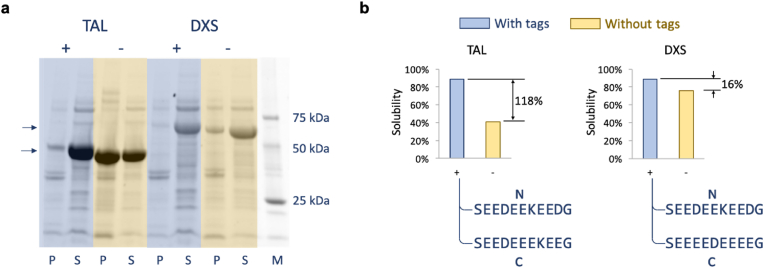
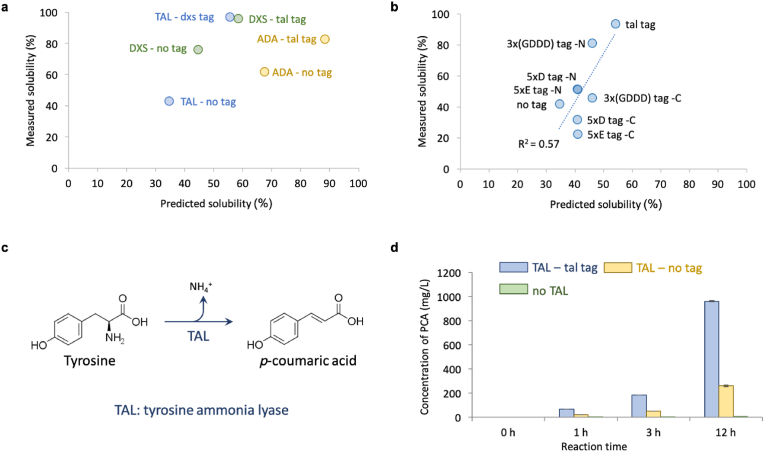
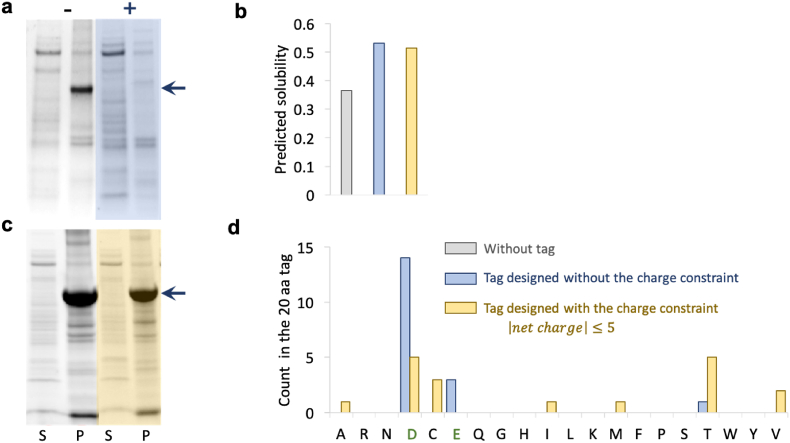
Improving catalytic ability of enzymes is critical to the success of many metabolic engineering projects, but the search space of possible protein mutants is too large to explore exhaustively through experiments. To some extent, highly soluble enzymes tend to exhibit high activity due to their better folding quality. Here, we demonstrate that an optimization algorithm based on a regression model can effectively design short peptide tags to improve solubility of a few model enzymes. Based on the protein sequence information, a support vector regression model we recently developed was used to evaluate protein solubility after small peptide tags were introduced to a target protein. The optimization algorithm guided the sequences of the tags to evolve towards variants that had higher solubility. The optimization results were validated successfully by measuring solubility and activity of the model enzyme with and without the identified tags. The solubility of one protein (tyrosine ammonia lyase) was more than doubled and its activity was improved by 250%. This strategy successfully increased solubility of another two enzymes (aldehyde dehydrogenase and 1-deoxy-D-xylulose-5-phosphate synthase) we tested. The presented optimization methodology thus provides a valuable tool for improving enzyme performance for metabolic engineering and other biotechnology projects.

Keywords: Machine learning; Optimization; Peptide tags; Protein activity; Protein solubility.


Conflict of interest statement

The authors declare that they have no known competing financial interests or personal relationships that could have appeared to influence the work reported in this paper.

Figures

Fig. 1
Fig. 1
Machine learning model assisted optimization of protein solubility. (a) Illustration of the decision variables, optimization objective and the objective function. SVR: support vector regression. A SVR model we recently developed was used in this study (Han et al., 2019). (b) Illustration of the optimization algorithm. Genetic algorithm was used in this study.
Fig. 2
Fig. 2
The predicted solubility before and after adding 20 amino acids for six proteins commonly used in metabolic engineering projects. The six proteins were VALC (valencene synthase), DXS (1-deoxy-D-xylulose-5-phosphate synthase), ADH2 (alcohol dehydrogenase), CHS (chalcone synthase), 4CL (4-coumarate-CoA ligase) and TAL (tyrosine ammonia-lyase). The sequences of oligos used to amplify these proteins are listed in Supplementary Tables S7–S10. Before adding the tags, the protein solubility of each of them was predicted by using SVR and recorded. Then Genetic Algorithm was used to improve their solubility by adding 20 amino acids. The protein solubility after adding the tags was also recorded for comparison.
Fig. 3
Fig. 3
(a) The SDS-PAGE analysis of protein TAL and DXS expressed in E. coli with and without tags designed by our optimization algorithm. “+” and “-” indicate having or not having the peptide tags respectively. “P” and “S” indicate the pellet fraction (insoluble) and supernatant fraction (soluble) respectively. Molecular weight of TAL and DXS were 53.85 ​kDa and 67.49 ​kDa respectively (two arrows were used to indicate them in the figure). Protein TAL and DXS were expressed in K3 medium with 20 ​g/L glucose at 30 ​°C. This experiment was repeated four times and the other SDS-PAGE images were shown in the Supplementary Figs. S3a–c. (b) Quantitative presentation of the SDS-PAGE images in a. Solubility of a protein is defined as the fraction of the soluble protein molecules among all the protein molecules. The protein amount was estimated by using band intensity on SDS-PAGE images. The sequences of the designed tags for N-terminal and C-terminal were shown. The amino acid S and G on the two ends of the tags were the linkers for GT DNA assembly standard, which was used to guide plasmid construction in this study (Ma et al., 2019).
Fig. 4
Fig. 4
(a) The predicted and measured solubility of TAL, DXS and ADA after adding tags designed for other proteins. The purpose of switching tags was to test if the solubility-enhancing tags were generally effective in improving protein solubility. The same protein was labelled by using the same color to highlight the data before and after adding tags. In the data labels, the text before “-” indicates protein name and the text after “-” indicates the tags used if any. In the process of measuring the solubility, the protein expression condition was K3 medium with 20 ​g/L glucose at 30 ​°C. The SDS-PAGE images were shown in the Supplementary Fig. S3d. (b) The comparison of the tags designed in this study with tags used in previous studies. Protein TAL was the only model protein used in this plot. No tag: solubility of TAL without any tag. Tal tag: solubility of TAL when we added the tags that were designed by our optimization algorithm for TAL. 5xE tag –N/C: solubility of TAL when 5xE tag (EEEEE) was added to its N- or C-terminus. 5xD tag –N/C: solubility of TAL when 5xD tag (DDDDD) was added to its N- or C-terminus. 3x(GDDD) –N/C: solubility of TAL when 3x(GDDD) tag (GDDDGDDDGDDD) was added to its N- or C-terminus. 5xD, 5xE and 3x(GDDD) were three tags used in a previous study and used here for comparison (Paraskevopoulou and Falcone, 2018). Since in previous studies, only one tag was added to one protein, either at N- or C-terminus, we tested both cases for each tag. The two tags we designed for TAL were added to both ends of TAL (Fig. 1, Fig. 3b). The sequences of all the tags are provided in Supplementary Tables S7–S10. The SDS-PAGE images were shown in the Supplementary Fig. S3f. (c) The reaction catalyzed by protein TAL. (d) The enzymatic activity of protein TAL before and after introducing the tal tag. A control was included to show that there was no reaction if TAL protein was absent. The product of the reaction catalyzed by protein TAL was p-coumaric acid (PCA) and its concentration was used to indicate the activity of protein TAL. Cell lysate containing TAL was used in the reaction. TAL – tal tag: the strain containing TAL with the tags designed in this study. Tal – no tag: the strain containing TAL without any tag. No TAL: the strain that did not express TAL. Each bar indicates the mean value of six replicates. The error bars indicate standard error (n ​= ​6).
Fig. 5
Fig. 5
(a) The SDS-PAGE analysis of protein VALC expressed in E. coli without tag (”-“) and with the tag designed without the charge constraint (”+“). “P” and “S” represented the pellet (insoluble) fraction and soluble fraction respectively. (b) The predicted solubility of protein VALC without tag (grey), with the tag designed without the charge constraint (blue) and with the tag designed with the charge constraint (yellow). (c) The SDS-PAGE analysis of protein VALC expressed in E. coli without tag (”-“) and with the tag designed with the charge constraint (”+“). (d) The number of amino acid contained in the 20-amino-acid tag designed for protein VALC.
Fig. 6
Fig. 6
(a) Importance of various amino acids in determining the accuracy of the SVR model. The R2 of the SVR model was shown by using a heat map after removing the information of two types of amino acids. Model training is described in Materials and Methods. Single letter amino acid abbreviations are used in this figure. All the combinations of removing two types of amino acids are tested and the performance of the resulting models is presented in the upper triangular matrix. Performance of the models was gauged by using R2, which is presented here by using color (a color bar is provided). The darker the color is, the more important the related amino acids are to the model performance. (b) The distribution of amino acid composition (the input variables of the SVR model we used) among all the proteins in the eSol database (the date source we used to train the SVR model). The violin plot showed the mean value and the range of the amino acid composition used to train the SVR model. (c) The Spearman’s rank correlation between actual/predicted protein solubility and various amino acids. Spearman’s correlation, ρspearman, is a measure of monotonicity and represents the general sensitivity of solubility to amino acid composition. A comparison between the Spearman’s rank correlation tornado plot for actual solubility and predicted solubility depicted how the model captured and magnified general trends between amino acid composition and solubility. For example, for both the actual and predicted solubility of proteins in the eSol dataset, the composition of D, E, or K was positively correlated with solubility.

References

    1. Agostini F., Vendruscolo M., Tartaglia G.G. Sequence-based prediction of protein solubility. J. Mol. Biol. 2012;421(2–3):237–241. - PubMed
    1. Bianchi E., Venturini S., Pessi A., Tramontano A., Sollazzo M. High level expression and rational mutagenesis of a designed protein, the minibody: from an insoluble to a soluble molecule. J. Mol. Biol. 1994;236(2):649–659. - PubMed
    1. Bojarski M., Del Testa D., Dworakowski D., Firner B., Flepp B., Goyal P.…Zhang J. 2016. End to End Learning for Self-Driving Cars. arXiv preprint arXiv:1604.07316.
    1. Chan P., Curtis R.A., Warwicker J. Soluble expression of proteins correlates with a lack of positively-charged surface. Sci. Rep. 2013;3:3333. - PMC - PubMed
    1. Chan W.-C., Liang P.-H., Shih Y.-P., Yang U.-C., Lin W.-c., Hsu C.-N. Learning to predict expression efficacy of vectors in recombinant protein production. BMC Bioinf. 2010;11(1):S21. - PMC - PubMed

LinkOut - more resources