. 2020 Jun 11;12(12):946-957.
doi: 10.1093/jmcb/mjaa033.

Proteome-wide data analysis reveals tissue-specific network associated with SARS-CoV-2 infection

Affiliations

Proteome-wide data analysis reveals tissue-specific network associated with SARS-CoV-2 infection

Li Feng et al. J Mol Cell Biol. .

Abstract

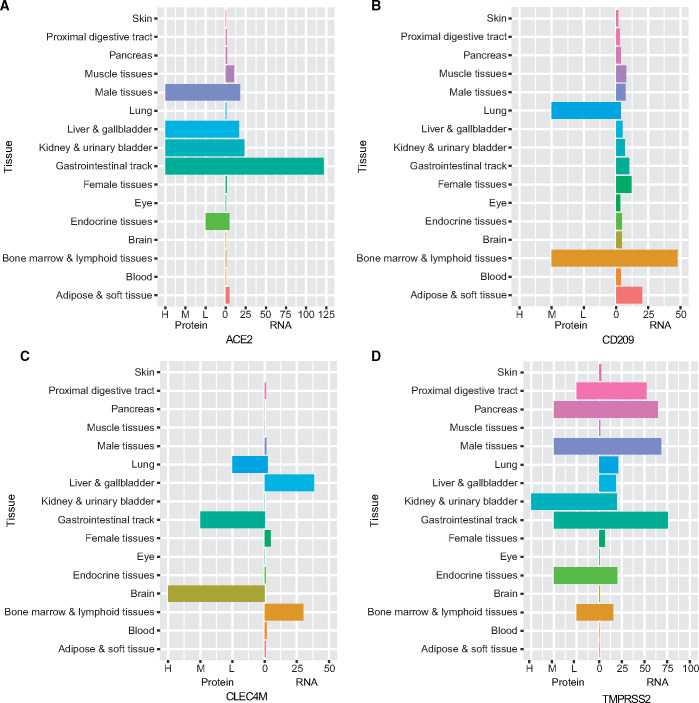
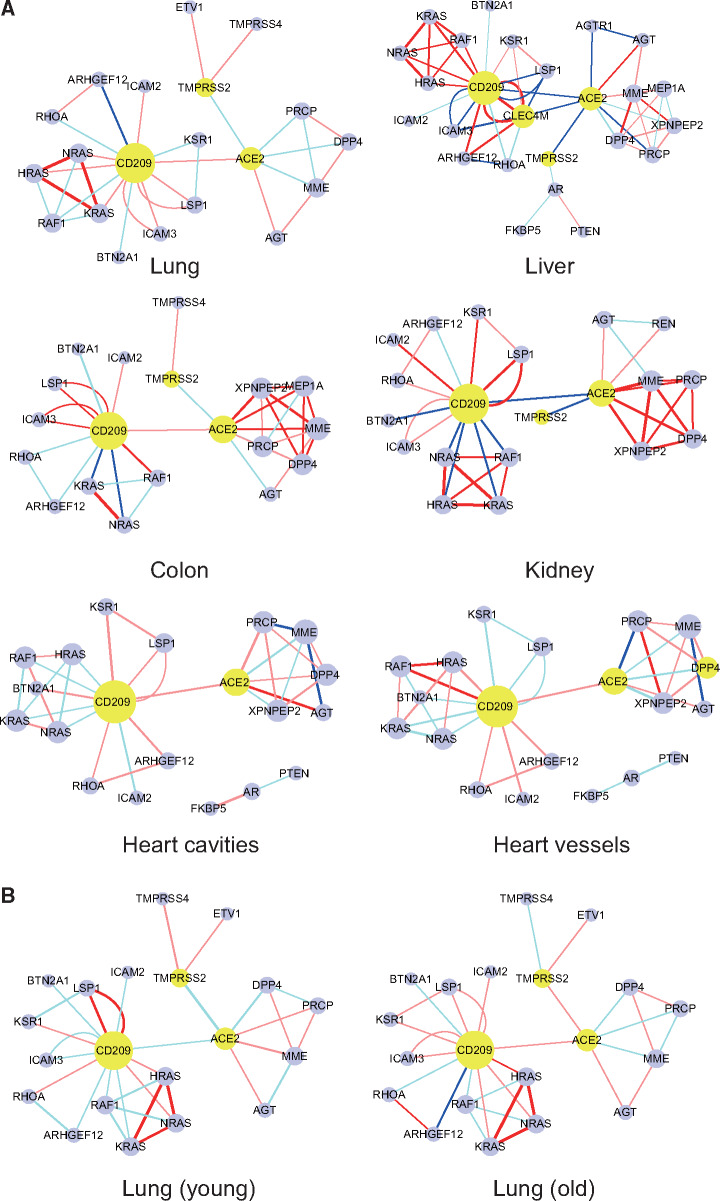
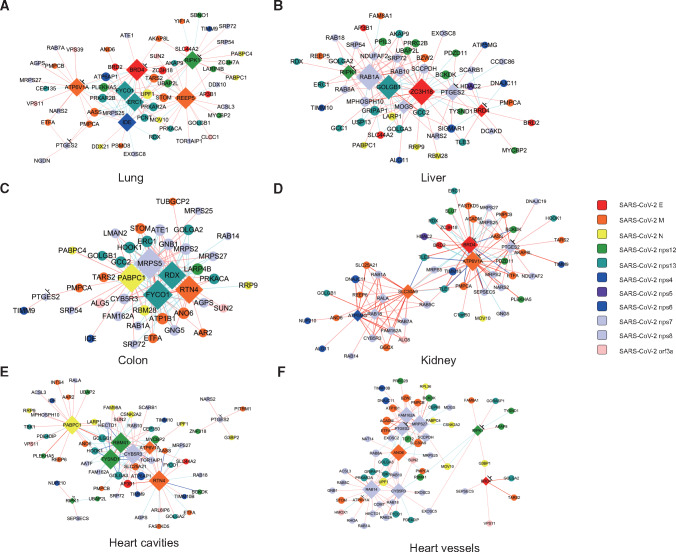
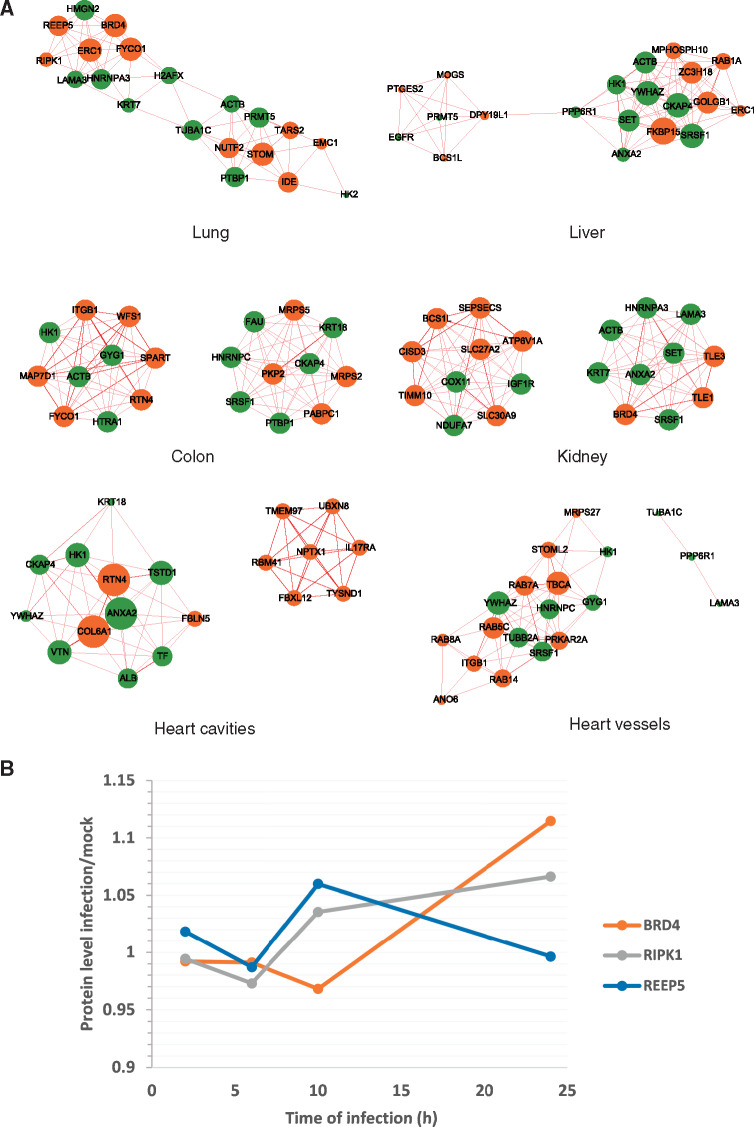
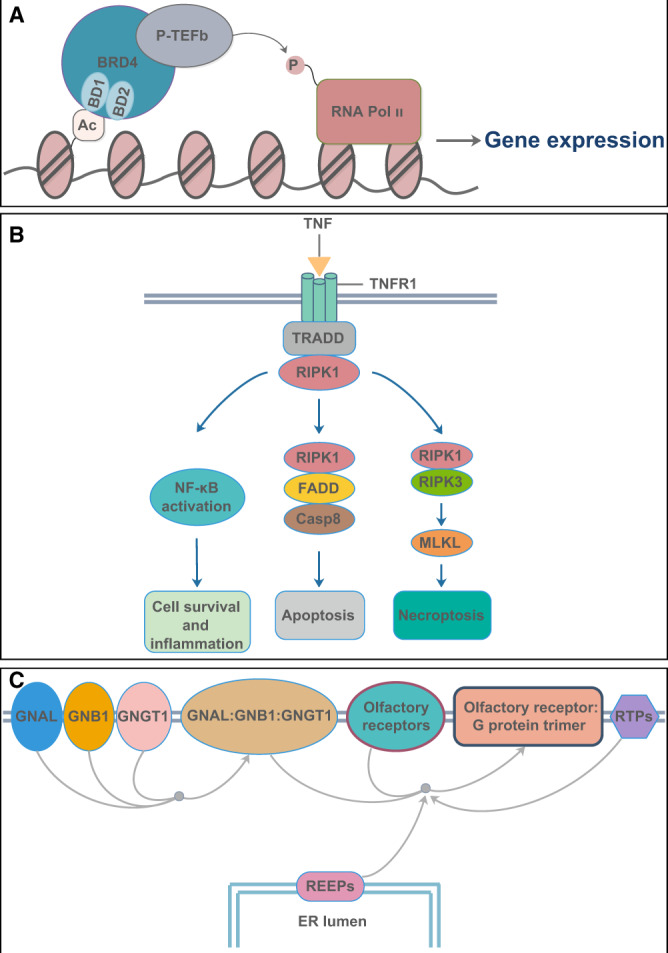
For patients with COVID-19 caused by severe acute respiratory syndrome coronavirus 2 (SARS-CoV-2), the damages to multiple organs have been clinically observed. Since most of current investigations for virus-host interaction are based on cell level, there is an urgent demand to probe tissue-specific features associated with SARS-CoV-2 infection. Based on collected proteomic datasets from human lung, colon, kidney, liver, and heart, we constructed a virus-receptor network, a virus-interaction network, and a virus-perturbation network. In the tissue-specific networks associated with virus-host crosstalk, both common and different key hubs are revealed in diverse tissues. Ubiquitous hubs in multiple tissues such as BRD4 and RIPK1 would be promising drug targets to rescue multi-organ injury and deal with inflammation. Certain tissue-unique hubs such as REEP5 might mediate specific olfactory dysfunction. The present analysis implies that SARS-CoV-2 could affect multi-targets in diverse host tissues, and the treatment of COVID-19 would be a complex task.

Keywords: SARS-CoV-2; proteome-wide; tissue-specific.


Figures

Figure 1
Figure 1
Protein expression and RNA transcription of SARS-CoV-2 receptors (ACE2, CD209, and CLEC4M) and the serine protease TMPRSS2. For protein data, each bar represents the highest expression score found in a group of tissues. RNA expression summary shows the consensus RNA data based on normalized expression data. Details are in Materials and methods.
Figure 2
Figure 2
Receptor-centered PPI networks in six normal tissues of five organs. The yellow ones are the receptors. The red edge in the network indicates a significant or strong-positive correlation between the two proteins, while pink indicates a non-significant or weak-positive correlation. Dark blue indicates a significant or strong-negative correlation, while light blue indicates a non-significant or weak-negative correlation. The thickness of the edge is determined by the correlation coefficient.
Figure 3
Figure 3
Correlation networks consisting of hub proteins interacted with SARS-CoV-2 in six tissues. Each color represents a specific SARS-CoV-2 protein that interacts with the nodes (shown on the right). Major hubs are marked by diamond. Hubs that can be drug targets are marked with ‘⊥’, including ATP6V1A, BRD4, PTGES2, and RIPK1 in lung, BRD4, PTGES2, and RIPK1 in liver, PTGES2 in colon, ATP6V1A, BRD4, and PTGES2 in kidney, ATP6V1A, PTGES2, and RIPK1 in heart cavities, as well as ATP6V1A, BRD4, PTGES2, and RIPK1 in heart vessels. The coloring principle of edges is the same as described in Figure 2.
Figure 4
Figure 4
The hubs–hubs network and the changes of key hubs over time upon SARS-CoV-2 infection. (A) Core positive correlation networks consisting of hub proteins affected by SARS-CoV-2 (green) and hub proteins interacted with SARS-CoV-2 (orange) in six tissues. The coloring principle of edges is the same as described in Figure 2. (B) The change curves of selected hub proteins in lung, according to the proteome data after SARS-CoV-2 infection in human Caco-2 cells. The X-axis indicates different time points, and the Y-axis indicates the fold change of hub proteins at each time point (infection/control).
Figure 5
Figure 5
Brief functional diagram of three key proteins. (A) The functional diagram of BRD4. (B) RIPK1 participates in NF-κB activation, FADD–caspase 8-mediated apoptosis, and RIPK3–MLKL-mediated necroptosis pathway. Casp8, caspase 8; TNFR1, tumor necrosis factor receptor 1; TRADD, tumor necrosis factor receptor-associated protein with death domain. (C) The olfactory signal pathway involved in REEPs. ER, endoplasmic reticulum; GNAL, guanine nucleotide-binding protein Golf subunit alpha; GNB1, guanine nucleotide-binding protein GI/GS/GT subunit beta-1; GNGT1, guanine nucleotide-binding protein GT subunit gamma-T1; RTPs, receptor transporting proteins.

References

    1. Bartz F., Kern L., Erz D., et al. (2009). Identification of cholesterol-regulating genes by targeted RNAi screening. Cell Metab. 10, 63–75. - PubMed
    1. Bojkova D. Klann K. KochB., et al ( . 2020). Proteomics of SARS-CoV-2-infected host cells reveals therapy targets. Nature 583, 469–472. - PMC - PubMed
    1. Cai G., Cui X., Zhu X., et al. (2020). A hint on the COVID-19 risk: population disparities in gene expression of three receptors of SARS-CoV. Preprints, doi: 10.20944/preprints202002.0408.v1.
    1. Chiara F., Castellaro D., Marin O., et al. (2008). Hexokinase II detachment from mitochondria triggers apoptosis through the permeability transition pore independent of voltage-dependent anion channels. PLoS One 3, e1852. - PMC - PubMed
    1. Cho Y.S., Challa S., Moquin D., et al. (2009). Phosphorylation-driven assembly of the RIP1–RIP3 complex regulates programmed necrosis and virus-induced inflammation. Cell 137, 1112–1123. - PMC - PubMed

Publication types

MeSH terms