

Complete Chloroplast Genomes of Anthurium huixtlense and Pothos scandens (Pothoideae, Araceae): Unique Inverted Repeat Expansion and Contraction Affect Rate of Evolution
- PMID: 32642873
- PMCID: PMC7445159
- DOI: 10.1007/s00239-020-09958-w
Complete Chloroplast Genomes of Anthurium huixtlense and Pothos scandens (Pothoideae, Araceae): Unique Inverted Repeat Expansion and Contraction Affect Rate of Evolution
Abstract
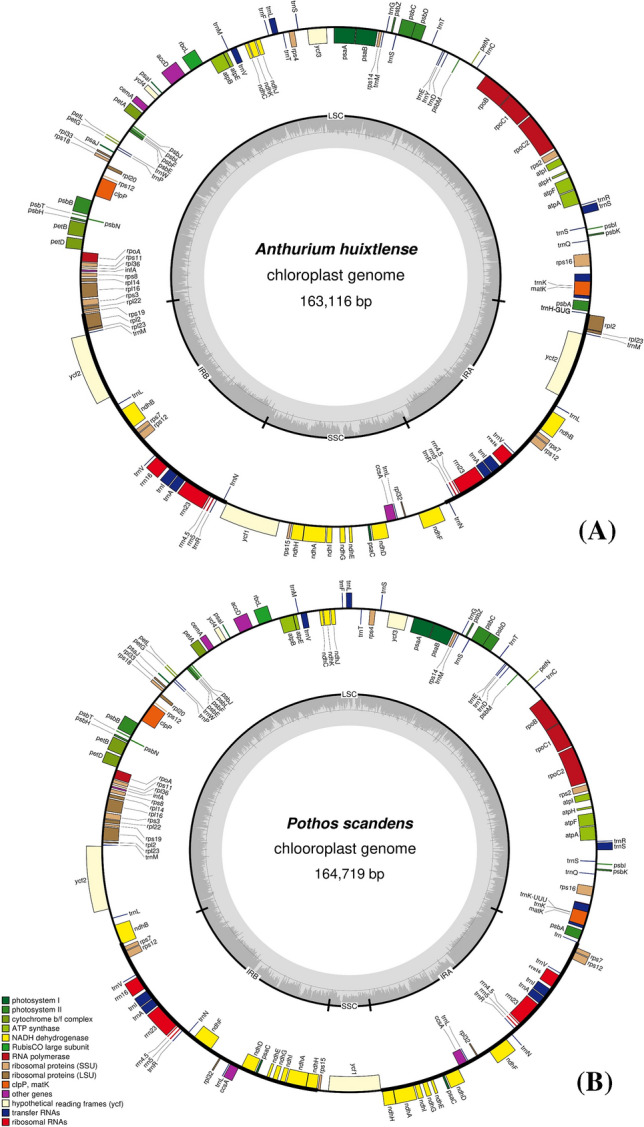
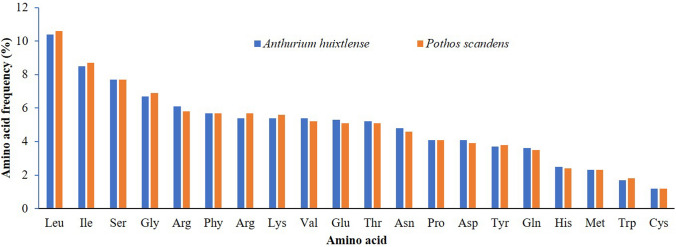
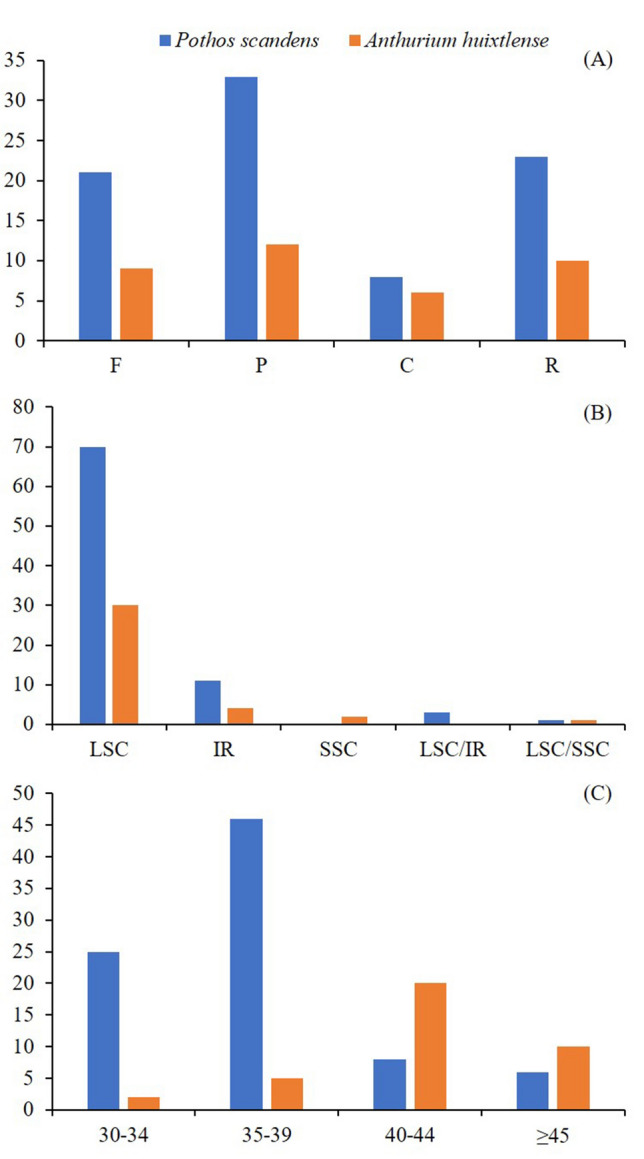
The subfamily Pothoideae belongs to the ecologically important plant family Araceae. Here, we report the chloroplast genomes of two species of the subfamily Pothoideae: Anthurium huixtlense (size: 163,116 bp) and Pothos scandens (size: 164,719 bp). The chloroplast genome of P. scandens showed unique contraction and expansion of inverted repeats (IRs), thereby increasing the size of the large single-copy region (LSC: 102,956 bp) and decreasing the size of the small single-copy region (SSC: 6779 bp). This led to duplication of many single-copy genes due to transfer to IR regions from the small single-copy (SSC) region, whereas some duplicate genes became single copy due to transfer to large single-copy regions. The rate of evolution of protein-coding genes was affected by the contraction and expansion of IRs; we found higher mutation rates for genes that exist in single-copy regions as compared to those in IRs. We found a 2.3-fold increase of oligonucleotide repeats in P. scandens when compared with A. huixtlense, whereas amino acid frequency and codon usage revealed similarities. The ratio of transition to transversion mutations was 2.26 in P. scandens and 2.12 in A. huixtlense. Transversion mutations mostly translated in non-synonymous substitutions. The phylogenetic inference of the limited species showed the monophyly of the Araceae subfamilies. Our study provides insight into the molecular evolution of chloroplast genomes in the subfamily Pothoideae and family Araceae.
Keywords: Anthurium; Araceae; Gene evolution; Gene rearrangement; Inverted repeat contraction and expansion; Pothoideae; Pothos.
Conflict of interest statement
No conflict of interest exists.
Figures


References
-
- Abdullah, Shahzadi I, Mehmood F, et al. Comparative analyses of chloroplast genomes among three Firmiana species: identification of mutational hotspots and phylogenetic relationship with other species of Malvaceae. Plant Gene. 2019;19:100199. doi: 10.1016/J.PLGENE.2019.100199. - DOI
-
- Abdullah, Waseem S, Mirza B, et al. Comparative analyses of chloroplast genome in Theobroma cacao and Theobroma grandiflorum. Biologia (Bratisl) 2019 doi: 10.2478/s11756-019-00388-8. - DOI
-
- Abdullah, Mehmood F, Shahzadi I, et al. Correlations among oligonucleotide repeats, nucleotide substitutions and insertion-deletion mutations in chloroplast genomes of plant family Malvaceae. J Syst Evol. 2020 doi: 10.1111/jse.12585. - DOI
Publication types
MeSH terms
LinkOut - more resources
Full Text Sources
