

Rewired signaling network in T cells expressing the chimeric antigen receptor (CAR)
- PMID: 32643825
- PMCID: PMC7429742
- DOI: 10.15252/embj.2020104730
Rewired signaling network in T cells expressing the chimeric antigen receptor (CAR)
Abstract
The chimeric antigen receptor (CAR) directs T cells to target and kill specific cancer cells. Despite the success of CAR T therapy in clinics, the intracellular signaling pathways that lead to CAR T cell activation remain unclear. Using CD19 CAR as a model, we report that, similar to the endogenous T cell receptor (TCR), antigen engagement triggers the formation of CAR microclusters that transduce downstream signaling. However, CAR microclusters do not coalesce into a stable central supramolecular activation cluster (cSMAC). Moreover, LAT, an essential scaffold protein for TCR signaling, is not required for microcluster formation, immunological synapse formation, nor actin remodeling following CAR activation. However, CAR T cells still require LAT for an optimal production of the cytokine IL-2. Together, these data show that CAR T cells can bypass LAT for a subset of downstream signaling outputs, thus revealing a rewired signaling pathway as compared to native T cells.
Keywords: CAR; LAT; T cell signaling; actin; immunological synapse.
© 2020 The Authors.
Conflict of interest statement
The authors declare competing financial interests: A.M. is a cofounder of Spotlight Therapeutics and Arsenal Biosciences and serves on their boards of directors and scientific advisory boards. A.M. has served as an advisor to Juno Therapeutics, is a member of the scientific advisory board at PACT Pharma, and is an advisor to Trizell. A.M. owns stock in Arsenal Biosciences, Spotlight Therapeutics and PACT Pharma. The Marson Laboratory has received research support from Juno Therapeutics, Epinomics, Sanofi, Anthem Blue Cross Blue Shield, GlaxoSmithKline, and Gilead.
Figures
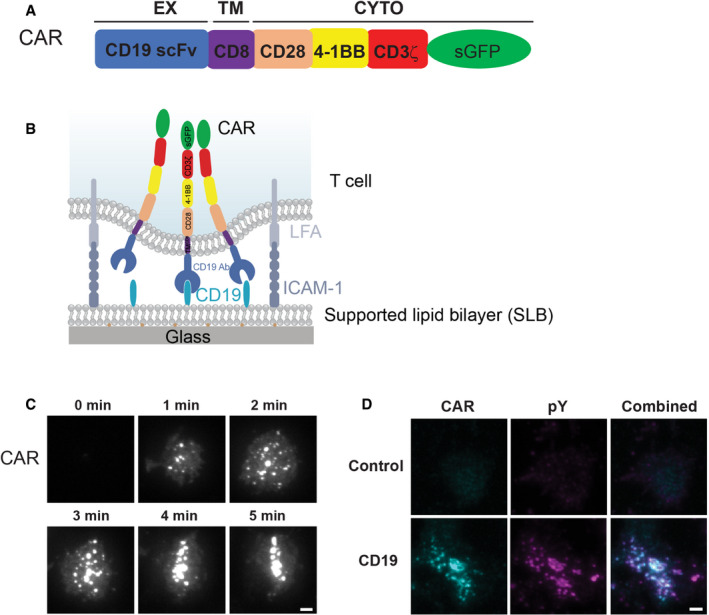
Domain structure of CAR.
Schematic of the system for stimulating CAR T cells and imaging CAR dynamics. Supported lipid bilayers (SLBs) were coated with the extracellular domain of CD19 and an integrin ligand ICAM‐1.
TIRF microscopy revealed the time courses of the CAR‐GFP microcluster formation as CAR T cells spread on the CD19‐ and ICAM‐1‐coated SLBs.
Enrichment of phosphotyrosine (pY) at CAR microclusters. CAR T cells were fixed 20 min after being plated on the SLB, followed by staining with an anti‐pan phosphotyrosine antibody. No CD19 was included in the control experiment (only ICAM‐1). Scale bar: 2 μm.
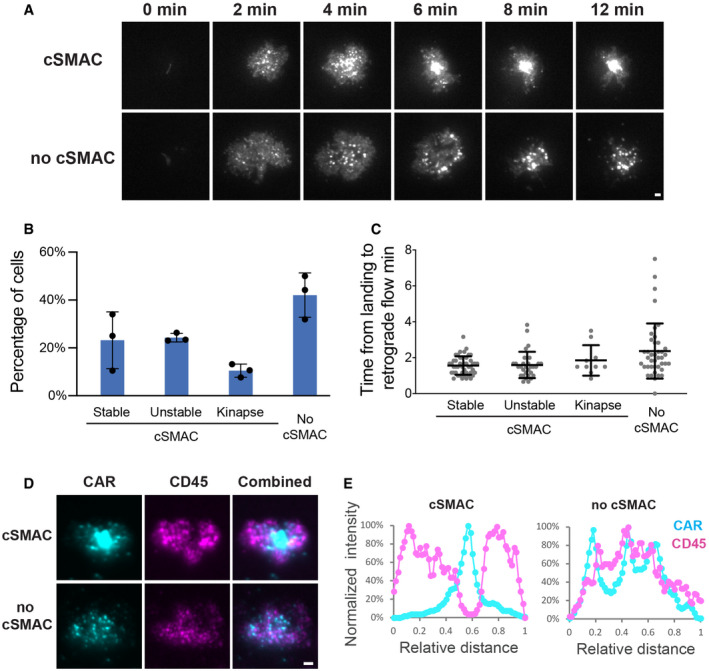
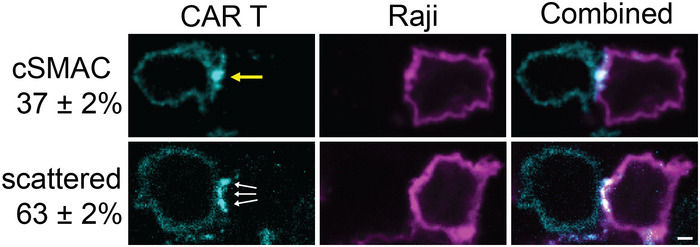
CAR microclusters underwent centripetal movement to form cSMAC (upper panel) or remained separated (lower panel).
Quantification of the categories regarding the formation of CAR cSMAC. Unstable cSMACs are defined by a cSMAC duration below 12 min. Data are shown as mean ± SD. n = 3 independent experiments. 37, 38, and 47 cells were quantified in individual experiments.
Quantification of time from cell landing to the start of retrograde flow. Data are shown as mean ± SD. n = 33 (stable), 31 (unstable), 10 (kinapse), and 41 (no cSMAC) cells. Results are pooled from three independent experiments.
Localization of CAR and CD45 in the immunological synapse. CAR T cells were fixed 20 min after being plated on the SLB, followed by staining with an anti‐CD45 antibody.
Line scan of CAR and CD45 across the long axis of the immunological synapse. Shown is the normalized fluorescence intensity.
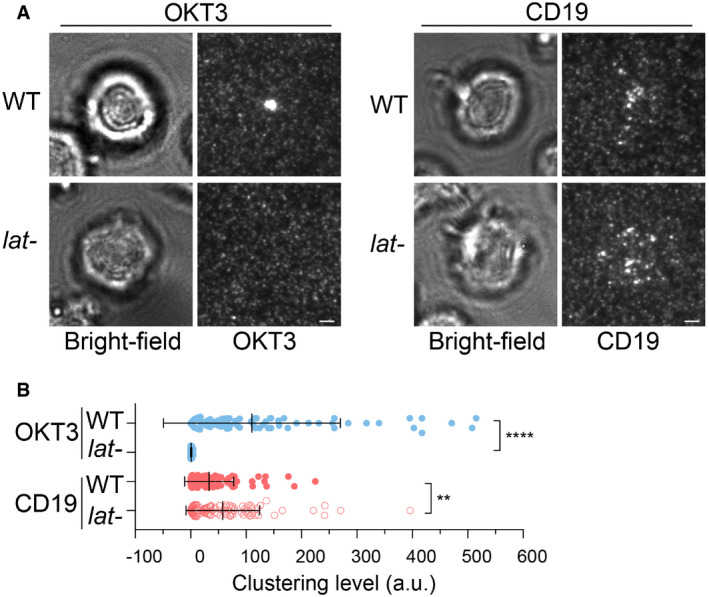
WT or LAT‐deficient Jurkat cells (Jcam2.5) expressing CAR‐GFP were stimulated on SLB‐coated with OKT3 (anti‐TCR antibody) or CD19 (CAR antigen); in both conditions, the lipid bilayers were also coated with ICAM‐1 to facilitate cell attachment. TIRF microscopy revealed clustering of Ax647‐labeled streptavidin–biotin‐OKT3 or CD19, which serves as a probe for TCR or CAR, respectively. Scale bar, 2 μm.
Quantification of clustering as normalized variance. n = 100 cells. Shown are the means ± SD. Statistical test: unpaired two‐tailed t‐test. ****P < 0.0001. **0.005 < P < 0.05.
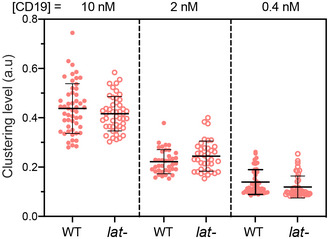
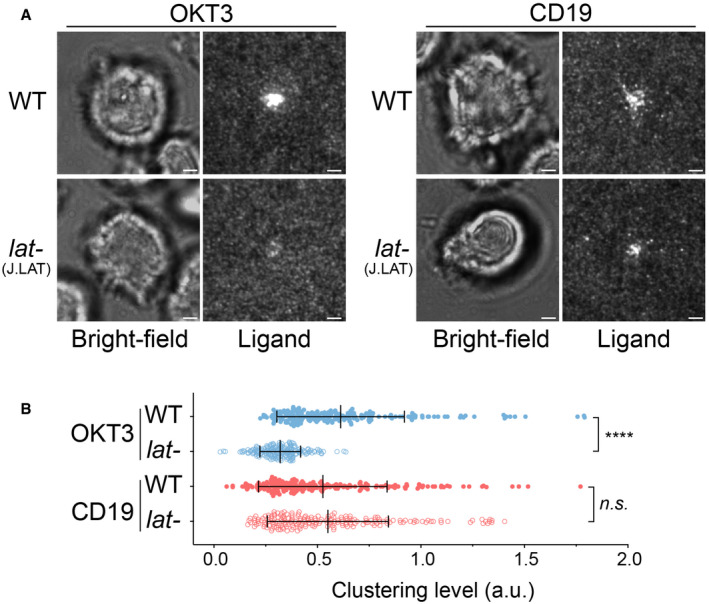
WT or LAT‐deficient (J.LAT) Jurkat cells expressing CAR were stimulated on supported lipid bilayers coated with OKT3 (anti‐TCR antibody) or CD19 (CAR antigen) supplemented with ICAM‐1, respectively. TIRF microscopy revealed clustering of Ax647‐labeled streptavidin–biotin‐OKT3 or CD19, which serves as a probe for TCR or CAR, respectively. Scale bar, 2 μm.
Quantification of clustering as normalized variance. n = 200 cells for each condition. Shown are the mean ± SD. Statistical test: unpaired two‐tailed t‐test. ****P < 0.0001, n.s., P = 0.4208.
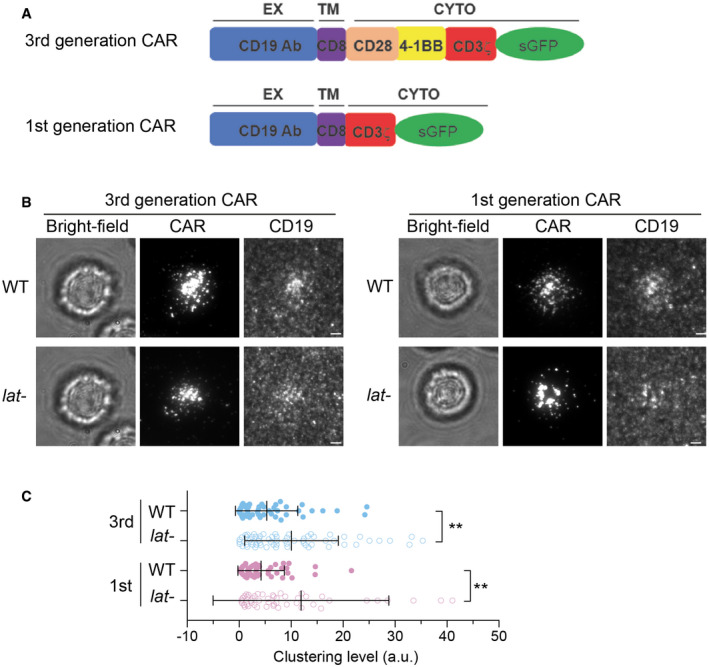
Schematics of 3rd and 1st generation of CAR
WT or LAT‐deficient (Jcam2.5) cells expressing the 3rd‐ or 1st‐generation CAR were stimulated on supported lipid bilayers coated with CD19 and ICAM‐1. TIRF microscopy revealed clustering of CAR and Ax647‐labeled streptavidin–biotin‐CD19. Scale bar, 2 μm.
Quantification of clustering level of Ax647‐labeled streptavidin–biotin‐CD19. Shown are means ± SD. Clustering is quantified as normalized variance. N = 50 cells for CAR 3rd WT and 1st WT, 63 cells for CAR 3rd lat‐, and 51 cells for CAR 1st lat‐. **: 0.0005 < P < 0.005. Statistical test: unpaired two‐tailed t‐test.
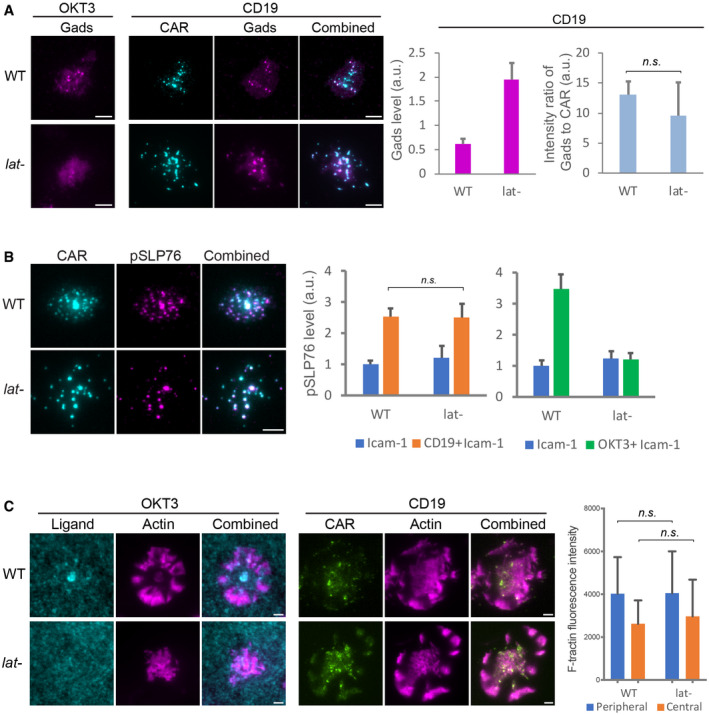
Gads was recruited to CAR microclusters in both the wild‐type and LAT‐deficient (Jcam2.5) cells. n = 33 or 34 cells. Shown are the means ± SE. n.s., P = 0.58 by unpaired two‐tailed t‐test. As a control, Gads is not recruited to LAT‐deficient cells activated by OKT3.
Phosphorylated SLP76, recognized by an anti‐SLP76 pY145 antibody, was enriched in CAR microclusters in both the wild‐type and LAT‐deficient cells. In contrast, phosphorylated SLP76 was not enriched in TCR microclusters in LAT‐deficient cells. n = 50 cells. Shown are the means ± SE. n.s., P = 0.95 by unpaired two‐tailed t‐test.
Actin remodeling was induced in LAT‐deficient cells by CD19‐coated but not OKT3‐coated SLB. No ICAM‐1 was supplemented to SLB in this experiment to rule out the costimulation of actin via the LFA‐1/ICAM‐1 pathway. Actin network was revealed by F‐tractin‐mScarlet. n = 6 cells. Shown are the means ± SD. n.s., P = 0.68, and 0.98 by unpaired two‐tailed t‐test.
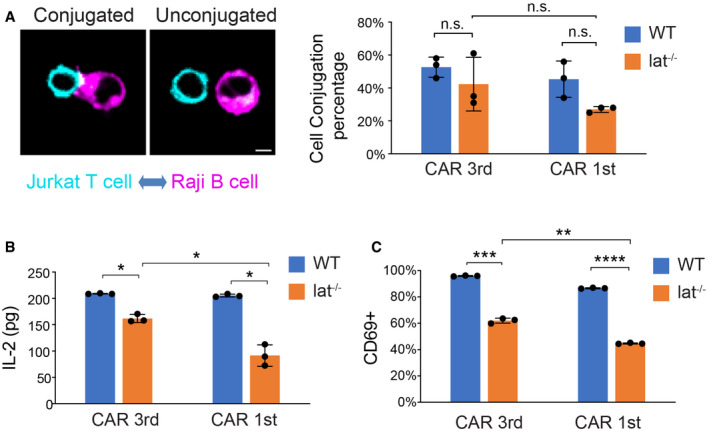
Cell–cell conjugation assay. Wild‐type or Lat‐null (J.LAT) Jurkat T cells expressing CAR‐GFP were mixed with Raji B cells expressing mCherry‐CAAX at a 1:1 ratio for 1 h before being fixed. Three independent experiments were performed, and over 90 cells were scored in each experiment. Scale bar: 5 μm.
CAR T cells were incubated with Raji B cells at a 1:1 ratio for 24 h, and IL‐2 from the supernatant was measured by ELISA.
CAR T cells were incubated with Raji B cells at a 1:1 ratio and fixed at 24 h, stained with an anti‐CD69 antibody, and analyzed by FACS. CD69‐positive cells were scored within the CAR‐GFP+ population.
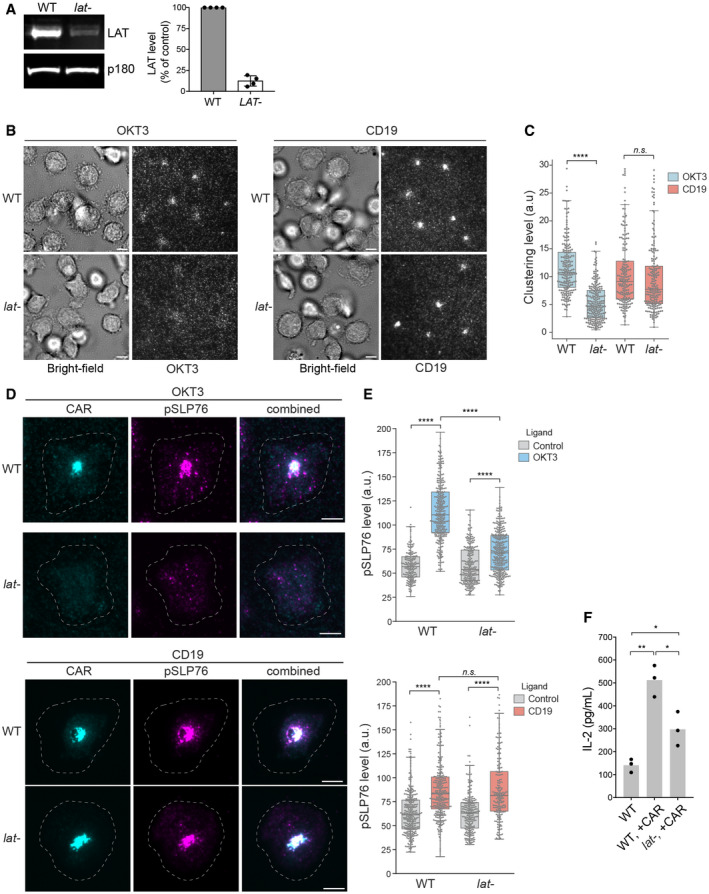
Western blot showed that LAT is efficiently depleted in human primary T cells using CRISPR. Shown are the means ± SD. n = 4 independent experiments.
CAR T cells were stimulated on SLBs coated with biotin‐OKT3 (left) or biotin‐CD19 (right) supplemented with ICAM‐1. TIRF microscopy revealed clustering of Alexa Fluor 647‐labeled streptavidin–biotin‐OKT3 or CD19. Scale bar, 5 μm.
Quantification of clustering of OKT3 or CD19 as normalized variance. n > 200 cells from two independent donors were scored for each condition. Central band: mean; box: quartiles; whisker: rest of the distribution. ****P < 0.0001; n.s. P = 0.48.
Immunofluorescence analysis revealed membrane‐localized phosphorylated SLP76. Cells were plated on supported lipid bilayer coated with ICAM‐1 only (control) or ICAM‐1 supplemented with CD19 or OKT3 as indicated. The white dashed circle indicated cell boundary. Scale bar, 5 μm.
Quantification of pSLP76 level on the membrane. n > 200 cells were scored, and the cells were isolated from two independent donors. Central band: mean; box: quartiles; whisker: rest of the distribution. ****P < 0.0001; n.s. P = 0.11.
T cells were incubated with Raji B cells at a 4:1 ratio, and IL‐2 production was measured by ELISA at 24 h. Data were pooled from three donors. *0.005 < P < 0.05; **0.0005 < P < 0.005. Unpaired two‐tailed t‐test was applied.
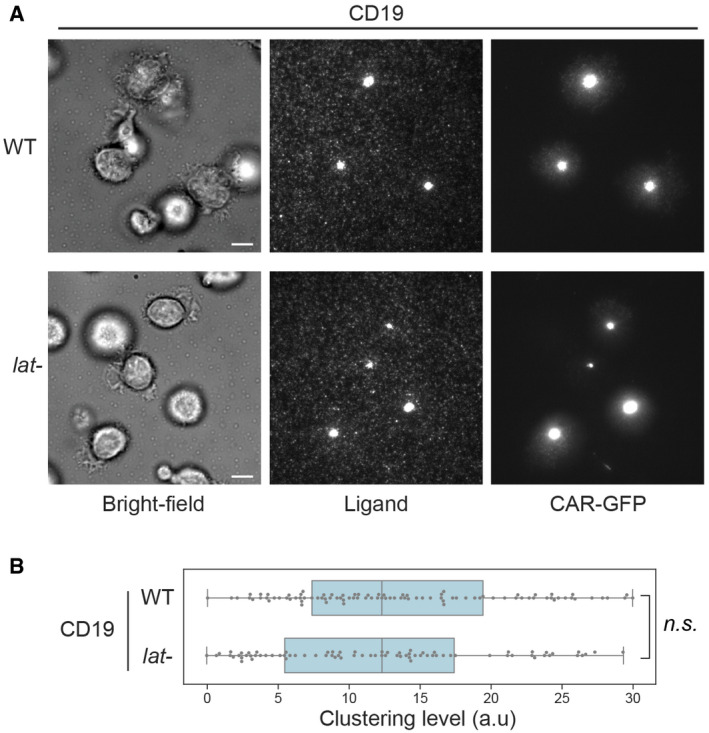
WT or LAT‐knockout (lat‐) primary T cells expressing the 1st‐generation CAR were stimulated on SLBs coated with biotin‐CD19 and his‐ICAM‐1. TIRF microscopy revealed clustering of Ax647‐labeled streptavidin–biotin‐CD19 and CAR. Scale bar, 5 μm.
Quantification of clustering level of Ax647‐labeled streptavidin–biotin‐CD19. Central band: mean; box: quartiles; whisker: rest of the distribution. n = 123 cells for WT, 106 cells for lat‐. Clustering is quantified as normalized variance. n.s. P = 0.67. Statistical test: unpaired two‐tailed t‐test.
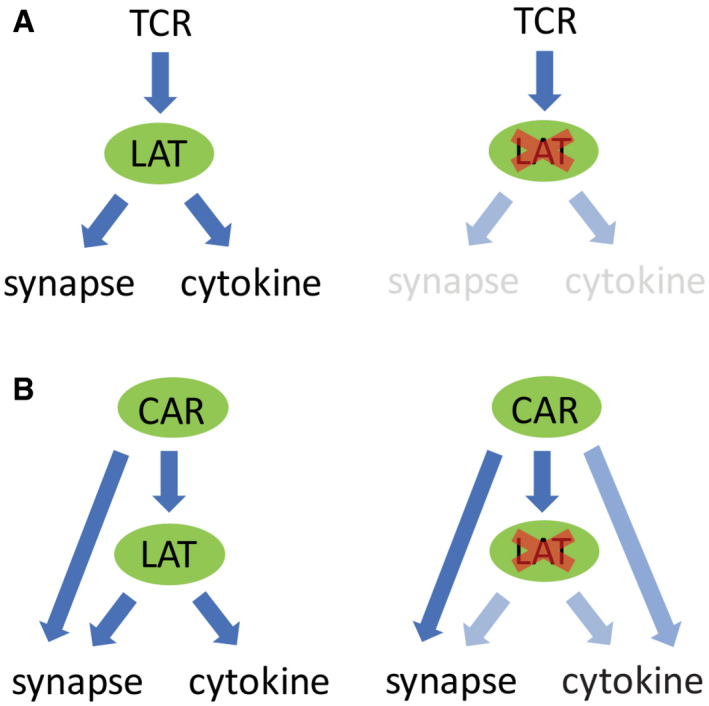
Activated TCR triggers LAT phosphorylation, which promotes microcluster formation. Microclusters further transduce signal to downstream pathways that induce synapse formation and cytokine production. No microclusters or synapses are formed in the absence of LAT.
In contrast, when CAR is activated, it induces microcluster formation even in the absence of LAT. CAR could directly recruit LAT binding partners to trigger downstream signaling that leads to synapse formation and partial cytokine production.
References
-
- Barda‐Saad M, Braiman A, Titerence R, Bunnell SC, Barr VA, Samelson LE (2005) Dynamic molecular interactions linking the T cell antigen receptor to the actin cytoskeleton. Nat Immunol 6: 80–89 - PubMed
-
- Bubeck Wardenburg J, Pappu R, Bu JY, Mayer B, Chernoff J, Straus D, Chan AC (1998) Regulation of PAK activation and the T cell cytoskeleton by the linker protein SLP‐76. Immunity 9: 607–616 - PubMed
-
- Bunnell SC, Kapoor V, Trible RP, Zhang W, Samelson LE (2001) Dynamic actin polymerization drives T cell receptor‐induced spreading: a role for the signal transduction adaptor LAT. Immunity 14: 315–329 - PubMed
Publication types
MeSH terms
Substances
Grants and funding
- Jane Coffin Childs Memorial Fund for Medical Research (JCCF)
- Yale University (Yale)
- HHS|National Institutes of Health (NIH)
- Chan Zuckerberg Biohub
- Innovative Genomics Institute (IGI)
- Parker Institute for Cancer Immunotherapy (Parker Institute)
- Andrew McDonough B+ Foundation
- Cancer Research Institute (CRI)
- Care-for-Rare Foundation
- German Research Foundation
- Burroughs Wellcome Fund
- American Cancer Society
- Charles H. Hood Foundation
- Gilead Sciences
- Rally Foundation
- HHMI/Howard Hughes Medical Institute/United States
LinkOut - more resources
Full Text Sources
Other Literature Sources
Research Materials
