

LRRK2 activation controls the repair of damaged endomembranes in macrophages
- PMID: 32643832
- PMCID: PMC7507578
- DOI: 10.15252/embj.2020104494
LRRK2 activation controls the repair of damaged endomembranes in macrophages
Abstract
Cells respond to endolysosome damage by either repairing the damage or targeting damaged endolysosomes for degradation via lysophagy. However, the signals regulating the decision for repair or lysophagy are poorly characterised. Here, we show that the Parkinson's disease (PD)-related kinase LRRK2 is activated in macrophages by pathogen- or sterile-induced endomembrane damage. LRRK2 recruits the Rab GTPase Rab8A to damaged endolysosomes as well as the ESCRT-III component CHMP4B, thereby favouring ESCRT-mediated repair. Conversely, in the absence of LRRK2 and Rab8A, damaged endolysosomes are targeted to lysophagy. These observations are recapitulated in macrophages from PD patients where pathogenic LRRK2 gain-of-function mutations result in the accumulation of endolysosomes which are positive for the membrane damage marker Galectin-3. Altogether, this work indicates that LRRK2 regulates endolysosomal homeostasis by controlling the balance between membrane repair and organelle replacement, uncovering an unexpected function for LRRK2, and providing a new link between membrane damage and PD.
Keywords: LRRK2; Parkinson's disease; endolysosomal damage; lysosomes; tuberculosis.
© 2020 The Authors. Published under the terms of the CC BY 4.0 license.
Conflict of interest statement
The authors declare that they have no conflict of interest.
Figures
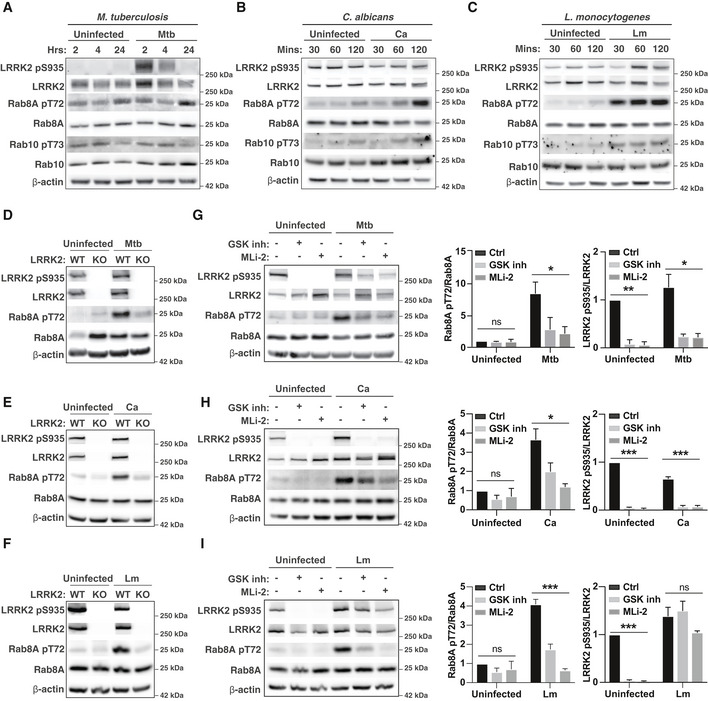
- A–C
RAW264.7 macrophages were left uninfected or infected with (A) Mycobacterium tuberculosis (Mtb), (B) C. albicans (Ca) or (C) L. monocytogenes (Lm) for the indicated time, and Rab8A pT72, Rab10 pT73 and LRRK2 pS935 levels were analysed by Western blot.
- D–F
WT and LRRK2 KO macrophages were left uninfected or infected with (D) Mtb for 24 h, (E) Ca or (F) Lm for 120 min. Rab8A pT72 and LRRK2 pS935 phosphorylation was analysed by Western blot.
- G–I
RAW264.7 macrophages were pre‐treated with 1 μM GSK2578215A (GSK inh) or 0.1 μM MLi‐2 and left uninfected or infected with (G) Mtb for 24 h, (H) Ca or (I) Lm for 120 min. Rab8A pT72 and LRRK2 pS935 phosphorylation was analysed by Western blot and quantified by densitometry. Beta‐actin was used as loading control. Data represent the mean + SEM of three independent biological replicates. One‐way ANOVA followed by Dunnett's test against DMSO control. ns = non‐significant; *P < 0.05; ***P < 0.001
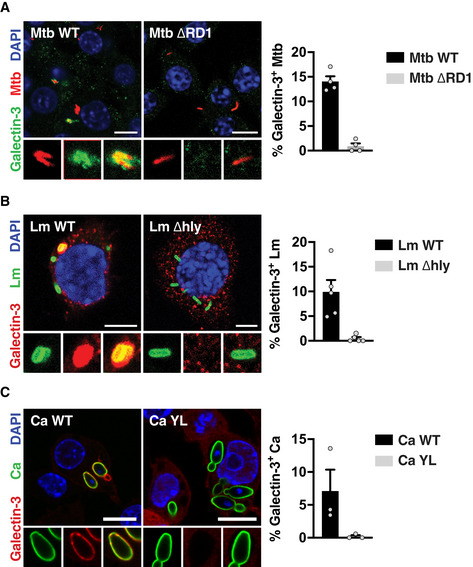
Infection with Mtb WT or Mtb ΔRD1 for 24 h. Scale bar = 10 μm.
Infection with Lm WT or Lm Δhly for 60 min. Scale bar = 5 μm.
Infection with Ca WT or Ca YL for 60 min. Scale bar = 10 μm.
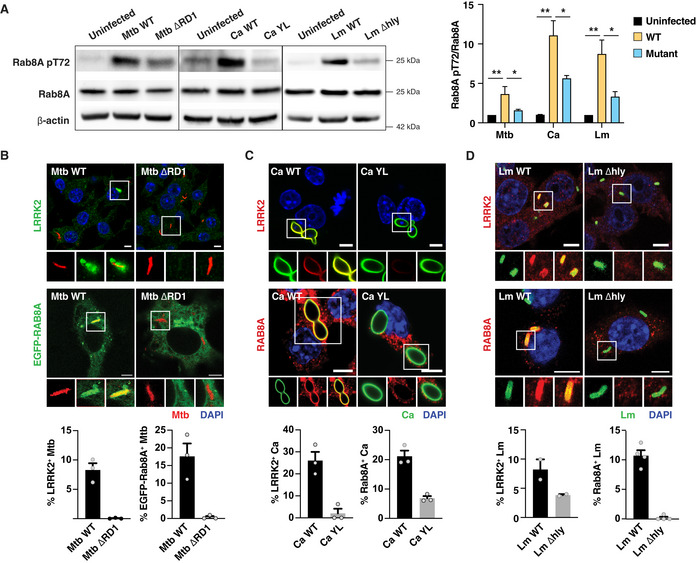
- A–D
RAW264.7 macrophages were infected with Mtb WT or Mtb ΔRD1 for 24 h, Ca WT or Ca YL, and Lm WT or Lm Δhly for 60 min. (A) Levels of Rab8A and Rab8A pT72 phosphorylation were analysed by Western blot and quantified by densitometry. Data represent the mean ± SEM of three independent biological experiments. One‐way ANOVA followed by Dunnett's test compared to WT strains. ns = non‐significant; *P ≤ 0.05; **P ≤ 0.01. (B) Recruitment of endogenous LRRK2 and EGFP‐Rab8A to Mycobacterium tuberculosis (Mtb) was visualised by confocal microscopy. Scale bar = 5 μm. (C, D) Endogenous LRRK2 and Rab8A recruitment to (C) Candida albicans (Ca) and (D) Listeria monocytogenes (Lm) was analysed by confocal microscopy. Scale bar = 5 μm. Bottom panels show quantitative analysis of marker association to the respective pathogen. Data represent the mean ± SEM of two to four independent biological replicates.
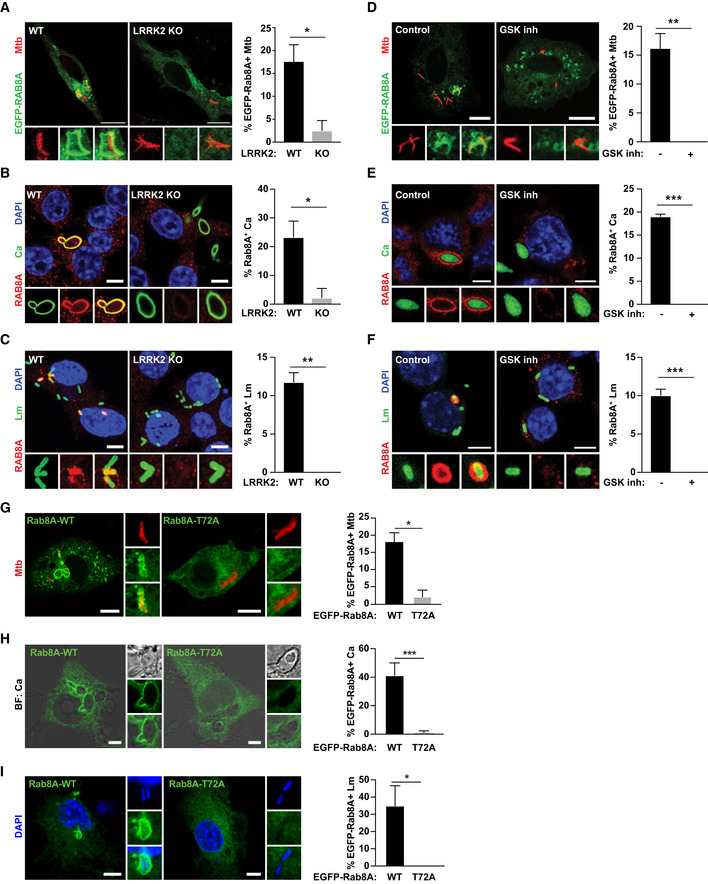
- A
WT and LRRK2 KO macrophages were transfected with EGFP‐Rab8A and infected with Mtb for 24 h. Scale bar = 10 μm.
- B, C
(B) WT and LRRK2 KO macrophages were infected with Ca and (C) Lm for 60 min. Rab8A recruitment was visualised by immunofluorescence. Scale bar = 5 μm.
- D
Macrophages were transfected with EGFP‐Rab8A, treated with 1 μM GSK2578215A (GSK inh) and infected with Mtb for 24 h. Scale bar = 10 μm.
- E, F
(E) Macrophages were treated with the GSK LRRK2 kinase inhibitor (1 μM) and infected with Ca or (F) Lm for 60 min. Rab8A recruitment was visualised by immunofluorescence. Scale bar = 5 μm.
- G–I
Representative images of macrophages transfected with EGFP‐Rab8A‐WT or EGFP‐Rab8A‐T72A and infected with (G) Mtb for 24 h, (H) Ca for 60 min and (I) Lm for 30 min. Scale bar = 5 μm.
- A
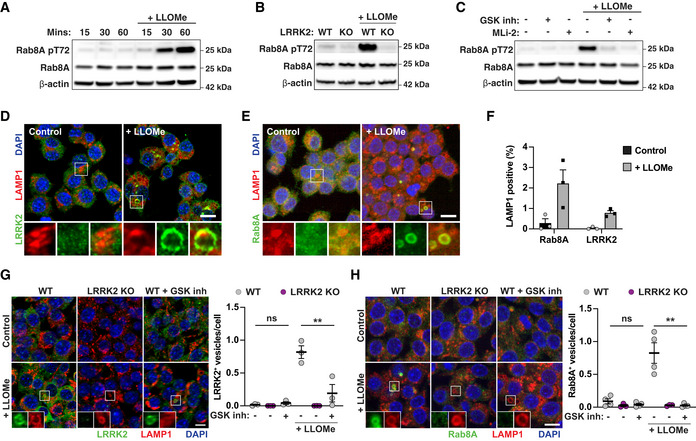
RAW264.7 macrophages were treated with 1 mM LLOMe for the indicated time, and Rab8A and Rab8A pT72 levels were analysed by Western blot.
- B
WT or LRRK2 KO macrophages were treated with 1 mM LLOMe for 30 min, and Rab8A and Rab8A pT72 levels were analysed by Western blot.
- C
Macrophages were pre‐treated with either 1 μM GSK inh or 0.1 μM MLi‐2 and then treated with 1 mM LLOMe for 30 min. Rab8A and Rab8A pT72 levels were analysed by Western blot.
- D–F
RAW264.7 macrophages were treated with 1 mM LLOMe for 30 min. (D) Endogenous LRRK2 and (E) Rab8A recruitment to LAMP‐1‐positive compartments was visualised by immunofluorescence. Scale bar = 10 μm. (F) Quantification of (D, E). Data represent the mean ± SEM of three independent biological experiments.
- G, H
LRRK2 WT or LRRK2 KO macrophages were pre‐treated or not with 1 μM GSK2578215A and treated with 1 mM LLOMe for 30 min. The number of (G) LRRK2‐ or (I) Rab8A‐positive vesicles per cell was monitored by immunofluorescence and high‐content imaging. Scale bar = 10 μm. Data represent the mean ± SEM of three to four independent biological experiments. One‐way ANOVA followed by Dunnett's test against the untreated WT control. ns = non‐significant; **P ≤ 0.01.
- A
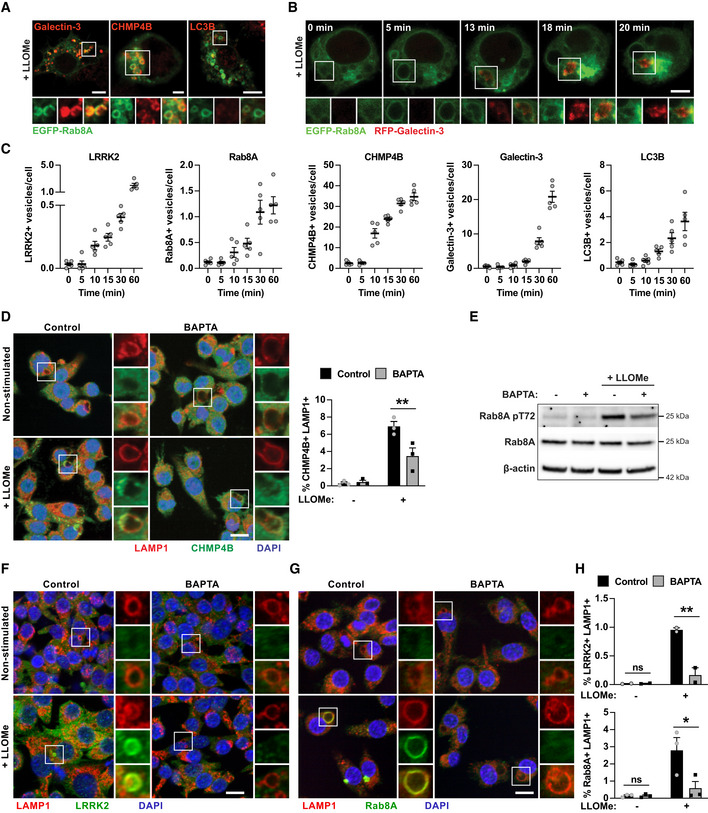
RAW264.7 macrophages were electroporated with EGFP‐Rab8A and treated with 1 mM LLOMe for 30 min. Intracellular distribution of Galectin‐3, CHMP4B or LC3B was visualised by immunofluorescence. Scale bar = 5 μm.
- B
Macrophages were electroporated with EGFP‐Rab8A and RFP‐Galectin‐3. Cells were then treated with 1 mM of LLOMe and monitored by live cell imaging. Snapshots at the indicated time points after LLOMe addition are shown. Scale bar = 5 μm.
- C
RAW264.7 macrophages were treated with 1 mM of LLOMe, and LRRK2, Rab8A, CHMP4B, Galectin‐3 and LC3B foci over time were analysed by high‐content imaging. Data show the mean ± SEM of five biological replicates.
- D–H
RAW264.7 macrophages were pre‐treated with 10 μM BAPTA‐AM for 1 h, and treated with 1 mM LLOMe for 30 min. (D) CHMP4B recruitment was monitored by immunofluorescence and high‐content imaging. Scale bar = 10 μm. (E) Rab8A pT72 phosphorylation was analysed by Western blot. (F) LRRK2 and (G) Rab8A recruitment was monitored by immunofluorescence and high‐content imaging. Scale bar = 10 μm. (H) Quantification of E and F. (D and H) Data represent the mean ± SEM of two to three independent biological experiments. One‐way ANOVA followed by Sidak's multiple comparisons test. ns = non‐significant; **P ≤ 0.01, *P ≤ 0.05.
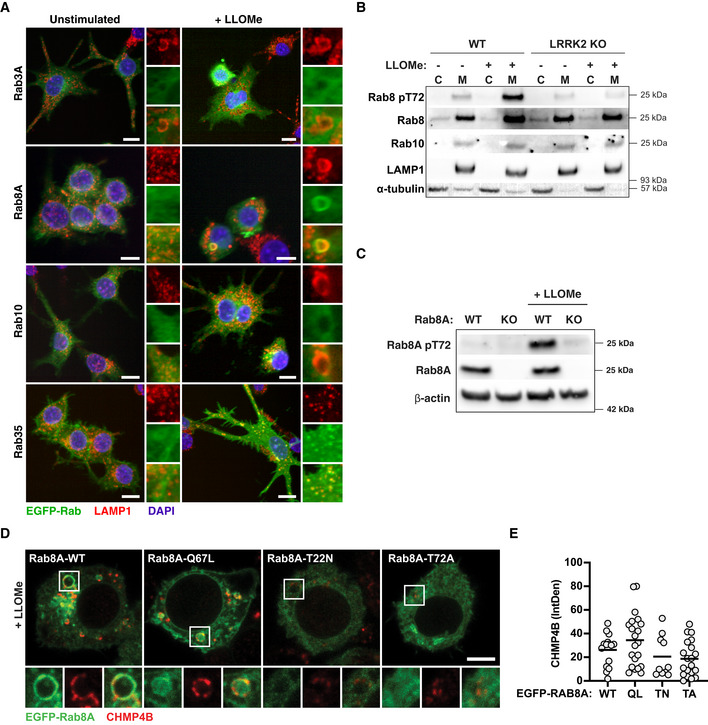
RAW264.7 macrophages were electroporated with EGFP‐Rab3A, EGFP‐Rab8A, EGFP‐Rab10 and EGFP‐Rab35. Cells were treated with 1 mM of LLOMe for 30 min, and Rab recruitment to LAMP1 + compartments was monitored by high‐content immunofluorescence imaging. Scale bar = 10 μm.
WT and LRRK2 KO RAW264.7 macrophages were treated with 1 mM LLOMe for 30 min. Cells were separated into cytosolic (C) and membrane (M) fractions and analysed for Rab8A pT72, Rab8A and Rab10 by Western blot.
WT and Rab8A KO RAW264.7 macrophages were treated with 1 mM LLOMe for 30 min, and Rab8A and Rab8A pT72 levels were analysed by Western blot.
RAW264.7 macrophages were electroporated with EGFP‐Rab8A‐WT, EGFP‐Rab8A‐Q67L, EGFP‐Rab8A‐T22N and EGFP‐Rab8A‐T72A. Cells were treated with 1 mM of LLOMe for 30 min, and CHMP4B recruitment was assessed by confocal microscopy. Scale bar = 5 μm.
CHMP4B integrated fluorescence density was analysed per cell. Data show values from single cells and mean.
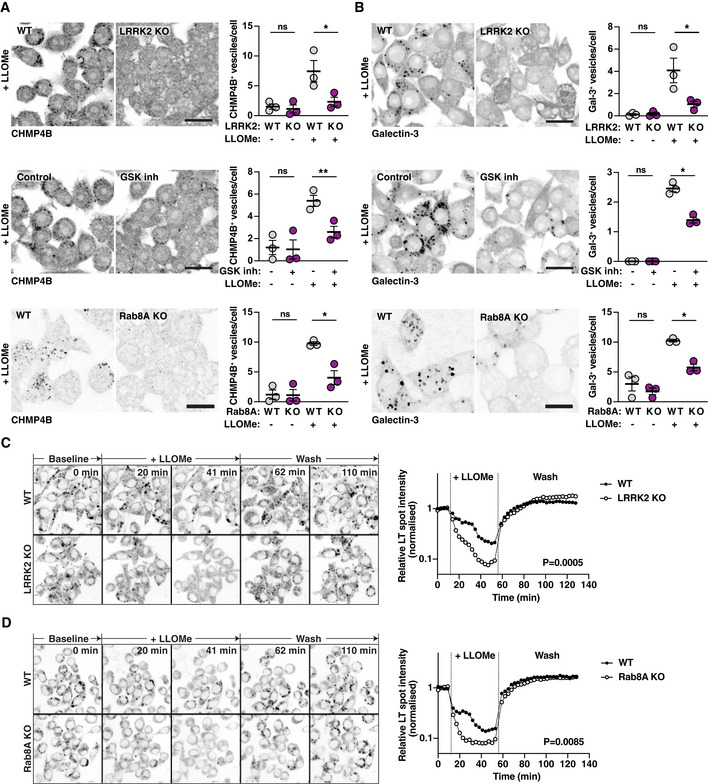
- A, B
RAW264.7 WT, LRRK2 KO or Rab8A macrophages pre‐treated with 1 μM GSK2578215A (GSK inh) were treated with 1 mM LLOMe for 30 min. (A) CHMP4B and (B) Galectin‐3 vesicle numbers were analysed by immunofluorescence and high‐content imaging. Scale bar = 20 μm. Right panels show the quantification of number of CHMP4B‐ or Galectin‐3‐positive vesicles per cell. Mean ± SEM of three independent biological experiments. ns = non‐significant, *P ≤ 0.05, **P ≤ 0.01 by one‐way ANOVA followed by Sidak's multiple comparisons test.
- C, D
Live cell imaging of LysoTracker‐positive spots in WT, LRRK2 KO or Rab8A KO macrophages treated with 1 mM LLOMe, followed by lysosomal recovery after LLOMe wash‐out. One representative experiment out of three shown. Differences between slopes in the LLOMe treatment window were estimated using linear regression.
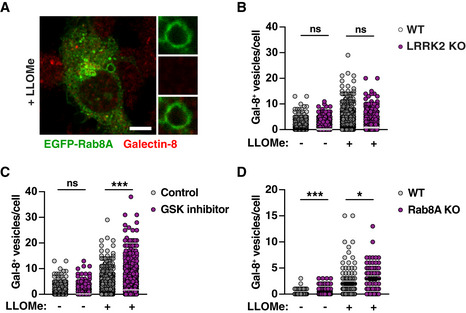
RAW264.7 cells were transfected with EGFP‐Rab8A and treated with 1 mM LLOMe for 30 min. Co‐localisation with Galectin‐8 was visualised by immunofluorescence. Scale bar = 5 μm.
RAW264.7 WT and LRRK2 KO macrophages were treated with 1 mM LLOMe for 30 min. Galectin‐8 vesicle numbers were analysed by immunofluorescence and high‐content imaging.
RAW264.7 macrophages treated or not with 1 μM GSK2578215A (GSK inh) were treated with 1 mM LLOMe for 30 min. Galectin‐8 vesicle numbers were analysed by immunofluorescence and high‐content imaging.
RAW264.7 WT or Rab8A KO macrophages were treated with 1 mM LLOMe for 30 min. Galectin‐8 vesicle numbers were analysed by immunofluorescence and high‐content imaging.
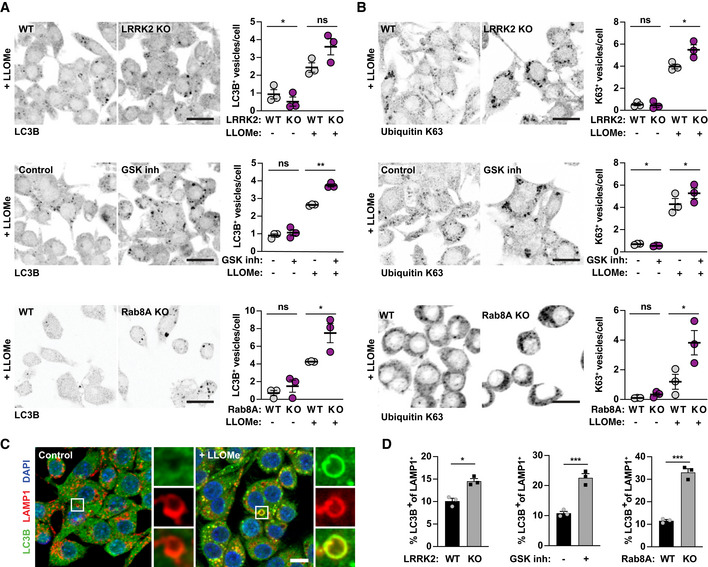
- A, B
WT or LRRK2 KO RAW264.7 macrophages, RAW264.7 macrophages pre‐treated with 1 μM GSK2578215A (GSK inh) and WT or Rab8A KO RAW264.7 macrophages were treated with 1 mM LLOMe for 30 min. (A) LC3B and (B) ubiquitin K63‐positive vesicle numbers were analysed by immunofluorescence and high‐content imaging. Scale bar = 20 μm. Right panels show quantification of number of positive vesicles per cell. Data show the mean ± SEM of three to four biological replicates. ns = non‐significant, *P ≤ 0.05, **P ≤ 0.01 by one‐way ANOVA followed by Sidak's multiple comparisons test.
- C
Representative images of LC3B/LAMP‐1 double‐positive endolysosomes in control and LLOMe‐treated macrophages. Scale bar = 10 μm.
- D
Analysis of the % of LC3B/LAMP‐1 double‐positive endolysosomes in LLOMe‐treated macrophages. Data show mean ± SEM of three independent biological experiments. *P ≤ 0.05, ***P ≤ 0.001 by Student's t‐test.
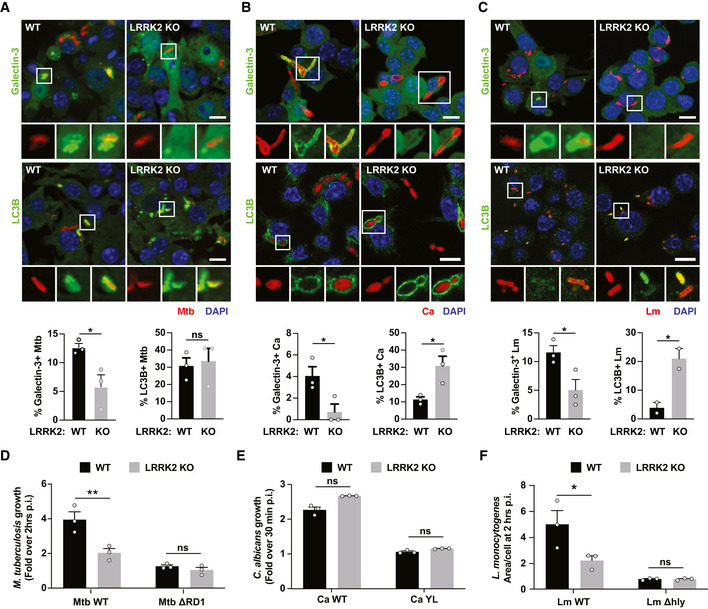
- A–C
WT and LRRK2 KO RAW264.7 macrophages were infected with (A) Mtb for 24 h, (B) Ca for 60 min and (C) Lm for 60 min. Galectin‐3 and LC3B recruitment was analysed by immunofluorescence and high‐content imaging. Scale bar = 10 μm. Data show the mean ± SEM of two to three experiments. ns = non‐significant, *P ≤ 0.05 by Student's t‐test.
- D–F
WT and LRRK2 KO RAW264.7 macrophages were infected with (D) Mtb WT or Mtb ΔRD1, (E) Ca WT or Ca YL and (F) Lm WT or Lm Δhly. Growth measured for (D) 72 h and (E, F) 2 h. Data show the mean ± SEM of three independent biological experiments. ns = non‐significant, *P ≤ 0.05, **P ≤ 0.01 by one‐way ANOVA followed by Sidak's multiple comparisons test.
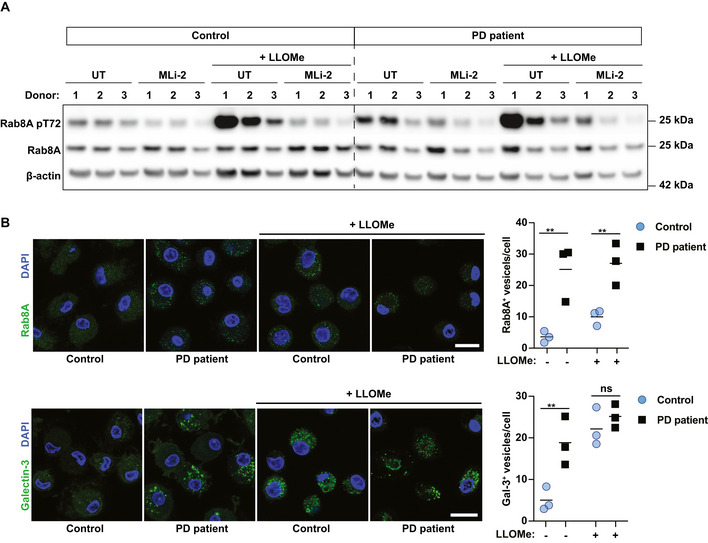
Rab8A and Rab8A pT72 levels were analysed by Western blot.
Rab8A‐ and Galectin‐3‐positive vesicle numbers were analysed by immunofluorescence. Data show the mean ± SEM of biological replicates. Scale bar = 20 μm. ns = non‐significant, **P ≤ 0.01, by one‐way ANOVA followed by Sidak's multiple comparisons test.
Comment in
-
LRRK2 to the rescue of damaged endomembranes.EMBO J. 2020 Sep 15;39(18):e106162. doi: 10.15252/embj.2020106162. Epub 2020 Aug 16. EMBO J. 2020. PMID: 32803793 Free PMC article.
References
-
- Blauwendraat C, Faghri F, Pihlstrom L, Geiger JT, Elbaz A, Lesage S, Corvol JC, May P, Nicolas A, Abramzon Y et al (2017) NeuroChip, an updated version of the neurox genotyping platform to rapidly screen for variants associated with neurological diseases. Neurobiol Aging 57: 247.e9‐247.e13 - PMC - PubMed
-
- Ferreira M, Massano J (2017) An updated review of Parkinson's disease genetics and clinicopathological correlations. Acta Neurol Scand 135: 273–284 - PubMed
Publication types
MeSH terms
Substances
Grants and funding
LinkOut - more resources
Full Text Sources
Other Literature Sources
Molecular Biology Databases
Research Materials
