. 2020 Jul 9:9:e53945.
doi: 10.7554/eLife.53945.

Different dendritic domains of the GnRH neuron underlie the pulse and surge modes of GnRH secretion in female mice

Affiliations

Different dendritic domains of the GnRH neuron underlie the pulse and surge modes of GnRH secretion in female mice

Li Wang et al. Elife. .

Abstract

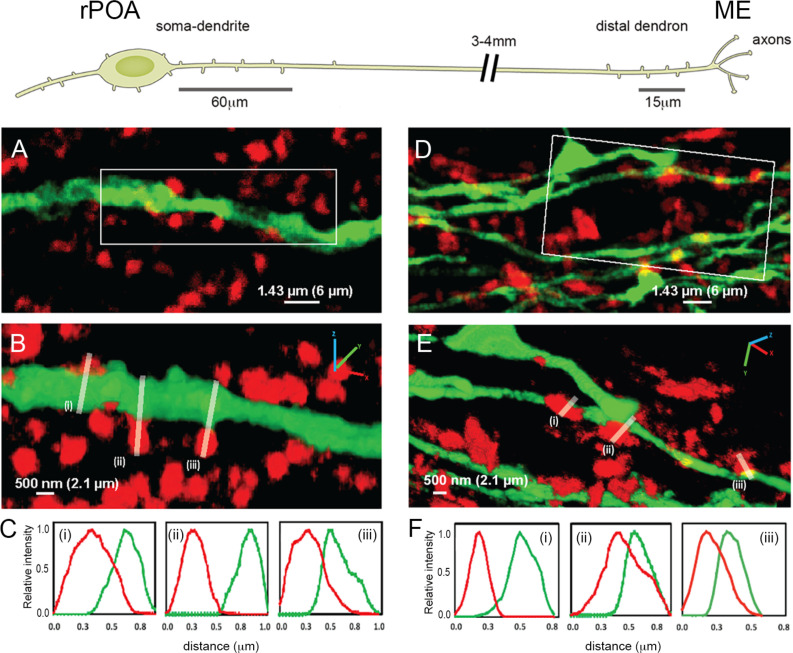
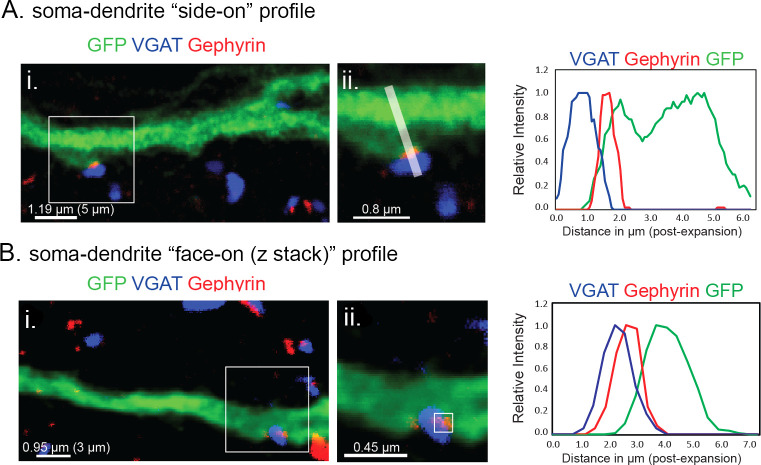
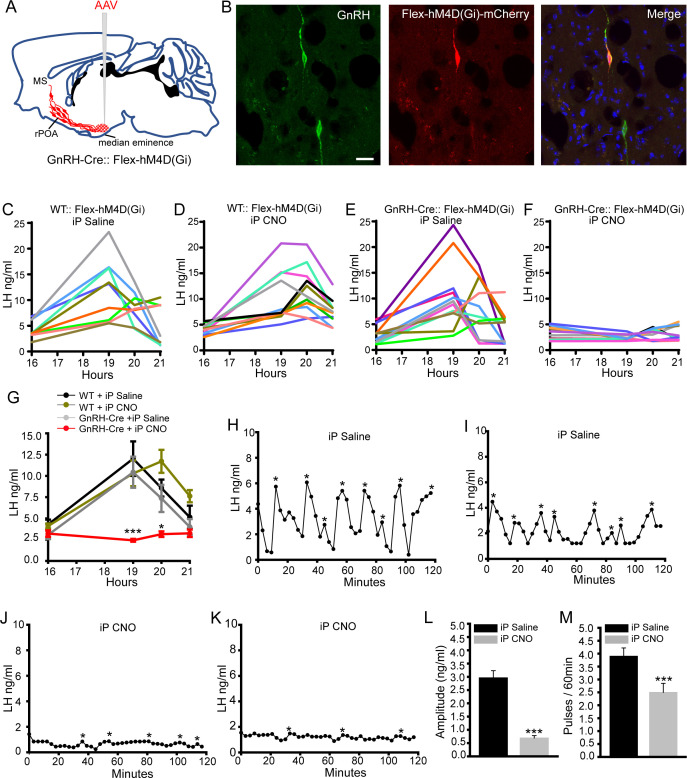
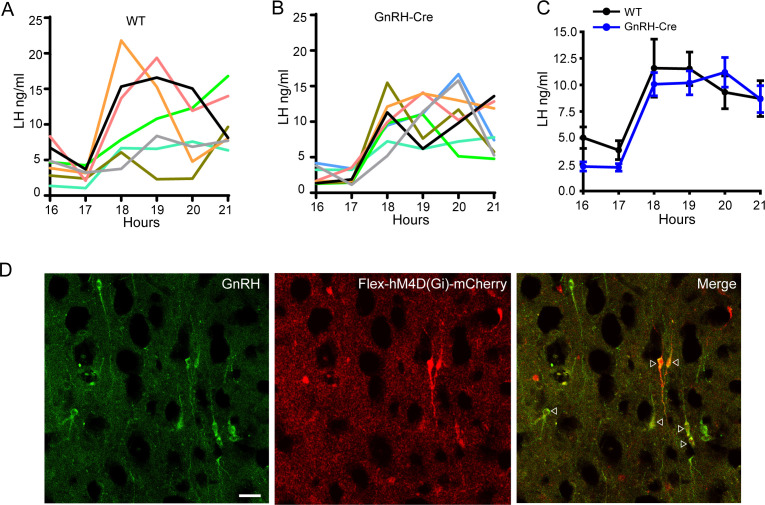
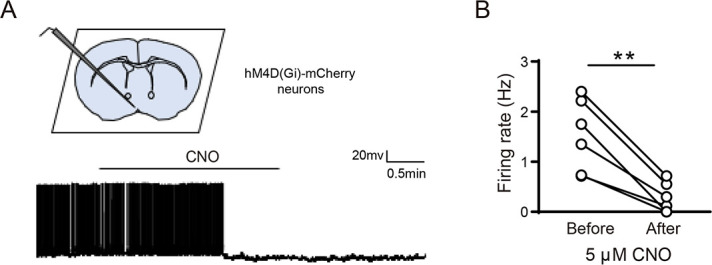
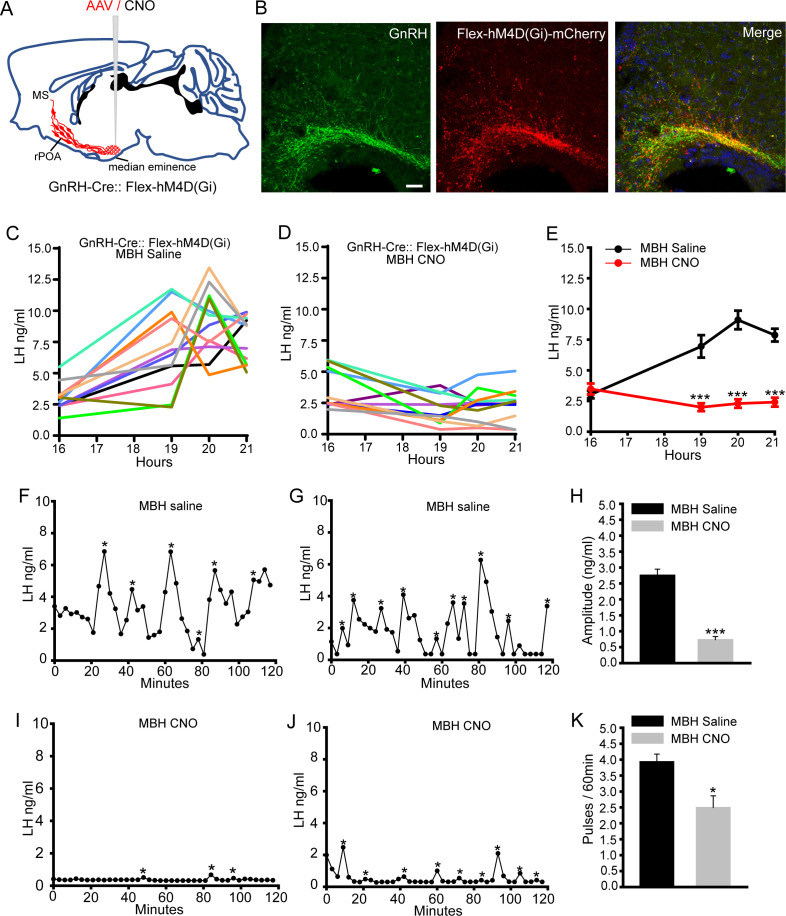
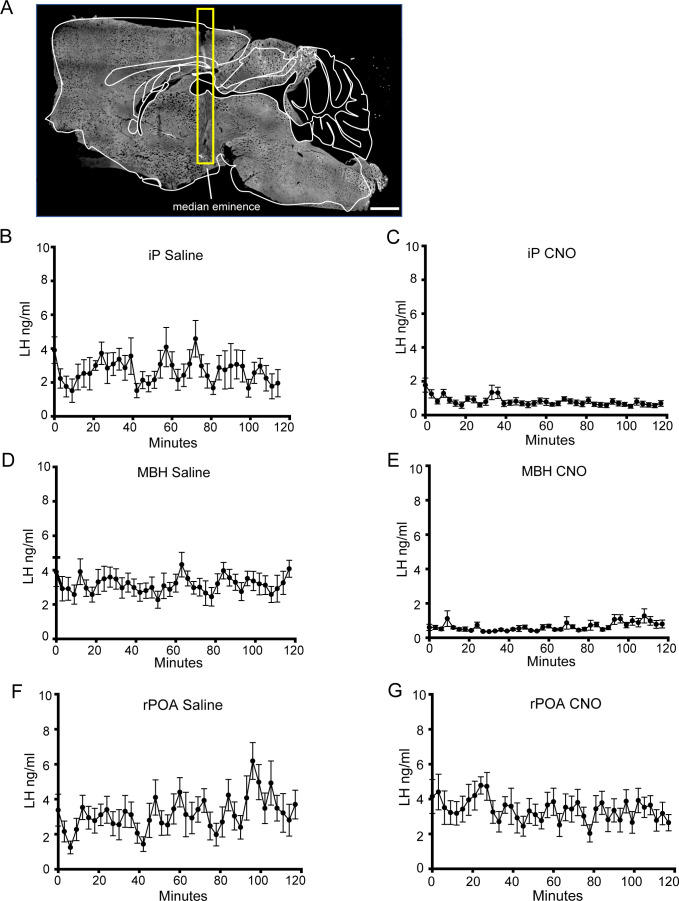
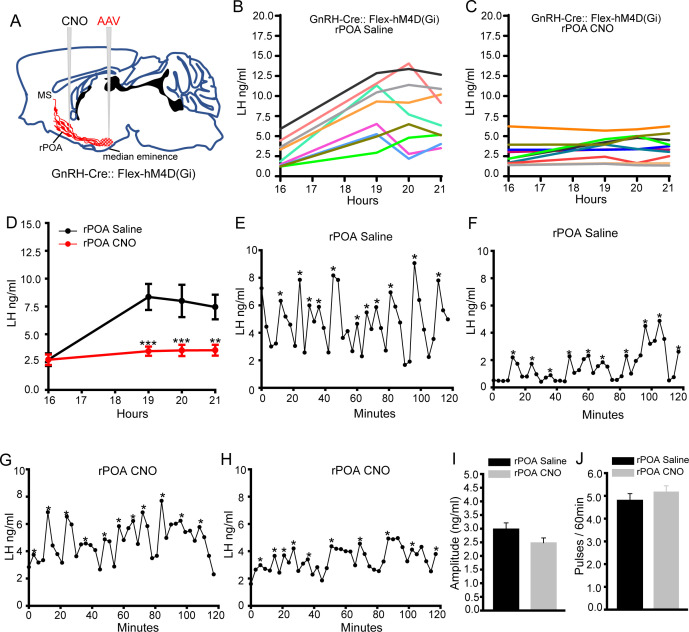
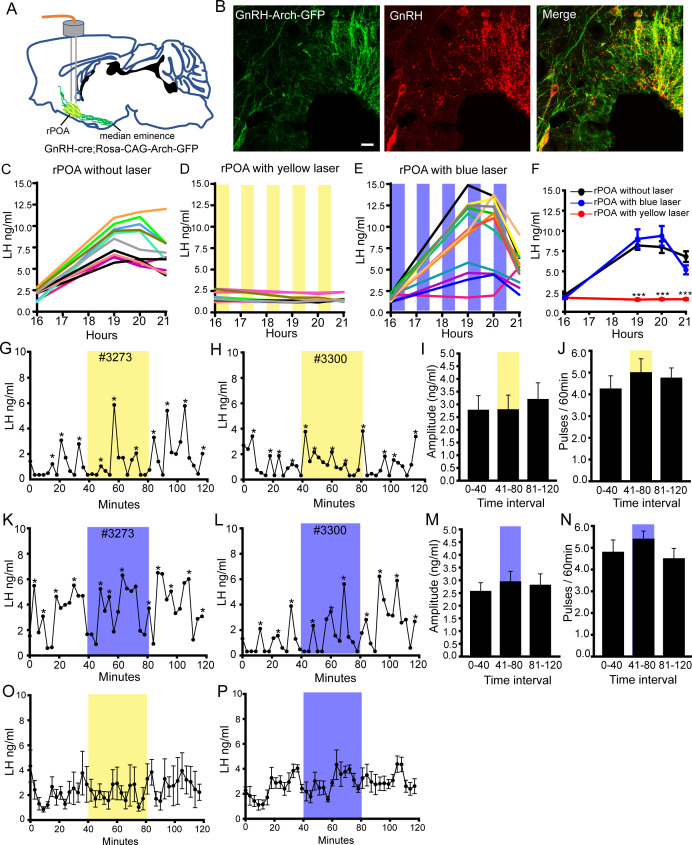
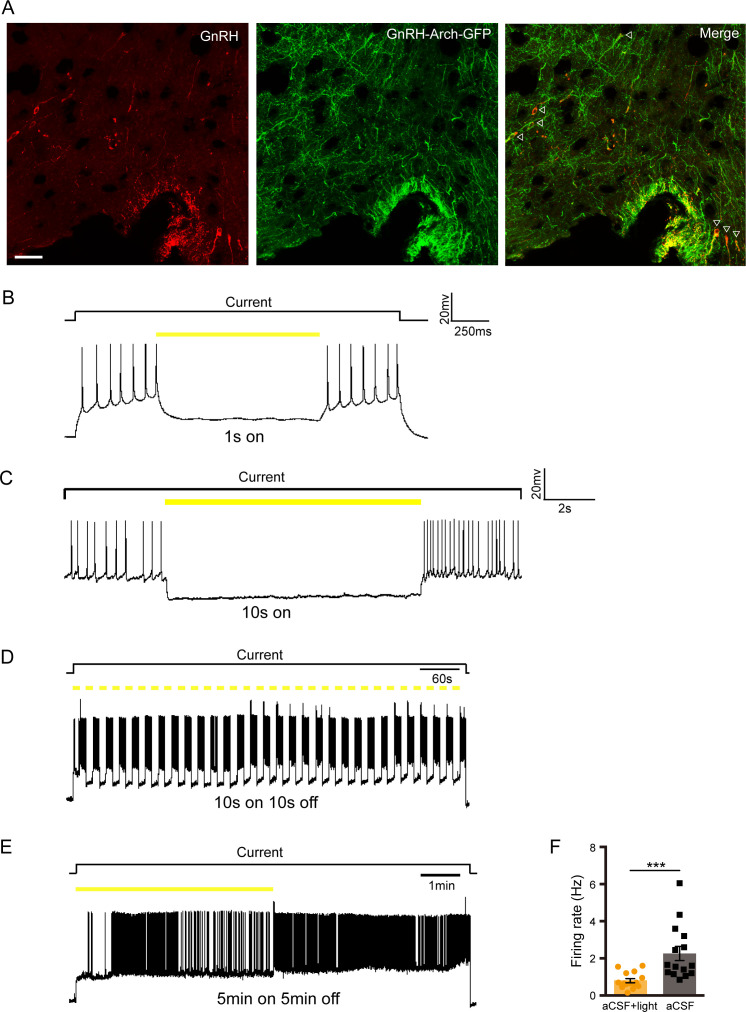
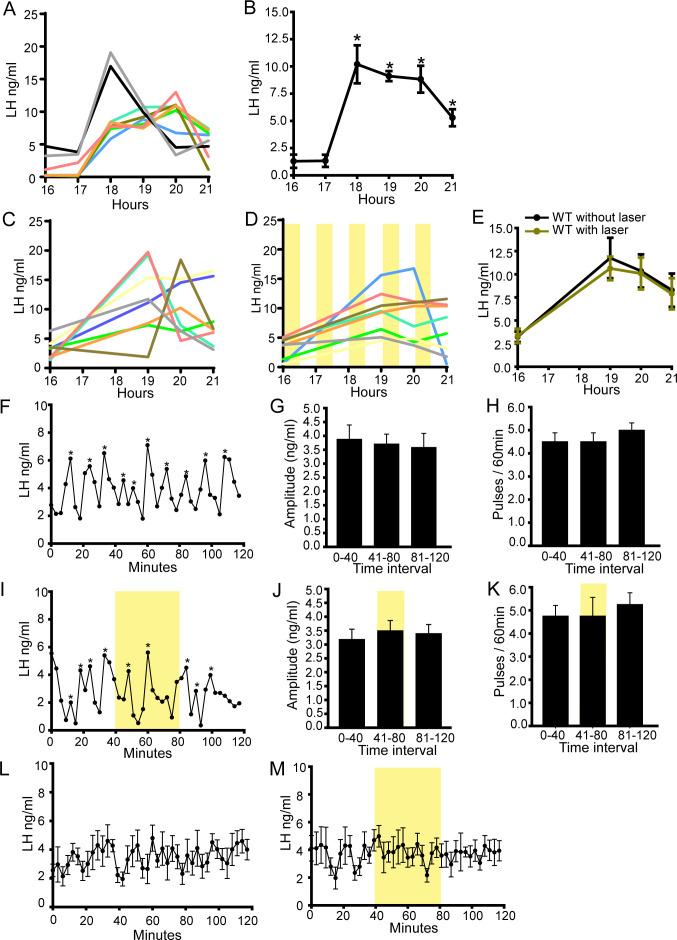
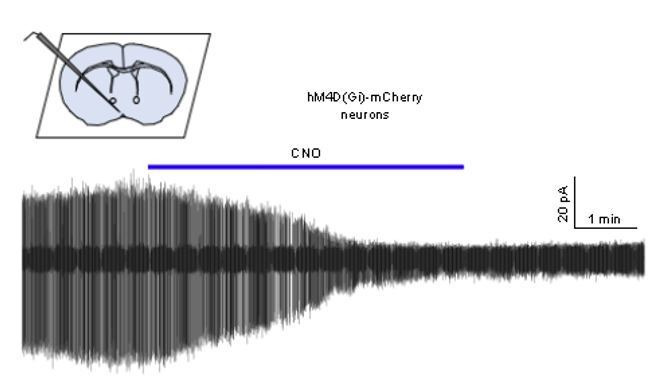
The gonadotropin-releasing hormone (GnRH) neurons exhibit pulse and surge modes of activity to control fertility. They also exhibit an unusual bipolar morphology comprised of a classical soma-proximal dendritic zone and an elongated secretory process that can operate as both a dendrite and an axon, termed a 'dendron'. We show using expansion microscopy that the highest density of synaptic inputs to a GnRH neuron exists at its distal dendron. In vivo, selective chemogenetic inhibition of the GnRH neuron distal dendron abolishes the luteinizing hormone (LH) surge and markedly dampens LH pulses. In contrast, inhibitory chemogenetic and optogenetic strategies targeting the GnRH neuron soma-proximal dendritic zone abolish the LH surge but have no effect upon LH pulsatility. These observations indicate that electrical activity at the soma-proximal dendrites of the GnRH neuron is only essential for the LH surge while the distal dendron represents an autonomous zone where synaptic integration drives pulsatile GnRH secretion.

Keywords: GnRH; hypothalamus; luteinizing hormone; mouse; neuroscience.


Conflict of interest statement

LW, WG, XS, SY, HL, ZW, QL, AH, YK No competing interests declared

Figures

Figure 1.
Figure 1.. Expansion microscopy views of synaptic appositions at the GnRH neuron proximal dendrite and distal dendron.
Schematic showing the morphology of a hypophysiotropic GnRH neuron with its soma-proximal dendrites located in the rostral preoptic area (rPOA) and the distal dendron and short axon branches in the median eminence (ME). Synaptic density analysis was undertaken on 60 μm-lengths of proximal dendrite and 15 μm-lengths of distal dendron. (A) Expansion microscopy view of a proximal dendrite (green) with surrounding synaptophysin puncta (red). (B) shows rotated 3D reconstruction with white lines indicating three appositions that were examined. (C) The side-on relative fluorescence intensity profiles are shown for the three appositions. (i) and (iii) represent synaptic appositions whereas (ii) indicates apposing profiles with no overlap that do not represent a synapse. (D) Expansion microscopy view of distal dendrons (green) with surrounding red synaptophysin puncta. (E) shows rotated 3D reconstruction with white lines indicating three appositions that were examined. (F) The relative fluorescence intensity profiles are shown for the three appositions. (ii) and (iii) represent synaptic appositions, whereas (i) indicates apposing profiles with no overlap that do not represent a synapse. Scale bars show pre-expansion values with expanded size in brackets. X-axis plots show pre- expansion values.
Figure 1—figure supplement 1.
Figure 1—figure supplement 1.. Definition of GABAA receptor synapses on GnRH neurons using ExM.
(A) Example of a ‘side-on’ view of a GABAergic synapse on a GnRH proximal dendrite. Insert, magnified image from boxed region showing the plane of analysis used to generate the fluorescence intensity profiles of each channel - GFP (GnRH proximal dendrites; green), Alexa568 (gephyrin; red) and ATTO647 (VGAT, blue). Analysis of intensity profiles from 25 ‘side-on’ synapses demonstrated that the overlap in signals between the pre-synaptic marker and GnRH neuron was always >0.95 µm (0.23 µm pre-expansion). (B) Example of a ‘face-on’ view of a GABAergic synapse on a GnRH proximal dendrite. Insert, magnified image from boxed region showing the z-plane of analysis used to generate the fluorescence intensity profiles of each channel - GFP (GnRH proximal dendrites; green), Alexa568 (gephyrin; red) and ATTO647 (VGAT, blue). Analysis of intensity profiles from 12 ‘face-on’ synapses demonstrated that the z-axis overlap in signals between the pre-synaptic marker VGAT and GFP of the GnRH neuron was >1.75 µm (0.42 µm pre-expansion) for all synapses.
Figure 2.
Figure 2.. Chemogenetic inhibition of GnRH neurons by intraperitoneal (iP) injection of CNO suppresses both the surge and pulse profiles of LH secretion.
(A) Schematic showing experimental protocol with GnRH-Cre mice injected with Cre-dependent Flex-hM4D(Gi)-mCherry AAVs bilaterally into the region of the median eminence and CNO given by IP injection. MS, medial septum. CNO, Clozapine N-oxide. (B) Fluorescence images of GnRH neurons expressing GnRH (green) and mCherry (red) in GnRH::Flex-hM4D(Gi)-mCherry mice. Scale bar, 20 μm. (C,D) LH profiles for all of the wild-type (WT) OVX+E+P mice given saline control (C, n = 9) or CNO (D, n = 11). (E,F) LH profiles for all of the GnRH-Cre OVX+E+P mice given saline control (E, n = 12) or CNO (F, n = 11). (G) Mean (± SEM) LH levels for the four experimental groups. *p<0.05, ***p<0.001, two-way repeated measures ANOVA with Holm-Sidak test. (H-M) Representative examples of pulsatile LH secretion in OVX GnRH-Cre mice given IP saline (H,I) or CNO (J,K). LH pulses are indicated by asterisks. (L,M) Mean (± SEM) amplitude and frequency of LH pulses in saline (n = 6) and CNO (n = 6). ***p<0.001 Mann-Whitney U-tests.
Figure 2—figure supplement 1.
Figure 2—figure supplement 1.. LH surge profiles of wild-type and un-injected GnRH-Cre mice and expression of hM4D(Gi)-mCherry in GnRH neurons.
LH surge profiles in all individual wild-type (A, n = 7) and GnRH-cre (B, n = 8) OVX+E+P female mice over 6 hr, with tail-tip blood sampling every hour. (C) Mean (± SEM) LH levels in wild-type and GnRH-Cre OVX+E+P female mice with tail-tip blood sampling every hour. Lights off is at 18:00 for all experiments. (D) Photomicrographs showing GnRH immunoreactivity (green), mCherry (red), and overlay in GnRH-Cre mice bilaterally injected with Cre-dependent Flex-hM4D(Gi)-mCherry AAVs into the region of the median eminence. White triangles indicate GnRH neurons expressing mCherry. Scale bar, 50 μm.
Figure 2—figure supplement 2.
Figure 2—figure supplement 2.. Inhibition of GnRH neurons expressing hM4D(Gi) by CNO.
(A) Schematic of the acute brain slice and representative cell-attached recording showing the effect of 5 mM clozapine-N-oxide (CNO) on the firing rate of a GnRH neuron expressing hM4D(Gi)-mCherry. (B) Mean firing rate of six GnRH neurons (from 3 mice) before and after applying 5 mM CNO. ** p<0.01, paired t-test.
Figure 3.
Figure 3.. Chemogenetic inhibition of GnRH neuron distal dendron activity suppresses both the surge and pulse profiles of LH secretion.
(A) Schematic showing experimental protocol with GnRH-Cre mice injected with Cre-dependent Flex-hM4D(Gi)-mCherry AAVs bilaterally into the region of the median eminence and CNO given into the same region. MS, medial septum. CNO, Clozapine N-oxide. (B) Fluorescence images of GnRH neuron projections in the vicinity of the median eminence expressing GnRH (green) and mCherry (red) in GnRH::Flex-hM4D(Gi)-mCherry mice. Scale bar, 20 μm. (C,D) LH surge profiles in all GnRH-Cre OVX+E+P female mice following MBH injection of saline (C, n = 12) or CNO (D, n = 12). (E) Mean (± SEM) LH levels. ***p<0.001, two-way repeated measures ANOVA with Holm-Sidak test. F-J. Representative examples of pulsatile LH secretion in OVX GnRH-Cre mice given saline (F,G) or CNO (I,J). LH pulses are indicated by asterisks. Mean (± SEM) amplitude (H) and frequency (K) of LH pulses in saline (n = 8) and CNO (n = 7). ***p<0.001,*p<0.05 Mann-Whitney U-tests.
Figure 3—figure supplement 1.
Figure 3—figure supplement 1.. Photomicrographs showing location of cannula and mean (± SEM) LH levels in GnRH-Cre OVX mice with saline and CNO.
(A) Photomicrograph showing location of cannula implanted into the MBH of GnRH::Flex-hM4D(Gi)-mCherry mice. Scale bar, 100 μm. Mean (± SEM) LH levels in AAV-injected GnRH-Cre OVX mice with IP injection of saline (B, n = 6) or CNO (C, n = 6). Mean (± SEM) LH levels in AAV-injected GnRH-Cre OVX mice with MBH injection of saline (D, n = 8) or CNO (E, n = 7). Mean (± SEM) LH levels in AAV-injected GnRH-Cre OVX mice with rPOA injection of saline (F, n = 8) and CNO (G, n = 9).
Figure 4.
Figure 4.. Chemogenetic inhibition of GnRH neuron soma-proximal dendrite activity suppresses only the LH surge.
(A) Schematic showing experimental protocol in which GnRH-Cre mice are injected with Cre-dependent Flex-hM4D(Gi)-mCherry AAVs bilaterally into the region of the median eminence and, later, CNO injected into the rostral preoptic area (rPOA). MS, medial septum. CNO, Clozapine N-oxide. (B,C) LH surge profiles in all GnRH-Cre OVX+E+P female mice following rPOA injection of saline (C, n = 9) or CNO (D, n = 10). (D) Mean (± SEM) LH levels. **p<0.01, ***p<0.001, two-way repeated measures ANOVA with Holm-Sidak test. (E-H), Representative profiles of LH pulsatile secretion in GnRH-Cre OVX female mice with rPOA injection of saline (E, F) or CNO (G, H). LH pulses are indicated by asterisks. Mean (± SEM) LH pulse amplitude (I) and frequency (J) in GnRH-cre OVX mice with rPOA injection of saline (n = 8) and CNO (n = 9).
Figure 5.
Figure 5.. Bilateral optogenetic inhibition of GnRH neuron soma-proximal dendrite activity suppresses only the LH surge.
(A) Schematic showing experimental protocol with GnRH-cre+/-;Rosa-CAG-Arch-GFP+/+ mice with bilateral optic fiber placement in the rostral preoptic area (rPOA). (B) Fluorescence images of GnRH neurons expressing Archaerhodopsin (GFP reporter) and GnRH (red) in GnRH-cre+/-;Rosa-CAG-Arch3-GFP+/+ mice. Scale bar, 20 μm. (C-E) LH surge profiles in all control GnRH-cre+/-;Rosa-CAG-Arch-GFP+/+ OVX+E+P female mice (C, n = 11) and those given intermittent (yellow shaded areas) bilateral rPOA 593 nm illumination at 10 Hz (D, n = 12) or, as a control, 473 nm (E, n = 12). (F) Mean (± SEM) LH levels. ***p<0.001, two-way repeated measures ANOVA with Holm-Sidak test. (G-N) Representative profiles of pulsatile LH secretion in GnRH-cre+/-;Rosa-CAG-Arch3-GFP+/+ OVX female mice given 40 min (shaded areas) bilateral rPOA illumination at 593 nm (G, H) or, as a control, 473 nm (K, L). LH pulses are indicated by asterisks. Mean (± SEM) LH pulse amplitude and frequency are given for yellow (I,J, n = 7) and blue (M,N, n = 6) light illumination. (O,P) Mean (± SEM) LH levels in GnRH-cre+/-;Rosa-CAG-Arch-GFP+/+ OVX mice with bilateral rPOA laser illumination at 593 nm (O, n = 7) or 473 nm (P, n = 6).
Figure 5—figure supplement 1.
Figure 5—figure supplement 1.. Archaerhodopsin expression in GnRH neurons and effects of yellow light on GnRH neuron firing.
(A) Photomicrographs showing Archaerhodopsin (GFP reporter), GnRH (red), and overlay in the GnRH-cre+/-;Rosa-CAG-Arch3-GFP+/+ mice. Scale bar, 50 µm. Whole cell current clamp recordings of Archaerhodopsin-expressing rPOA GnRH neurons showing their response to 1 s (B) and 10 s (C) yellow-light. (D) Example traces illustrating the response of an rPOA GnRH neuron to a 10-min yellow light stimulation train at 10 s on 10 s off. (E) Example traces illustrating the response of an rPOA GnRH neuron to a 10 min yellow light stimulation at 5 min on 5 min off. (F) The mean firing rate of an rPOA GnRH neuron with or without 5 min continuous yellow light. **p<0.001, repeated measures ANOVA.
Figure 5—figure supplement 2.
Figure 5—figure supplement 2.. LH surge in GnRH-Arch mice and optogenetic control experiments showing effects of yellow light on the LH surge and pulses in wild-type mice.
(A) LH surge profiles in individual GnRH-Cre+/-;Rosa-CAG-Arch-GFP+/+ OVX+E+P female mice over 6 hr, with tail-tip blood sampling every hour. (B) Mean (± SEM) LH surge profile. Values significantly different from basal LH concentrations are indicated by an asterisk (p<0.05, repeated measures ANOVA). (C-D) LH surge profiles without (C, n = 8) or with (D, n = 8) unilateral 593 nm laser illumination in MBH of wild-type OVX+E+P female mice. (E) Mean LH levels. (F-M), Representative profiles of pulsatile LH secretion in wild-type OVX female mice without (F) or with (I, shaded areas) bilateral rPOA illumination at 593 nm for 40 min. LH pulses are indicated by asterisks. Mean (± SEM) LH pulse amplitude and frequency are given without (G,H, n = 6) or with (J,K, n = 6) bilateral rPOA 593 nm laser illumination. (L,M) Mean (± SEM) LH levels in wild-type OVX female mice without (L, n = 6) or with (M, n = 6) bilateral rPOA 593 nm laser illumination.
Author response image 1.
Author response image 1.. Cell-attached recording of a GnRH neuron from an AAV-injected mouse showing the effect of 1 μM CNO on firing.

References

    1. Bock R, Shin JH, Kaplan AR, Dobi A, Markey E, Kramer PF, Gremel CM, Christensen CH, Adrover MF, Alvarez VA. Strengthening the accumbal indirect pathway promotes resilience to compulsive cocaine use. Nature Neuroscience. 2013;16:632–638. doi: 10.1038/nn.3369. - DOI - PMC - PubMed
    1. Campbell RE, Han SK, Herbison AE. Biocytin filling of adult gonadotropin-releasing hormone neurons in situ reveals extensive, spiny, dendritic processes. Endocrinology. 2005;146:1163–1169. doi: 10.1210/en.2004-1369. - DOI - PubMed
    1. Campos P, Herbison AE. Optogenetic activation of GnRH neurons reveals minimal requirements for pulsatile luteinizing hormone secretion. PNAS. 2014;111:18387–18392. doi: 10.1073/pnas.1415226112. - DOI - PMC - PubMed
    1. Chen F, Tillberg PW, Boyden ES. Expansion microscopy. Science. 2015;347:543–548. doi: 10.1126/science.1260088. - DOI - PMC - PubMed
    1. Chozinski TJ, Halpern AR, Okawa H, Kim HJ, Tremel GJ, Wong RO, Vaughan JC. Expansion microscopy with conventional antibodies and fluorescent proteins. Nature Methods. 2016;13:485–488. doi: 10.1038/nmeth.3833. - DOI - PMC - PubMed

Publication types

MeSH terms

Substances