. 2020 Sep 7;219(9):e202001134.
doi: 10.1083/jcb.202001134.

Cancer cells educate natural killer cells to a metastasis-promoting cell state

Affiliations

Cancer cells educate natural killer cells to a metastasis-promoting cell state

Isaac S Chan et al. J Cell Biol. .

Abstract

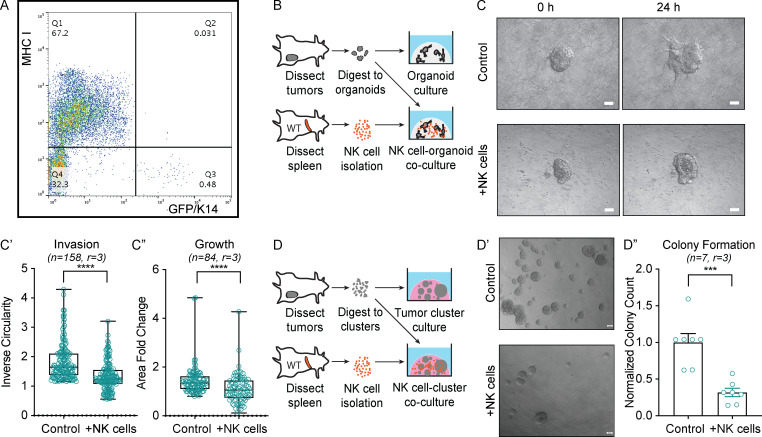
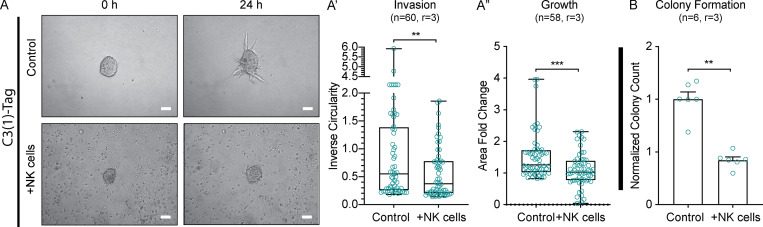
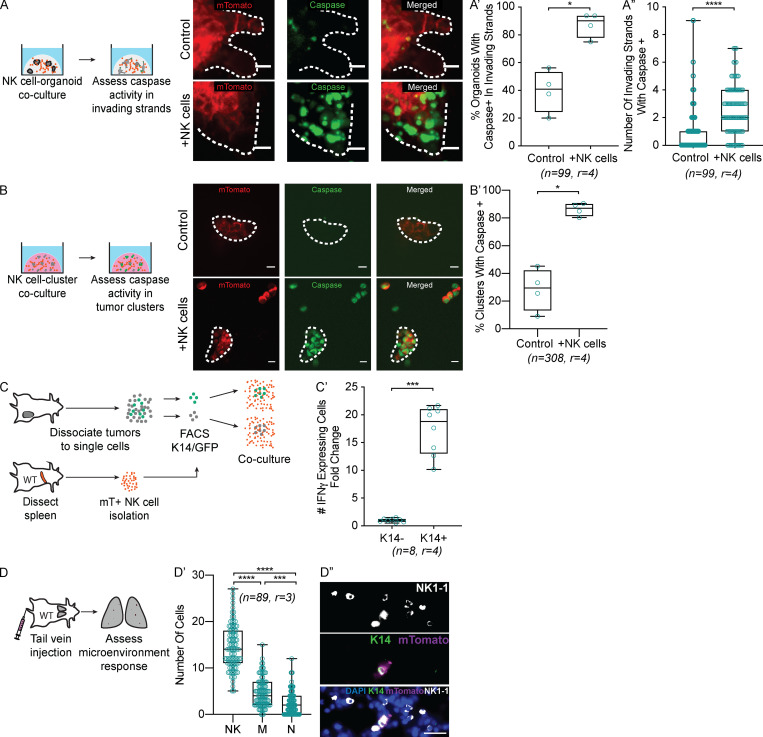
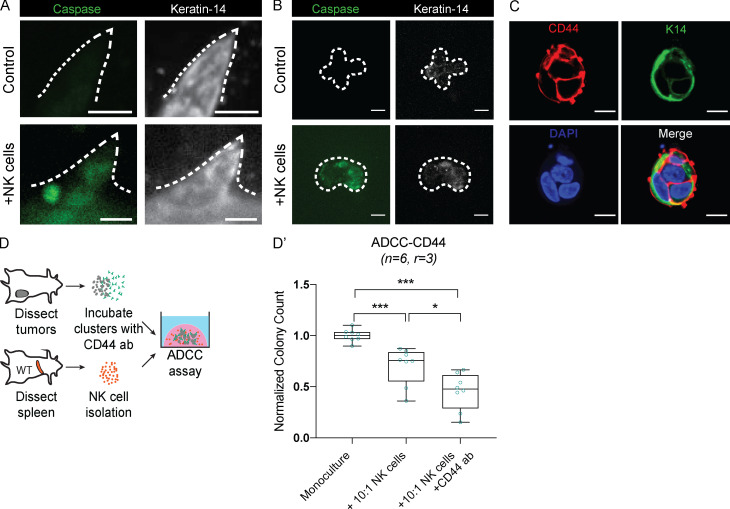
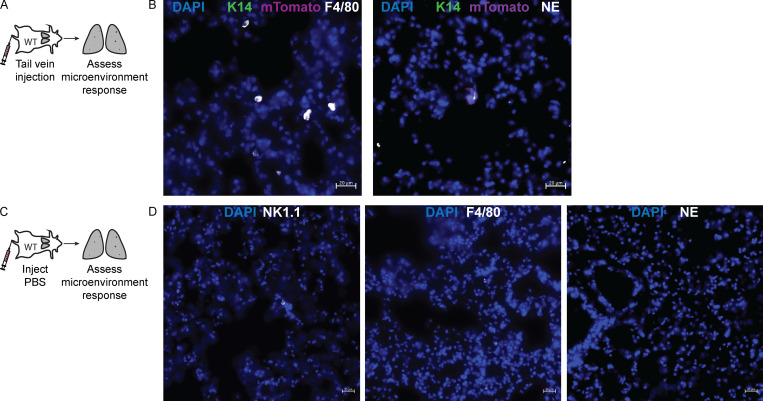
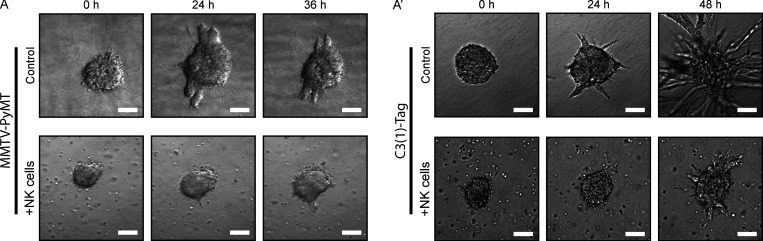
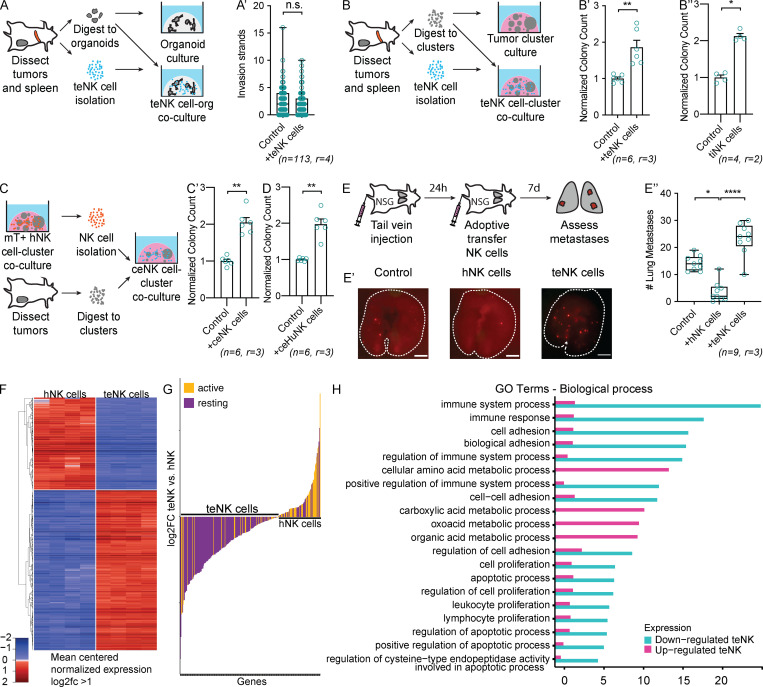
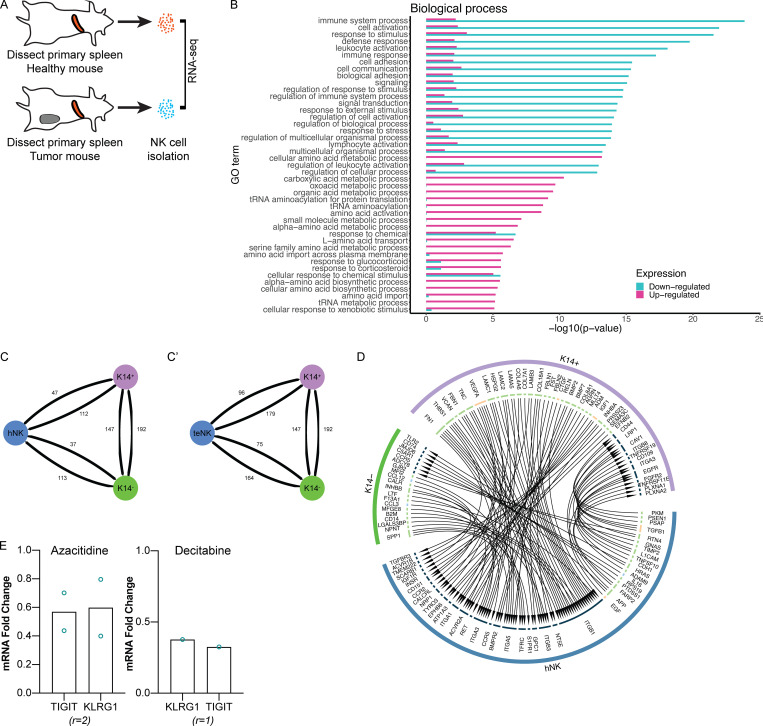
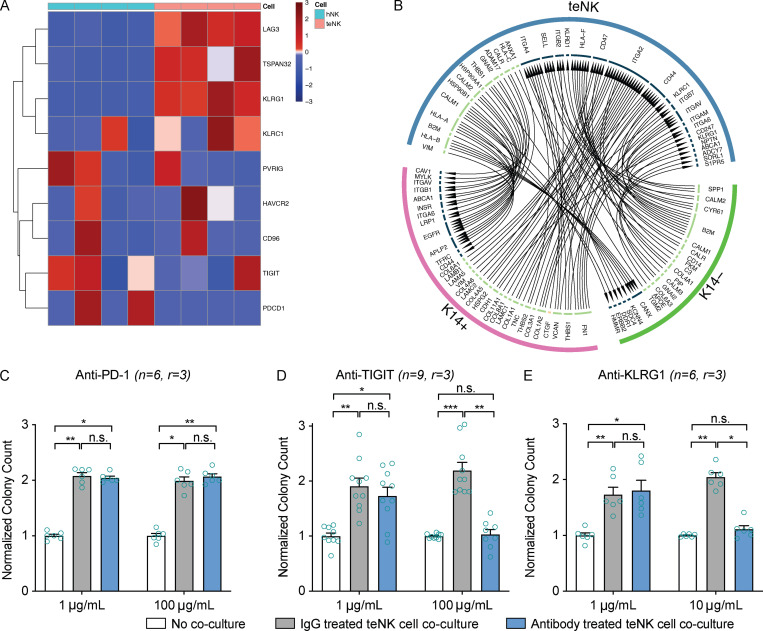
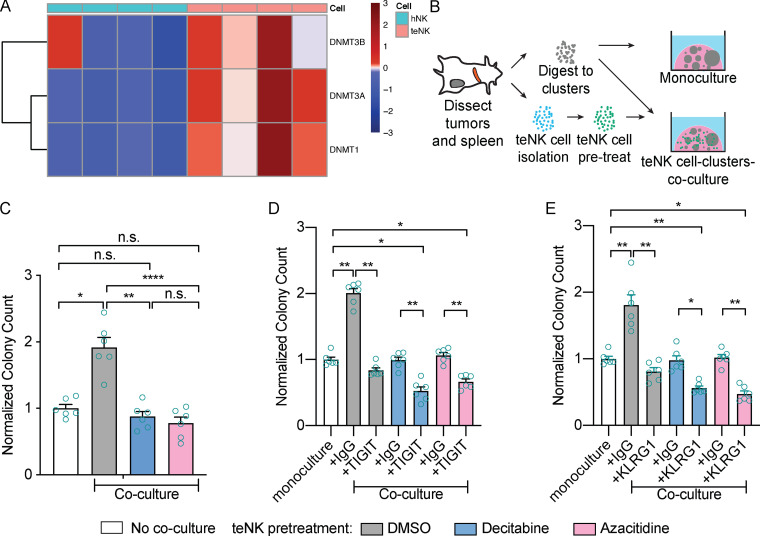
Natural killer (NK) cells have potent antitumor and antimetastatic activity. It is incompletely understood how cancer cells escape NK cell surveillance. Using ex vivo and in vivo models of metastasis, we establish that keratin-14+ breast cancer cells are vulnerable to NK cells. We then discovered that exposure to cancer cells causes NK cells to lose their cytotoxic ability and promote metastatic outgrowth. Gene expression comparisons revealed that healthy NK cells have an active NK cell molecular phenotype, whereas tumor-exposed (teNK) cells resemble resting NK cells. Receptor-ligand analysis between teNK cells and tumor cells revealed multiple potential targets. We next showed that treatment with antibodies targeting TIGIT, antibodies targeting KLRG1, or small-molecule inhibitors of DNA methyltransferases (DMNT) each reduced colony formation. Combinations of DNMT inhibitors with anti-TIGIT or anti-KLRG1 antibodies further reduced metastatic potential. We propose that NK-directed therapies targeting these pathways would be effective in the adjuvant setting to prevent metastatic recurrence.


Figures

Figure 1.
Figure 1.
NK cells limit early stages of metastasis in ex vivo models of breast cancer. (A) Dot plot of GFP+ K14+ and K14 tumor cells stained for MHC class I expression. (B) Schema of hNK cell-tumor organoid coculture. Tumor organoids were isolated from dissected MMTV-PyMT mammary tumors, and hNK cells were isolated from the spleens of FVB/n mice. Tumor organoids were cultured alone or in coculture with hNK cells in collagen I gels. (C) Representative DIC images of MMTV-PyMT tumor organoids alone (top) or in coculture with hNK cells (bottom) at 0 and 24 h. Scale bar, 50 µm. (C′ and C″) Boxplots of inverse circularity (C′) and area fold change (C″) of MMTV-PyMT tumor organoids alone or in coculture with hNK cells. Error bars represent 5th to 95th percentile. ****, P < 0.0001 by Mann–Whitney U test. (D) Schema of hNK cell-tumor cluster coculture. Tumor clusters were isolated from dissected MMTV-PyMT mammary tumors, and hNK cells were isolated from the spleens of WT mice. Tumor clusters were cultured alone or in coculture with hNK cells in Matrigel. (D′) Representative DIC images of MMTV-PyMT tumor colonies alone (top) or in coculture with hNK cells (bottom) at 24 h. Scale bar, 50 µm. (D″) Quantification of normalized colony formation count from MMTV-PyMT tumor clusters cultured alone or in coculture with hNK cells. Colony count was normalized to control. Mean is represented; ***, P < 0.001 by Mann–Whitney U test.
Figure S1.
Figure S1.
hNK cells limit invasion, growth, and colony formation in the C3(1)-Tag mouse model of breast cancer. (A) Representative DIC images of tumor organoids alone (top) or in coculture with hNK cells (bottom) at 0 and 24 h. Scale bar, 50 µm. (A′ and A″) Boxplot of inverse circularity of tumor organoids alone or in coculture with hNK cells (A′) and area fold change of tumor organoids alone or in coculture with hNK cells (A″). Error bars represent 5th to 95th percentile. **, P < 0.01; ***, P < 0.001 by Mann–Whitney U test. (B) Quantification of normalized colony counts from tumor clusters cultured alone or in coculture with hNK cells. **, P < 0.01 by Mann–Whitney U test.
Figure 2.
Figure 2.
hNK cells induce apoptosis in K14+ invasive breast cancer cells. (A) Representative confocal images of the invading strands of tumor organoids (mTomato+) and caspase activity (green) cultured alone (top) or in coculture with hNK cells (bottom). Scale bar, 10 µm. (A′ and A″) Boxplot of the percentage of organoids with caspase activity in invading strands per biological replicate (A′) and the total number of invading strands with caspase activity (A″) cultured alone or in coculture with hNK cells. *, P < 0.05; ****, P < 0.0001 by Mann–Whitney U test. (B) Representative confocal images of tumor clusters organoids (mTomato+) and caspase activity (green) cultured alone (top) or in coculture with hNK cells (bottom). Scale bar, 10 µm. (B′) Boxplot of the percentage of tumor clusters per biological replicate with caspase activity in tumor clusters cultured alone or in coculture with hNK cells. *, P < 0.05 by Mann–Whitney U test. (C) Schema for assessing IFNγ activity in hNK cells in response to coculture with K14+ or K14 tumor cells. hNK cells were taken from ROSAmT/mG mice and in coculture with K14+ or K14 cells from K14-actin-GFP;MMTV-PyMT mice. In this experiment, hNK cells were fluorescently labeled with mTomato and K14+ cells were labeled with GFP. (C′) Boxplot of IFNγ expression among hNK cells after coculture with K14+ and K14 cells and normalized to K14 cells. Error bars represent 5th to 95th percentile. ***, P < 0.001 by Mann–Whitney U test. (D) Schema for assessment of the innate immune response to an initial metastatic seed. Tumor clusters from the mammary tumors of K14-actin-GFP;MMTV-PyMT;ROSAmT/mG mice were injected into the tail veins of immunocompetent mice, and the lung microenvironment was assessed after 6 h. (D′) Boxplot of the number of NK cells, macrophages, and neutrophils around a metastatic seed. Error bars represent 5th to 95th percentile. ***, P < 0.001; ****, P < 0.0001 by Kruskal–Wallis test. (D″) Representative slide scanned images of lung tissue field of view containing a K14+ (green), metastatic seed (magenta), surrounded by NK cells (NK1.1, white). Scale bar, 20 µm.
Figure S2.
Figure S2.
hNK cells induce caspase activity in K14+ invasive cells, and hNK cell cytotoxicity can be increased by using a CD44 antibody specific to K14+ cells. (A and B) Representative confocal images of tumor organoids (A) and tumor clusters (B) stained for caspase activity (green) and K14 (white) among tumor organoids cultured alone (top) or in coculture with hNK cells (bottom). Scale bar, 10 µm. (C) Representative confocal images of staining tumor cell clusters for CD44 and K14. Scale bar, 10 µm. (D) Schema for the ADCC assay. Tumor clusters were isolated from MMTV-PyMT mammary tumors and incubated with a CD44 antibody before being in coculture with hNK cells at a reduced ratio of 10 NK cells to 1 tumor cell. (D′) Boxplot of the normalized colony count. Error bars represent 5th to 95th percentile. ns, not significant; *, P < 0.05; ***, P < 0.001 by Mann–Whitney U test.
Figure S3.
Figure S3.
Quantification of macrophage and neutrophil response to early metastatic seeds in the lungs. (A) Schema for assessment of the innate immune response to an initial metastatic seed. Tumor clusters from the mammary tumors of K14-actin-GFP;MMTV-PyMT;ROSAmT/mG mice were injected into the tail veins of immunocompetent mice, and the lung microenvironment was assessed for macrophages and neutrophils after 6 h. (B) Representative slide scanned images of early metastatic seeds staining for F4/80 (macrophages, white) and neutrophil-elastase (neutrophils, white) around K14+ (green) metastatic seeds (magenta). Scale bar, 20 µm. (C) Schema for the control experiment in which PBS was injected into immunocompetent host mice, and the lung microenvironment was assessed for macrophages and neutrophils after 6 h. (D) Representative slide scanned images of staining for NK1.1 (NK cells, white), F4/80 (macrophages, white), and neutrophil-elastase (neutrophils, white) around tumor clusters. Scale bar, 20 µm.
Figure S4.
Figure S4.
Breast cancer organoids are able to overcome hNK cell cytotoxicity over time in 3D culture. (A and A′) Representative tumor organoids isolated from MMTV-PyMT (A) and C3(1)-Tag (A′) mice placed in 3D collagen I alone (top) or in coculture with hNK cells from FBV/n mice (bottom). Although hNK cells are initially able to limit tumor organoid invasion in both models at 24 h, by 36–48 h, tumor organoids are able to invade despite hNK cell activity. Scale bar, 50 µm.
Figure 3.
Figure 3.
teNK cells promote colony formation. (A) Schema for teNK cell-tumor organoid coculture. (A′) Boxplot of tumor organoid invasion strands of tumor organoids cultured alone or in coculture with teNK cells. Error bars represent 5th to 95th percentile. ns, not significant by Mann–Whitney U test. (B) Schema for teNK cell-tumor cluster coculture. (B′) Normalized colony count of tumor clusters cultured alone or in coculture with teNK cells. Mean with SEM is represented. **, P < 0.01 by Mann–Whitney U test. (B″) Normalized colony count of tumor clusters cultured alone or in coculture with tiNK cells. Mean with SEM is represented. *, P < 0.05 by Mann–Whitney U test. (C) Schema for generating ceNK cells. (C′) Normalized colony count of MMTV-PyMT tumor clusters cultured alone or in coculture with ceNK cells. Mean with SEM is represented. **, P < 0.01 by Mann–Whitney U test. (D) Normalized colony count of MCF-7 cell clusters cultured alone or in coculture with ceHuNK cells. Mean with SEM is represented. **, P < 0.01 by Mann–Whitney U test. (E) Schema of the adoptive transfer of NK cells following a tail vein injection of cancer cells. (E′) Representative whole-lung images. Macrometastases were identified based on their mTomato expression. Scale bar, 4 mm. (E″) Boxplot of the number of lung macrometastases. Error bars represent 5th to 95th percentile. *, P < 0.05; ****, P < 0.0001 by Kruskal–Wallis test. (F) Heat map displaying z-scores for the variance-stabilized transform of gene expression for differentially expressed genes with absolute value of log2(fold change) >1 between hNK cells and teNK cells. Hierarchical clustering was used to order the genes. (G) Waterfall plot of genes associated with an active and resting NK cell phenotype, expressed by teNK cells and hNK cells. (H) Gene ontology enrichment analysis in “biological process” category for differentially expressed genes up- and down-regulated by teNK cells. Four categories with the lowest P value related to the immune system, metabolic processes, apoptosis, and proliferation are displayed.
Figure S5.
Figure S5.
RNA-seq analysis of hNK cells and teNK cells reveals differences in identity and biological processes. Receptor–ligand analysis of hNK cells and K14+ or K14 cells reveals interactions between NK cells and cancer cells. Treatment with DNMT inhibitors alter gene expression of inhibitory receptors. (A) Schema for RNA-seq analysis of hNK cells and teNK cells. (B) Gene ontology enrichment analysis in “biological process” category for genes differentially expressed between hNK and teNK cells. 30 categories with the lowest P value associated with up- or down-regulated teNK cells are displayed. (C and C′) Network representation of total receptor–ligand pairs between hNK cells (C) or teNK cells (C′) and K14+ or K14 cells as identified by the databases included in the iTalk algorithm. (D) Relationship map of receptor–ligand pairs of hNK cells and K14+ or K14 cells as identified by the databases included in the iTalk algorithm. (E) Treatment of teNK cells with azacitidine or decitabine alters gene expression of TIGIT and KLRG1 by qPCR. Because of logistical constraints during the COVID-19 pandemic, the assays were able to be conducted only twice and once, respectively.
Figure 4.
Figure 4.
The teNK cell phenotype can be reversed. (A) Heat map of z-scores of gene expression by hNK cells and teNK cells of genes related to NK cell inhibitory signaling. Hierarchical clustering was used to order the genes. (B) Relationship map of receptor-ligand pairs between teNK cells and K14+ or K14 cells as identified by the iTalk algorithm. (C–E) Normalized colony count from antibody-treated control assays and teNK cell–MMTV-PyMT tumor cluster coculture assays. Mean with SEM is represented. ns, not significant; *, P < 0.05; **, P < 0.01; ***, P < 0.001 by Kruskal–Wallis test.
Figure 5.
Figure 5.
Pretreatment of teNK cells with FDA-approved DNMT inhibitors neutralizes the teNK cell phenotype. (A) Heat map of z-scores of gene expression by hNK cells and teNK cells of genes related to DNMTs. Hierarchical clustering was used to order the genes. (B) Schema of pretreatment of teNK cells before coculture with tumor clusters. (C) Normalized colony count from DMSO control or DNMT inhibitor pretreated teNK cell–MMTV-PyMT tumor cluster coculture assays versus monoculture controls. Mean with SEM is represented. n.s., not significant; *, P < 0.05; **, P < 0.01; ****, P < 0.0001 by Mann–Whitney U test. (D and E) Normalized colony count from DMSO or DNMT inhibitor pretreated teNK cells and antibody treated monoculture control assays and teNK cell–tumor cluster coculture assays. Mean with SEM is represented. *, P < 0.05; **, P < 0.01 by Mann–Whitney U test.

References

    1. Adams S., Gatti-Mays M.E., Kalinsky K., Korde L.A., Sharon E., Amiri-Kordestani L., Bear H., McArthur H.L., Frank E., Perlmutter J., et al. . 2019. Current Landscape of Immunotherapy in Breast Cancer: A Review. JAMA Oncol. 5:1205 10.1001/jamaoncol.2018.7147 - DOI - PMC - PubMed
    1. Anders S., Pyl P.T., and Huber W.. 2015. HTSe—a Python framework to work with high-throughput sequencing data. Bioinformatics. 31:166–169. 10.1093/bioinformatics/btu638 - DOI - PMC - PubMed
    1. Chen Z., Quan L., Huang A., Zhao Q., Yuan Y., Yuan X., Shen Q., Shang J., Ben Y., Qin F.X., et al. . 2018. seq-ImmuCC: Cell-Centric View of Tissue Transcriptome Measuring Cellular Compositions of Immune Microenvironment From Mouse RNA-Seq Data. Front. Immunol. 9:1286 10.3389/fimmu.2018.01286 - DOI - PMC - PubMed
    1. Cherfils-Vicini J., Iltis C., Cervera L., Pisano S., Croce O., Sadouni N., Győrffy B., Collet R., Renault V.M., Rey-Millet M., et al. . 2019. Cancer cells induce immune escape via glycocalyx changes controlled by the telomeric protein TRF2. EMBO J. 38 e100012 10.15252/embj.2018100012 - DOI - PMC - PubMed
    1. Cheung K.J., and Ewald A.J.. 2016. A collective route to metastasis: Seeding by tumor cell clusters. Science. 352:167–169. 10.1126/science.aaf6546 - DOI - PMC - PubMed

Publication types