. 2020 Aug 6;182(3):685-712.e19.
doi: 10.1016/j.cell.2020.06.034. Epub 2020 Jun 28.

The Global Phosphorylation Landscape of SARS-CoV-2 Infection

Mehdi Bouhaddou  1 Danish Memon  2 Bjoern Meyer  3 Kris M White  4 Veronica V Rezelj  3 Miguel Correa Marrero  2 Benjamin J Polacco  1 James E Melnyk  5 Svenja Ulferts  6 Robyn M Kaake  1 Jyoti Batra  1 Alicia L Richards  1 Erica Stevenson  1 David E Gordon  1 Ajda Rojc  1 Kirsten Obernier  1 Jacqueline M Fabius  1 Margaret Soucheray  1 Lisa Miorin  4 Elena Moreno  4 Cassandra Koh  3 Quang Dinh Tran  3 Alexandra Hardy  3 Rémy Robinot  7 Thomas Vallet  3 Benjamin E Nilsson-Payant  8 Claudia Hernandez-Armenta  2 Alistair Dunham  2 Sebastian Weigang  9 Julian Knerr  6 Maya Modak  1 Diego Quintero  1 Yuan Zhou  1 Aurelien Dugourd  10 Alberto Valdeolivas  10 Trupti Patil  1 Qiongyu Li  1 Ruth Hüttenhain  1 Merve Cakir  1 Monita Muralidharan  1 Minkyu Kim  1 Gwendolyn Jang  1 Beril Tutuncuoglu  1 Joseph Hiatt  1 Jeffrey Z Guo  1 Jiewei Xu  1 Sophia Bouhaddou  11 Christopher J P Mathy  12 Anna Gaulton  2 Emma J Manners  2 Eloy Félix  2 Ying Shi  5 Marisa Goff  8 Jean K Lim  8 Timothy McBride  13 Michael C O'Neal  13 Yiming Cai  13 Jason C J Chang  13 David J Broadhurst  13 Saker Klippsten  13 Emmie De Wit  14 Andrew R Leach  2 Tanja Kortemme  12 Brian Shoichet  15 Melanie Ott  16 Julio Saez-Rodriguez  10 Benjamin R tenOever  8 R Dyche Mullins  5 Elizabeth R Fischer  14 Georg Kochs  17 Robert Grosse  18 Adolfo García-Sastre  19 Marco Vignuzzi  20 Jeffery R Johnson  21 Kevan M Shokat  22 Danielle L Swaney  23 Pedro Beltrao  24 Nevan J Krogan  25
Affiliations

The Global Phosphorylation Landscape of SARS-CoV-2 Infection

Mehdi Bouhaddou et al. Cell. .

Abstract

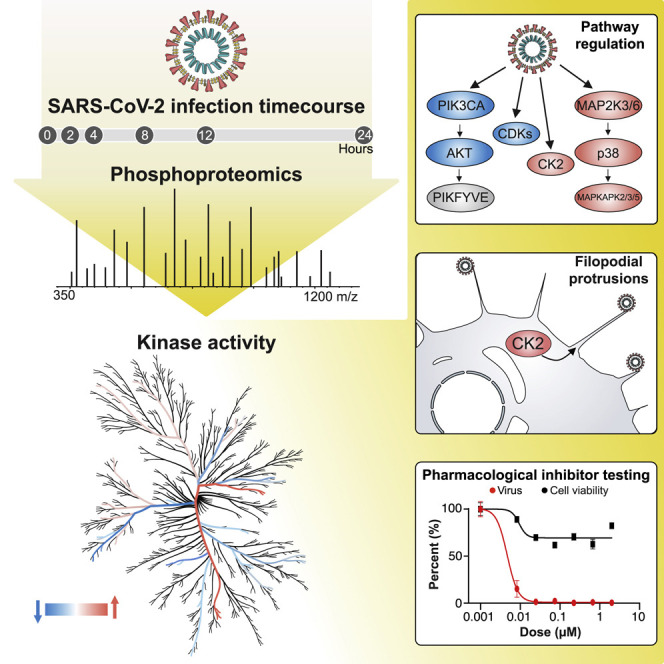
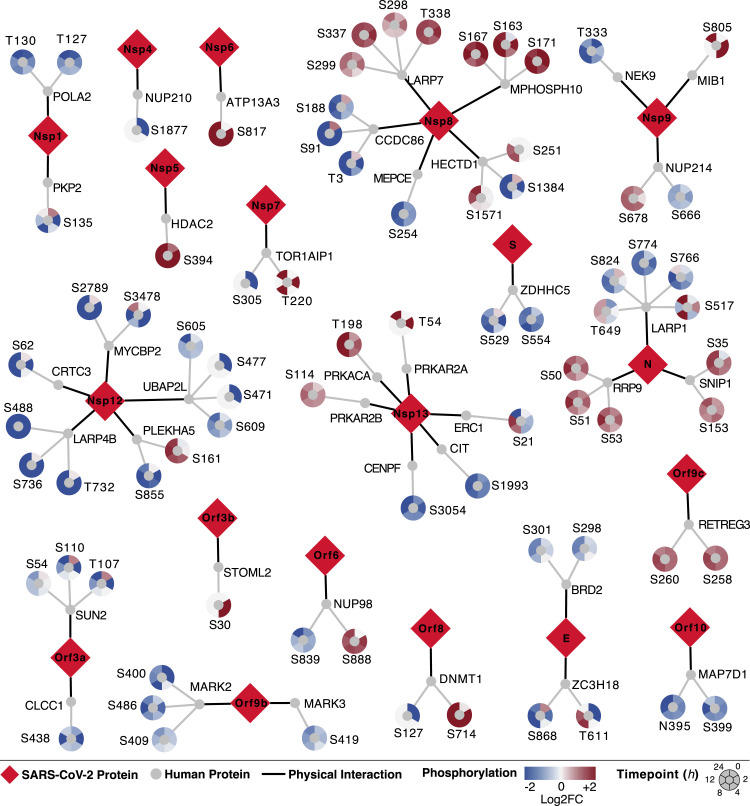
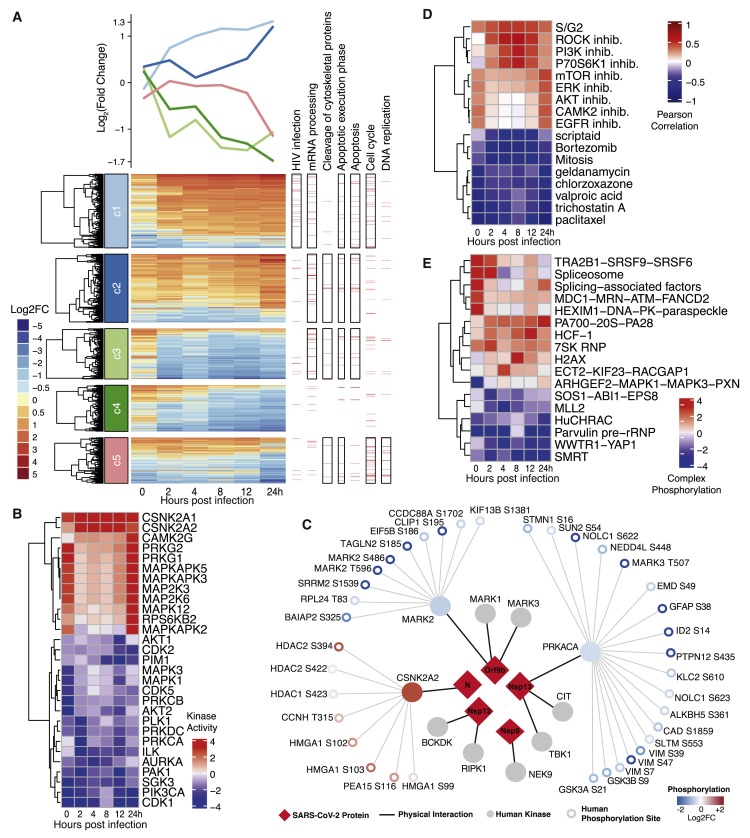
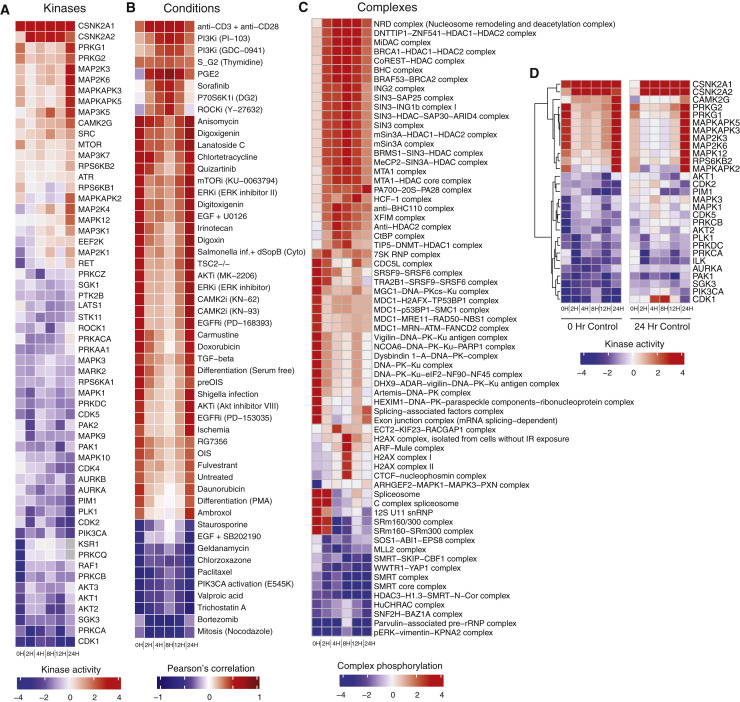
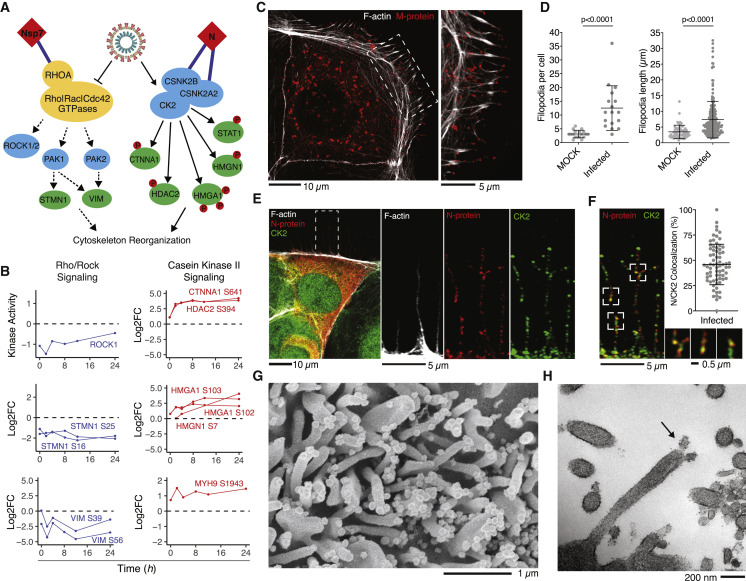
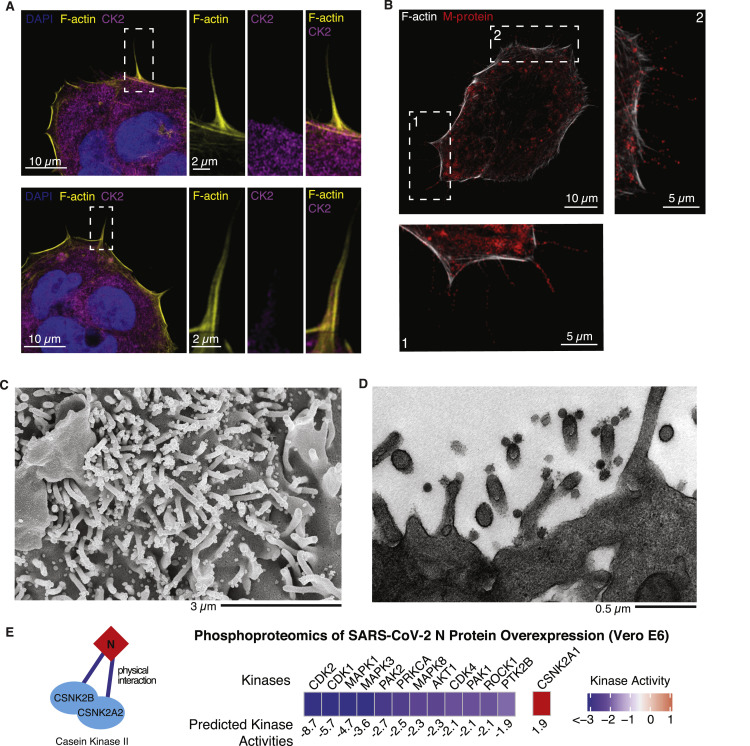
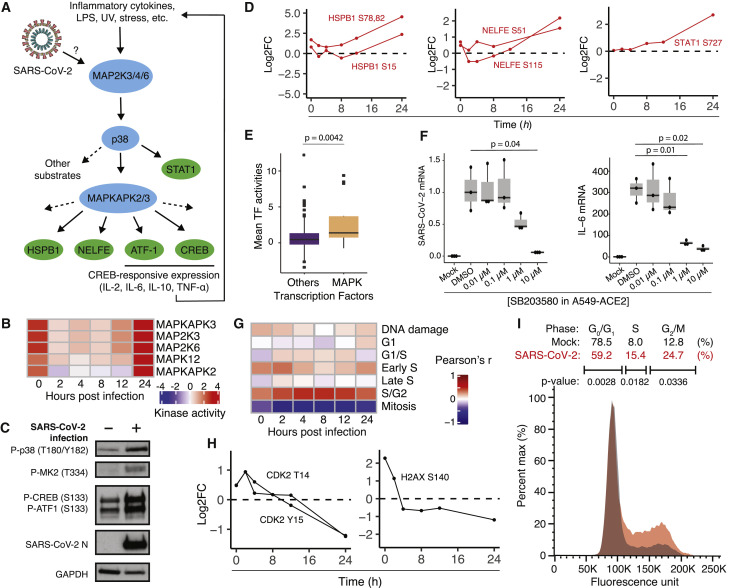
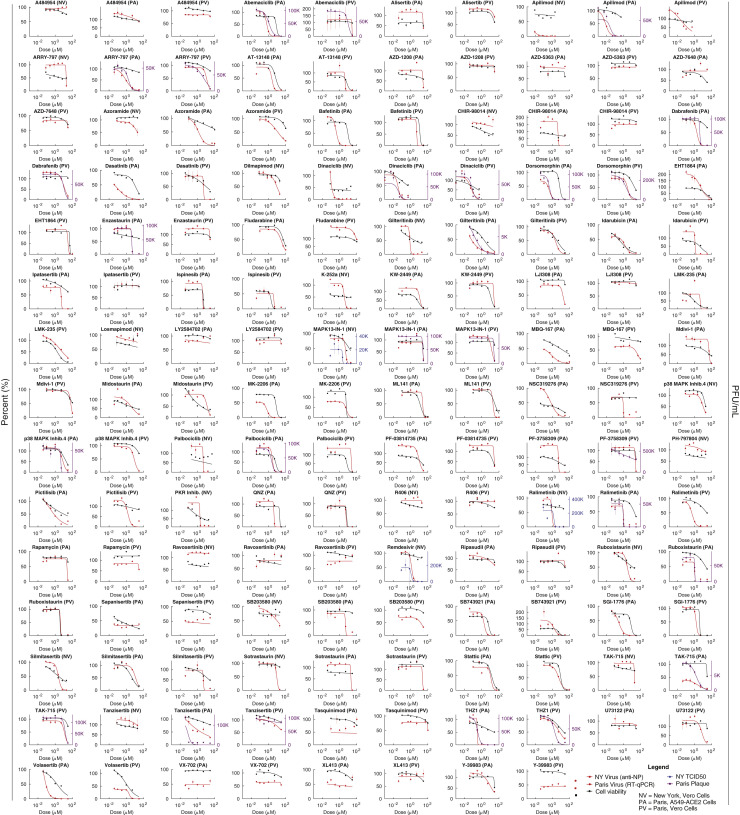
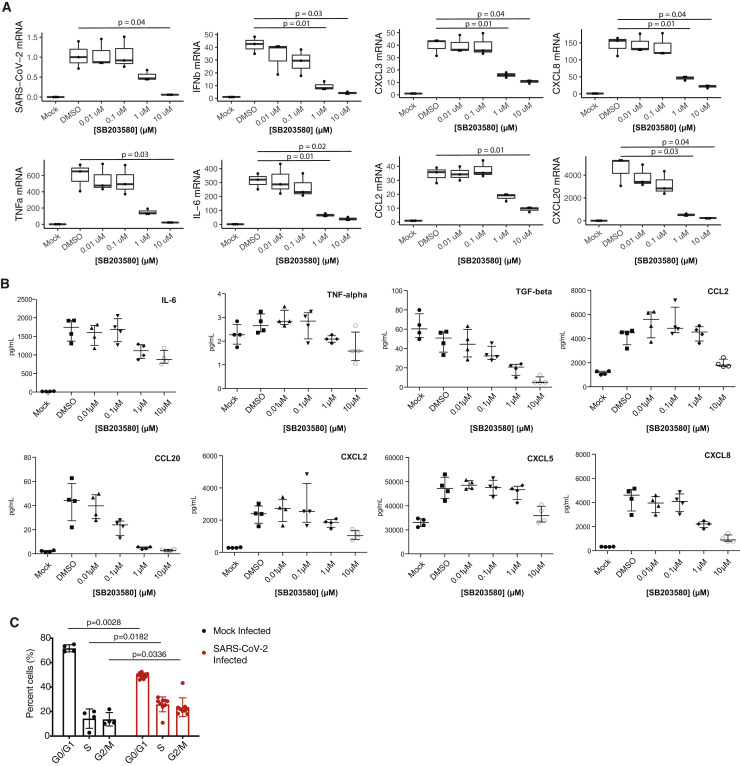
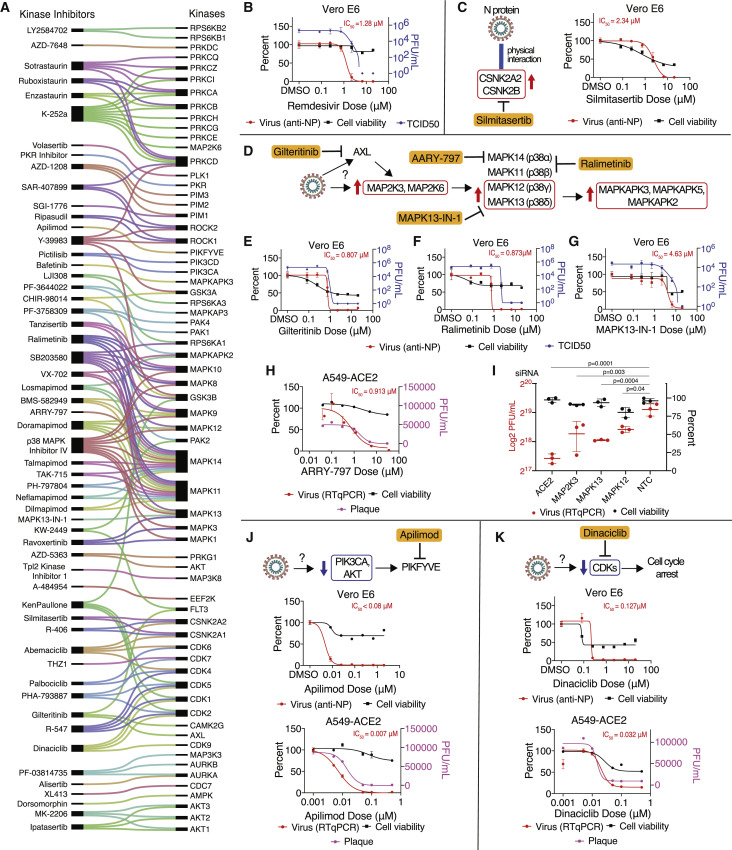
The causative agent of the coronavirus disease 2019 (COVID-19) pandemic, severe acute respiratory syndrome coronavirus 2 (SARS-CoV-2), has infected millions and killed hundreds of thousands of people worldwide, highlighting an urgent need to develop antiviral therapies. Here we present a quantitative mass spectrometry-based phosphoproteomics survey of SARS-CoV-2 infection in Vero E6 cells, revealing dramatic rewiring of phosphorylation on host and viral proteins. SARS-CoV-2 infection promoted casein kinase II (CK2) and p38 MAPK activation, production of diverse cytokines, and shutdown of mitotic kinases, resulting in cell cycle arrest. Infection also stimulated a marked induction of CK2-containing filopodial protrusions possessing budding viral particles. Eighty-seven drugs and compounds were identified by mapping global phosphorylation profiles to dysregulated kinases and pathways. We found pharmacologic inhibition of the p38, CK2, CDK, AXL, and PIKFYVE kinases to possess antiviral efficacy, representing potential COVID-19 therapies.

Keywords: AXL; CDK; MAPK; PIKFYVE; SARS-CoV-2; antiviral; casein kinase II; mass spectrometry; p38; phosphoproteomics.


Conflict of interest statement

Declaration of Interests The Krogan laboratory has received research support from Vir Biotechnology and F. Hoffmann-La Roche. K.M.S. has consulting agreements for the following companies involving cash and/or stock compensation: Black Diamond Therapeutics, BridGene Biosciences, Denali Therapeutics, Dice Molecules, eFFECTOR Therapeutics (zotatifin and tomivosertib), Erasca, Genentech/Roche, Janssen Pharmaceuticals, Kumquat Biosciences, Kura Oncology, Merck, Mitokinin, Petra Pharma, Qulab Inc. Revolution Medicines (WDB002), Type6 Therapeutics, Venthera, and Wellspring Biosciences (Araxes Pharma).

Figures

None
Graphical abstract
Figure 1
Figure 1
Global Proteomics of Phosphorylation and Abundance Changes upon SARS-CoV-2 Infection (A) Vero E6 cells were infected with SARS-CoV-2 (MOI 1.0). After 1 h of viral uptake, cells were harvested (0 h) or, subsequently, after 2, 4, 8, 12, or 24 h. As a control, Vero E6 cells were also mock infected for 1 h and harvested immediately thereafter (0 h) or after 24 h of mock infection. All conditions were performed in biological triplicate. Following cell harvest, cells were lysed, and proteins were digested into peptides. Aliquots of all samples were analyzed by mass spectrometry (MS) to measure changes in protein abundance upon infection, whereas the remaining sample was enriched for phosphorylated peptides and subsequently analyzed to measure changes in phosphorylation signaling. A DIA approach was used for all MS acquisitions. Last, all phosphorylation sites and protein identifiers were mapped to their respective human protein orthologs. (B) Principal-component analysis (PCA) of phosphorylation replicates after removing outliers. See also Figure S1. (C) Correlation of protein abundance (AB) and phosphorylation sites (PHs) between replicates within a biological condition (red) and across biological conditions (black). Boxplots depict median (horizonal lines), interquartile range (boxes), maximum and minimum values (vertical lines), and outliers (solid circles). (D) Median AB of individual SARS-CoV-2 proteins in the protein AB analysis. (E) The number of significantly regulated PH groups across the infection time course. (F) Volcano plot of PH group quantification 24 h after infection. (G) The number of significantly regulated proteins across the infection time course. (H) Volcano plot of protein AB quantification 24 h after infection. (I) Gene Ontology enrichment analysis of all significantly changing proteins in terms of AB divided into two sets: downregulated (blue) and upregulated (red). (J) Proportion of significantly regulated PH groups with a correlated (i.e., same direction, AB match) or anticorrelated (i.e., opposite direction, AB mismatch) significant or insignificant (gray) change in protein AB. In (E)–(H), all infection time points are compared with the mock infection at 0 h, and significantly regulated proteins are defined as (absolute value of log2(infection/mock) > 1 and adjusted p < 0.05 or when only detected in infected or mock based on replicate and MS feature counts; STAR Methods). See also Figure S1.
Figure S1
Figure S1
Proteomics: Quality Control (QC), Orthology, Enrichments, and Viral Proteins, Related to Figure 1 (A) Principal component analysis computed on intensities summarized by MSstats at the level of phosphorylation site groups within (from left to right) all runs, with one outlier run removed, and with two outlier runs removed. Outlier runs are labeled 00Hr.2 and 02.Hr.2. (B) Principal components analysis computed on protein intensities as summarized by MSstats (from left to right) within all runs, with one outlier run removed, and with two outlier runs removed. Outlier runs are both labeled 00Hr.2; one is mock and the other is infected. (C) Coefficient of variance boxplot for each condition. Black lines depict the median and their values are indicated above each boxplot. (D) Mapping detected and quantifiable proteins and phosphorylation sites from the green monkey (Chlorocebus sabaeus) protein sequences to human genes. Proteins and sites were considered quantifiable if MSstats computed a non-infinite fold change for any time point or if an infinite log2 fold change passes criteria for inclusion in any time point. (E) Intensities of viral proteins as summarized over all peptide ion fragments by MSstats, averaged across replicates. The MSstats summarization is based on the median intensity of all fragments after data pre-processing (STAR Methods). (F) Gene Ontology enrichment analysis for proteins significantly regulated in terms of abundance upon infection, separated by time point and direction of phosphorylation regulation. All terms with significant over-representation (adjusted p value < 0.01) in the regulated gene set are kept, and redundant terms are removed (see STAR Methods). Numbers in cells indicate the number of genes that match the term for a given time point and direction. (G) Gene Ontology enrichment analysis for significantly phosphorylated proteins upon infection, separated by time point and direction of protein regulation. Details same as for (F).
Figure 2
Figure 2
Overview of SARS-CoV-2 Viral Protein PHs in the Host Cell (A) Localization of PHs across viral protein sequences from this study and a previous study (Davidson et al., 2020). Stem height indicates predicted deleteriousness of alanine substitutions. Dot color indicates whether the residue is (true) or is not (false) predicted to form part of an interaction interface based on SPPIDER analysis. Positions with no structural coverage are excluded from interface prediction. (B) Distribution of secondary structure elements in which viral PHs were found, as classified by the define secondary structure of proteins (DSSP) tool. (C) Distribution of top matching host kinases to viral PHs according to NetPhorest tool (Horn et al., 2014). (D) Phosphorylation cluster in the C-terminal tail of the M protein (red residues) structure (Heo and Feig 2020) and associated sequence motif. Asterisks indicate PHs. (E) Alignment of M protein phosphorylation clusters across different coronaviruses. Asterisks indicate PHs. (F) Surface electrostatic potential of non-phosphorylated (left) and phosphorylated (right) RNA-binding domains of the N protein (PDB: 6M3M). Positions of PHs are indicated by arrows. Blue denotes a positive charge potential, and red indicates a negative charge potential. Electrostatic potential was computed with the Advanced Poisson-Boltzmann Solver (APBS) tool after preparation with the PDB2PQR tool.
Figure 3
Figure 3
Phosphorylation on SARS-CoV-2 Virus-Human Interacting Proteins The SARS-CoV-2 virus-host protein-protein interaction map (Gordon et al., 2020) found 332 human proteins interacting with 27 (26 wild-type and 1 mutant) viral proteins. Here we found 40 of 332 proteins significantly differentially phosphorylated across at least two time points (adjusted p < 0.05 and absolute value of log2 fold change [abs(log2FC)] > 1). Viral proteins are shown as red diamonds. Interacting human proteins are shown as gray circles. PHs emanate from human proteins, colored by their log2 fold change compared with uninfected control samples (red, increase; blue, decrease) at each time point (0, 2, 4, 8, 12, and 24 h after infection) in a clockwise fashion. An interactive version of phosphorylation data can be found at https://kroganlab.ucsf.edu/network-maps.
Figure 4
Figure 4
Signaling Changes in Host Cells in Response to SARS-CoV-2 Infection (A) Clusters of significantly changing PHs (abs(log2FC) > 1 and adjusted p < 0.05) across the time course of infection with non-redundant enriched Reactome pathway terms (adjusted p value [q] < 0.01) for each cluster. Horizontal red lines below each pathway term correspond to phosphorylated proteins belonging to the pathway, and a black-bordered rectangle is indicative of a significantly enriched term. (B) Kinases depicting a strong change in activity upon infection (abs(log10(p)) > 2.5) in at least one time point, with predicted activity in at least 5 of 6 time points. (C) Schematic representation of interaction between host kinases and SARS-CoV-2 viral proteins from Gordon et al. (2020). Substrate PHs for each kinase are color-coded as blue (down) and red (up) based on the direction of change during infection. Only PHs corresponding to the kinase activity direction are shown. (D) Correlation of kinase activity profiles of each time point with other biological conditions with at least one significantly changing kinase (abs(log10(p)) > 2.5) and having significant correlation with at least one time-point (false discovery rate [FDR] < 5%). (E) Overall phosphorylation change (−log10(p)) of a protein complex, estimated as the change in phosphorylation on member proteins. Only non-redundant protein complexes with a significant change in phosphorylation (abs(log10(p)) > 2.5) in at least one time point are shown. See also Figure S2.
Figure S2
Figure S2
Full Kinase Activities, Correlated Conditions, and Regulated Complexes, Related to Figure 4 (A) Changes in predicted kinase activities across different time points post-infection. (B) Correlation of kinase activity profiles of each time point with other biological conditions. Kinase activities were estimated for a wide-range of biological conditions obtained from previously published phosphoproteomics datasets (Ochoa et al., 2016). (C) Changes in phosphorylation in protein complexes. Overall phosphorylation change (-log10 (p value) of a protein complex was derived from change in phosphorylation of sites in member proteins. (D) Kinase activity estimates when using either the 0- or 24-h mock controls for those top regulated kinase activities from the 0-h control comparison.
Figure 5
Figure 5
Colocalization of CK2 and Viral Proteins at Actin Protrusions (A) Pathway of regulated PHs and SARS-CoV-2 interaction partners involved in cytoskeletal reorganization. Dashed lines indicate downregulation of activity, while solid lines indicate upregulation of activity. (B) Regulation of individual kinase activity or PHs depicted in (A). (C) Caco-2 cells infected with SARS-CoV-2 at an MOI of 0.1 for 24 h prior to immunostaining for F-actin and M protein, as indicated. Shown is a confocal section revealing M protein localization along and to the tip of filopodia (left) and magnification of the dashed box (right). (D) Dot plot quantification of the number and length of filopodia in untreated (mock) or infected Caco-2 cells for 24 h with SARS-CoV-2. Filopodium length was measured from the cortical actin to the tip of the filopodium. Error bars represent SD. Statistical testing by Mann-Whitney test. (E) Caco-2 cells infected with SARS-CoV-2 at an MOI of 0.01 for 24 h prior to immunostaining for F-actin, N protein, and casein kinase II (CK2) as indicated (left). Shown is magnification of the dashed box as single channels (right). (F) Magnification of the dashed box from (E) with quantification of colocalization between CK2 and N protein throughout infected Caco-2 cells. Displayed is the proportion of N protein-positive particles colocalizing with CK2. Error bars represent SD. (G and H) Scanning electron microscopy (G) and transmission electron microscopy (H) images of SARS-CoV-2 budding from Vero E6 cell filopodia (black arrow in H). See also Figure S3.
Figure S3
Figure S3
Microscopy Images Showing Response to SARS-CoV-2 Infection, Related to Figure 5 (A) Non-infected Caco2 cells co-stained for F-actin, CK2 and nuclei (DAPI). Magnification of the indicated area is displayed as a single channel and merged images on the right panels. (B) Caco2 cells infected with SARS-CoV-2 at an MOI of 0.1 for 24 h prior to immunostaining for F-actin and M-protein, as indicated. See lower (1) and right (2) panel for magnification of regions indicated by dashed boxes. (C) Scanning electron microscopy and (D) transmission electron microscopy image of SARS-CoV-2 budding from Vero E6 cell filopodia. (E) N protein was found to physically interact with casein kinase II subunits (cartoon, left), CSNK2B and CSNK2A2 (Gordon et al., 2020). To test whether N protein could directly control CK2 activity, N protein was transduced via lentivirus in Vero E6 cells and stably induced via doxycycline for 48 hours followed by phosphoproteomics analysis. Kinase activities were calculated as before (STAR Methods) and top up- (> 1.5, red) and downregulated (< 1.5, blue) kinases are shown. See Table S1 for full phosphoproteomics data and Table S4 for full list of predicted kinase activities.
Figure 6
Figure 6
SARS-CoV-2 Activates the p38/MAPK Signaling Pathway and Causes Cell Cycle Arrest (A) Diagram of the p38/MAPK signaling pathway. (B) Kinase activity analysis for kinases in the p38/MAPK pathway. (C) Western blot analysis of phosphorylated p38/MAPK signaling components in mock- and SARS-CoV-2-infected ACE2-A549 cells 24 h after infection. (D) Log2 fold change profiles of indicated p38/MAPK substrates during SARS-CoV-2 infection in Vero E6 cells. (E) Transcription factor activity analysis of SARS-CoV-2-infected A549, Calu-3, and NHBE cells, comparing p38/MAPK transcription factors with transcription factors not associated with the p38/MAPK pathway. Statistical test: Mann-Whitney test. (F) qRT-PCR analysis of the indicated mRNA from ACE2-A549 cells pre-treated with the p38 inhibitor SB203580 at the indicated concentrations for 1 h prior to infection with SARS-CoV-2 for 24 h. Statistical test: Student’s t test. See also Figures S4 and S5. (G) Heatmap of Pearson’s correlation coefficients comparing SARS-CoV-2-infected Vero E6 phosphorylation profiles with profiles of cells with induced DNA damage and cells arrested at the indicated cell cycle stages. (H) Log2 fold change profiles of the indicated cell cycle and DNA damage substrates during SARS-CoV-2 infection in Vero E6 cells. (I) DNA content analysis of cells infected with SARS-CoV-2 for 24 h compared with mock-infected cells.
Figure S5
Figure S5
Pharmacological Profiling for Viral Titers and Cell Viability, Related to Figure 7 Dose response of phosphoproteomics-informed drugs and compounds. Assays performed in New York (N; red, anti-NP; blue TCID50) and Paris (P; red, RT-qPCR; purple, plaque assays) across two cell lines (A549-ACE2 and Vero E6). Cell viability shown in black. Mean of three biological replicates is shown. Error bars are SEM.
Figure S4
Figure S4
Cytokine Profiling upon Infection, p38 Inhibition, and Cell Cycle Analysis, Related to Figure 6 (A) RT-qPCR analysis of indicated mRNA from A549-ACE2 cells pre-treated with p38 inhibitor SB203580 at indicated concentrations for one hour prior to infection with SARS-CoV-2 for 24 hours. Statistical test is Student’s t test. Error bars are SD. (B) Same as in (A) but a Luminex-based quantification of indicated cytokines. Error bars are SD. (C) Cell cycle analysis of Vero E6 cells (same as in Figure 6I) upon SARS-CoV-2 infection at an MOI of 1. Cell stained with DAPI DNA stain prior to flow cytometry analysis. Statistical test is Mann-Whitney test. Error bars are SD.
Figure 7
Figure 7
Mapping Regulated Kinases to Kinase Inhibitors Identifies SARS-CoV-2 Therapies (A) Kinase inhibitors (left) mapped to kinases (right) whose activity was regulated by SARS-CoV-2 infection. Lines connecting them indicate known kinase targets for each drug/compound. (B) Vero E6 cells pre-treated with remdesivir at the indicated doses, followed by SARS-CoV-2 infection for 48 h. Percent viral titer compared with mock drug treatment (anti-NP antibody; red line, dots, and text) and cell viability (black) is depicted. Error bars represent SD. (C) As in (B). Vero E6 cells were treated with the CK2 inhibitor silmitasertib. Physical interactions between N protein and the CSNK2A2 and CSNK2B CK2 subunits were observed in a prior study (Gordon et al., 2020). (D) Predicted increased kinase activity for the p38 signaling pathway and drugs/compounds targeting pathway members (ralimetinib, MAPK13-IN-1, and ARRY-797) and upstream drivers (gilteritinib). (E–G) As in (B). Vero E6 cells treated with the AXL inhibitor gilteritinib (E), the MAPK11/14 inhibitor ralimetinib (F), or the MAPK13 inhibitor MAPK13-IN-1 (G) prior to SARS-CoV-2 infection. (H) A549-ACE2 lung epithelial cells were treated with the MAPK14 inhibitor ARRY-797 prior to SARS-CoV-2 infection. (I) Small interfering RNA (siRNA) knockdown of p38 pathway genes in A549-ACE2 leads to a significant decrease in SARS-CoV-2 viral replication (red), as assessed by qRT-PCR in the absence of effects on cell viability (black). ACE2 and non-targeting siRNAs are included as positive and negative controls, respectively. (J and K) Vero E6 or A549-ACE2 cells were treated with PIKFYVE inhibitor apilimod (J) or the CDK inhibitor dinaciclib (K) prior to SARS-CoV-2 infection. See also Figure S6.

References

    1. Abraham J., Kelly J., Thibault P., Benchimol S. Post-translational modification of p53 protein in response to ionizing radiation analyzed by mass spectrometry. J. Mol. Biol. 2000;295:853–864. - PubMed
    1. Alfonso R., Lutz T., Rodriguez A., Chavez J.P., Rodriguez P., Gutierrez S., Nieto A. CHD6 chromatin remodeler is a negative modulator of influenza virus replication that relocates to inactive chromatin upon infection. Cell. Microbiol. 2011;13:1894–1906. - PubMed
    1. Ali N., Pruijn G.J., Kenan D.J., Keene J.D., Siddiqui A. Human La antigen is required for the hepatitis C virus internal ribosome entry site-mediated translation. J. Biol. Chem. 2000;275:27531–27540. - PubMed
    1. Allen M.P., Linseman D.A., Udo H., Xu M., Schaack J.B., Varnum B., Kandel E.R., Heidenreich K.A., Wierman M.E. Novel mechanism for gonadotropin-releasing hormone neuronal migration involving Gas6/Ark signaling to p38 mitogen-activated protein kinase. Mol. Cell. Biol. 2002;22:599–613. - PMC - PubMed
    1. Alvarez D.E., Agaisse H. Casein kinase 2 regulates vaccinia virus actin tail formation. Virology. 2012;423:143–151. - PubMed

Publication types

MeSH terms

Substances