Review
. 2020 Jul 7;9(7):1630.
doi: 10.3390/cells9071630.

Metabolome Changes in Cerebral Ischemia

Affiliations
Review

Metabolome Changes in Cerebral Ischemia

Tae Hwan Shin et al. Cells. .

Abstract

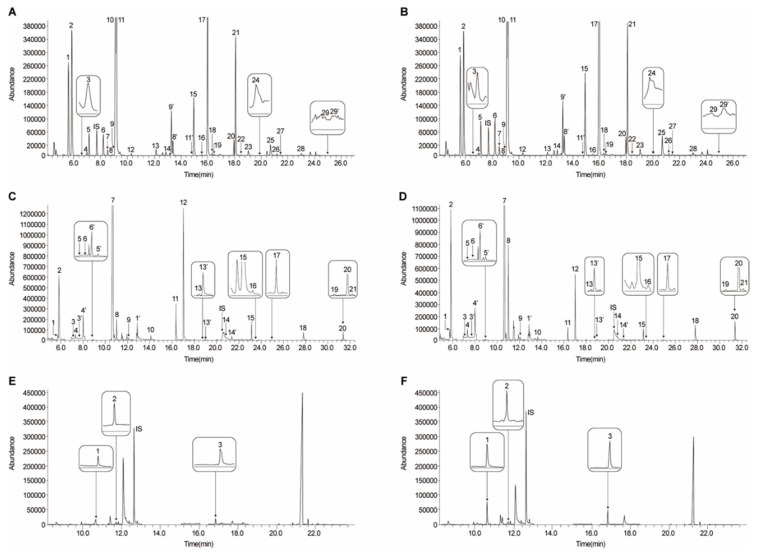
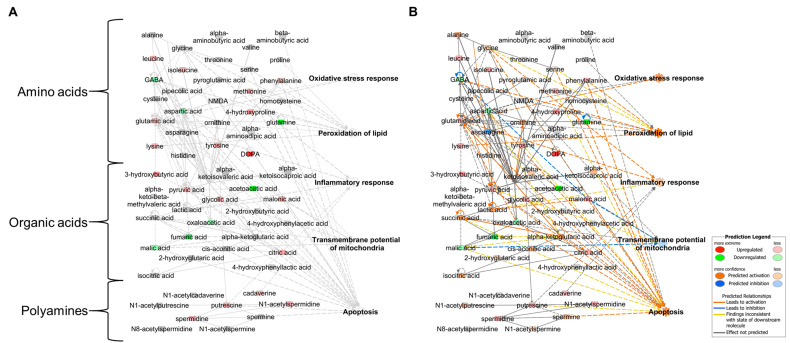
Cerebral ischemia is caused by perturbations in blood flow to the brain that trigger sequential and complex metabolic and cellular pathologies. This leads to brain tissue damage, including neuronal cell death and cerebral infarction, manifesting clinically as ischemic stroke, which is the cause of considerable morbidity and mortality worldwide. To analyze the underlying biological mechanisms and identify potential biomarkers of ischemic stroke, various in vitro and in vivo experimental models have been established investigating different molecular aspects, such as genes, microRNAs, and proteins. Yet, the metabolic and cellular pathologies of ischemic brain injury remain not fully elucidated, and the relationships among various pathological mechanisms are difficult to establish due to the heterogeneity and complexity of the disease. Metabolome-based techniques can provide clues about the cellular pathologic status of a condition as metabolic disturbances can represent an endpoint in biological phenomena. A number of investigations have analyzed metabolic changes in samples from cerebral ischemia patients and from various in vivo and in vitro models. We previously analyzed levels of amino acids and organic acids, as well as polyamine distribution in an in vivo rat model, and identified relationships between metabolic changes and cellular functions through bioinformatics tools. This review focuses on the metabolic and cellular changes in cerebral ischemia that offer a deeper understanding of the pathology underlying ischemic strokes and contribute to the development of new diagnostic and therapeutic approaches.

Keywords: cerebral ischemia; metabolic network; metabolomics; middle cerebral artery occlusion; oxygen-glucose deprivation.


Conflict of interest statement

The authors declare no conflicts of interest.

Figures

Figure 1
Figure 1
(A) Coronal T2 weighted images. High signal intensity indicates cerebral infarction in the middle cerebral artery (MCA) territory from a patient with occlusion of M1 of MCA and mild stenosis of the proximal cervical internal carotid artery with fibrofatty plaque. Coronal T2 weighted magnetic resonance images were acquired using a clinical 3 T scanner (GE Healthcare, Signa pioneer, USA) with a 24-channel coil, and the following parameters: repetition time (TR) 5745 ms; echo time (TE) 116 ms; flip angle of 142°; matrix size 416 × 416; and 5.0  mm slice thickness. This study was approved by the Scientific-Ethical Review Board of Ajou University Medical Center (AJIRB-MED-EXP-20-044). (B) Schematic diagram of the surgical procedure of MCAo model, and cerebral coronal sections (2 mm thick) of MCAo lesioned rat brains at 24 h were stained with 2, 3, 5-Triphenyltetrazolium chloride (TTC). Anterior communication artery (ACA); posterior cerebral artery (PCA); internal carotid artery (ICA); external carotid artery (ECA); common carotid artery (CCA). TTC-stained image is reproduced from our previous study, Copyright© 2009 with permission from Elsevier [14].
Figure 2
Figure 2
GC–MS chromatograms of 29 AAs, 21 OAs, and 9 PAs. SIM chromatograms of control and 5 days post MCAo rat brain. AAs from control (A) and MCAo rat brain (B) SIM chromatograms: 1 = alanine; 2 = glycine; 3 = α-aminobutyric acid; 4 = valine; 5 = β-aminoisobutyric acid; IS = norvaline; 6 = leucine; 7 = isoleucine; 8 = threonine; 9 = serine; 10 = proline; 11 = γ-aminobutyric acid (GABA); 12 = pipecolic acid; 13 = pyroglutamic acid; 14 = methionine; 9′ = serine; 8′ = threonine; 11′ = GABA; 15 = phenylalanine; 16 = cysteine; 17 = aspartic acid; 18 = N-methyl-dl-aspartic acid; 19 = 4–hydroxyproline; 20 = homocysteine; 21 = glutamic acid; 22 = asparagine; 23 = ornithine; 24 = α-aminoadipic acid; 25 = glutamine; 26 = lysine; 27 = histidine; 28 = tyrosine; 29 = DOPA; 29′ = DOPA. OAs from control (C) and MCAo rat brain (D) SIM chromatograms: 1 = 3-hydroxybutyric acid; 2 = pyruvic acid; 3 = α-ketoisovaleric acid; 4 = acetoacetic acid; 3′ = α-ketoisovaleric acid; 4′ = acetoacetic acid; 5 = α-ketoisocaproic acid; 6= α-keto-β-methylvaleric acid; 6′= α-keto-β-methylvaleric acid; 5′= α-ketoisocaproic acid; 7 = lactic acid; 8 = glycolic acid; 9 = 2-hydroxybutyric acid; 1′ = 3-hydroxybutyric acid; 10 = malonic acid; 11 = succinic acid; 12 = fumaric acid; 13 = oxaloacetic acid; 13′ = oxaloacetic acid; IS = 3,4-dimethoxybenzoic acid; 14 = α-ketoglutaric acid; 14′ = α-ketoglutaric acid; 15 = 4-hydroxyphenylacetic acid; 16 = malic acid; 17 = 2-hydroxyglutaric acid; 18 = cis-aconitic acid; 19 = 4-hydroxyphenyllactic acid; 20 = citric acid; 21 = isocitric acid. PAs from control (E) and MCAo rat brain (F) SIM chromatograms: 1 = putrescine; 2 = cadaverine; 3 = spermidine. PAs data is reproduced from our pervious study, Copyright © 2016 [65].
Figure 3
Figure 3
Functional analysis of metabolomic network of MCAo rat brain tissue using IPA. Metabolomic network (A) and metabolomic network with prediction (B). Fold change ± 1.2 was used as cut-off value. Red and green areas indicate up- and downregulated metabolites, respectively. Orange and blue areas indicate prediction as activation and inhibition, respectively. Prediction Legends are originated from Ingenuity Systems (http://www.ingenuity.com).

References

    1. Virani S.S., Alonso A., Benjamin E.J., Bittencourt M.S., Callaway C.W., Carson A.P., Chamberlain A.M., Chang A.R., Cheng S., Delling F.N., et al. Heart Disease and Stroke Statistics-2020 Update: A Report From the American Heart Association. Circulation. 2020;141:e139–e596. doi: 10.1161/CIR.0000000000000757. - DOI - PubMed
    1. Lee R.H.C., Lee M.H.H., Wu C.Y.C., Couto E.S.A., Possoit H.E., Hsieh T.H., Minagar A., Lin H.W. Cerebral ischemia and neuroregeneration. Neural. Regen. Res. 2018;13:373–385. doi: 10.4103/1673-5374.228711. - DOI - PMC - PubMed
    1. Steliga A., Kowianski P., Czuba E., Waskow M., Morys J., Lietzau G. Neurovascular Unit as a Source of Ischemic Stroke Biomarkers-Limitations of Experimental Studies and Perspectives for Clinical Application. Transl. Stroke Res. 2019 doi: 10.1007/s12975-019-00744-5. - DOI - PMC - PubMed
    1. Sonderer J., Katan Kahles M. Aetiological blood biomarkers of ischaemic stroke. Swiss Med. Wkly. 2015;145:w14138. doi: 10.4414/smw.2015.14138. - DOI - PubMed
    1. Rainer T.H., Wong K.S., Lam W., Lam N.Y., Graham C.A., Lo Y.M. Comparison of plasma beta-globin DNA and S-100 protein concentrations in acute stroke. Clin. Chim. Acta. 2007;376:190–196. doi: 10.1016/j.cca.2006.08.025. - DOI - PubMed

Publication types

LinkOut - more resources