

Integrative Analyses of Widely Targeted Metabolic Profiling and Transcriptome Data Reveals Molecular Insight into Metabolomic Variations during Apple (Malus domestica) Fruit Development and Ripening
- PMID: 32645908
- PMCID: PMC7370097
- DOI: 10.3390/ijms21134797
Integrative Analyses of Widely Targeted Metabolic Profiling and Transcriptome Data Reveals Molecular Insight into Metabolomic Variations during Apple (Malus domestica) Fruit Development and Ripening
Abstract
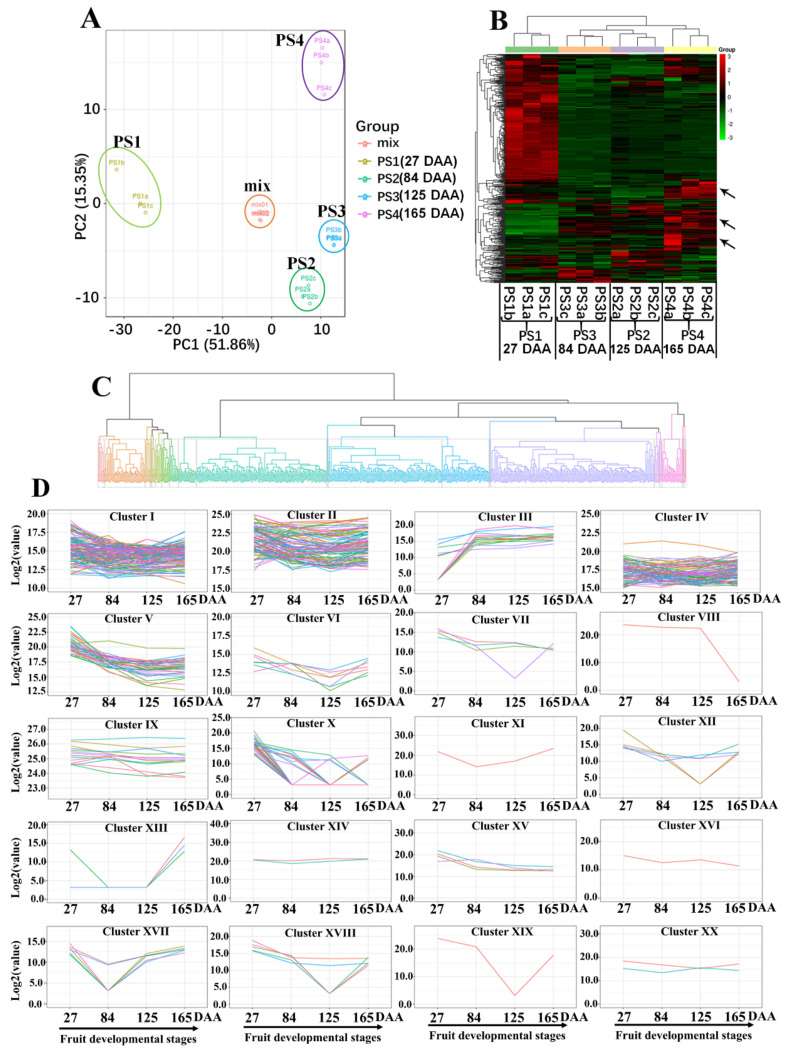
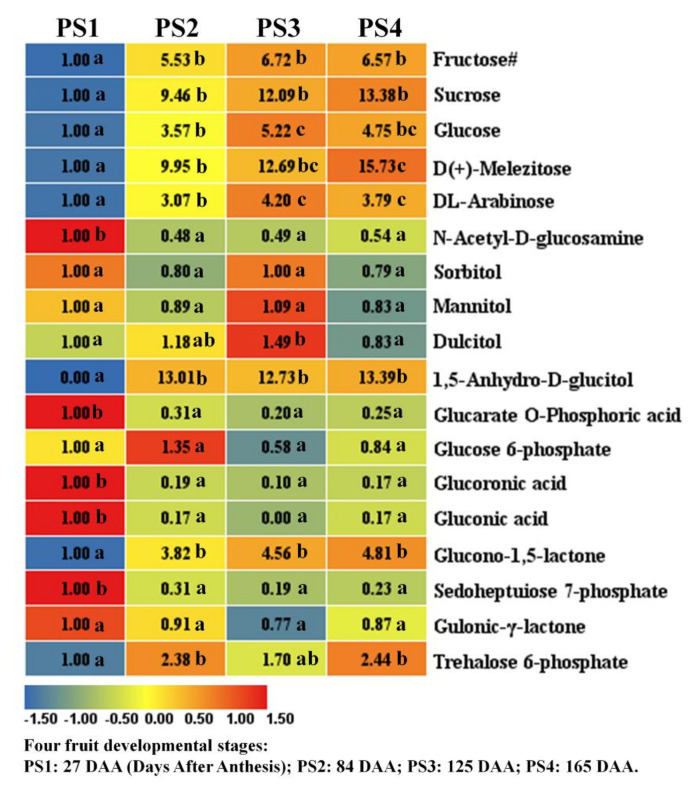
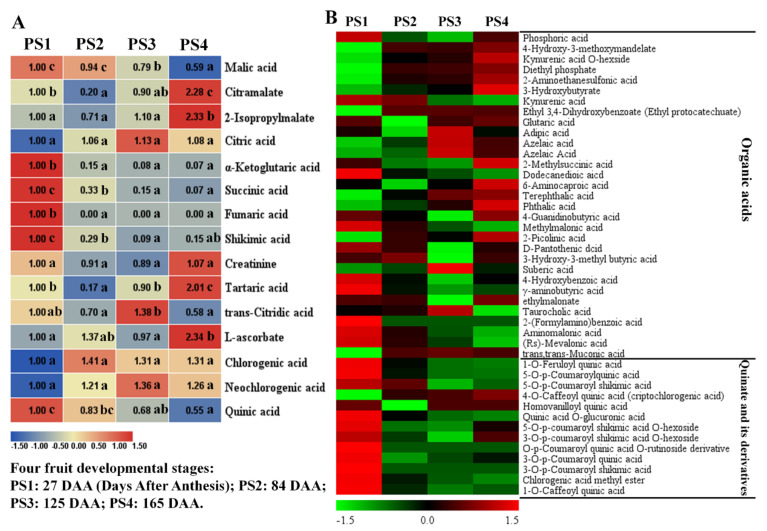
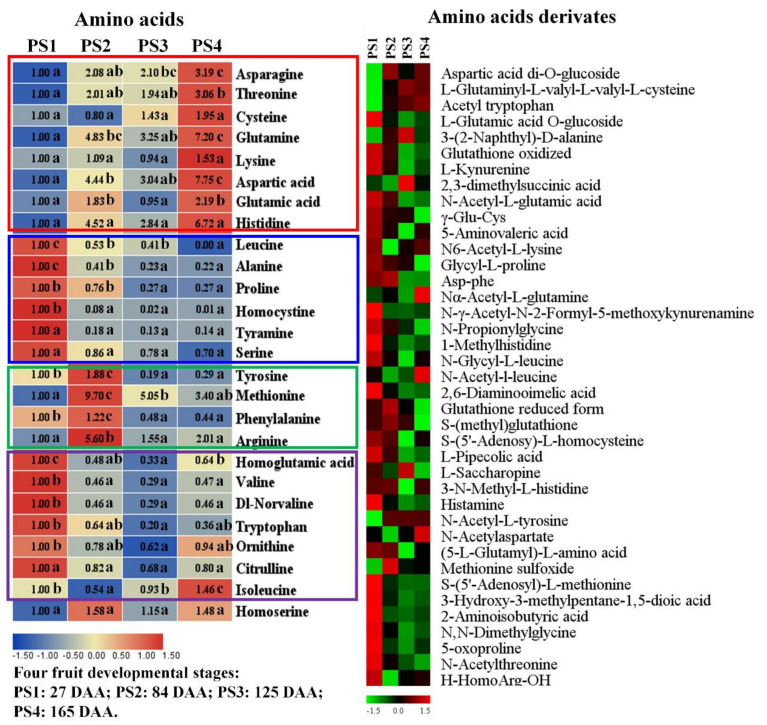
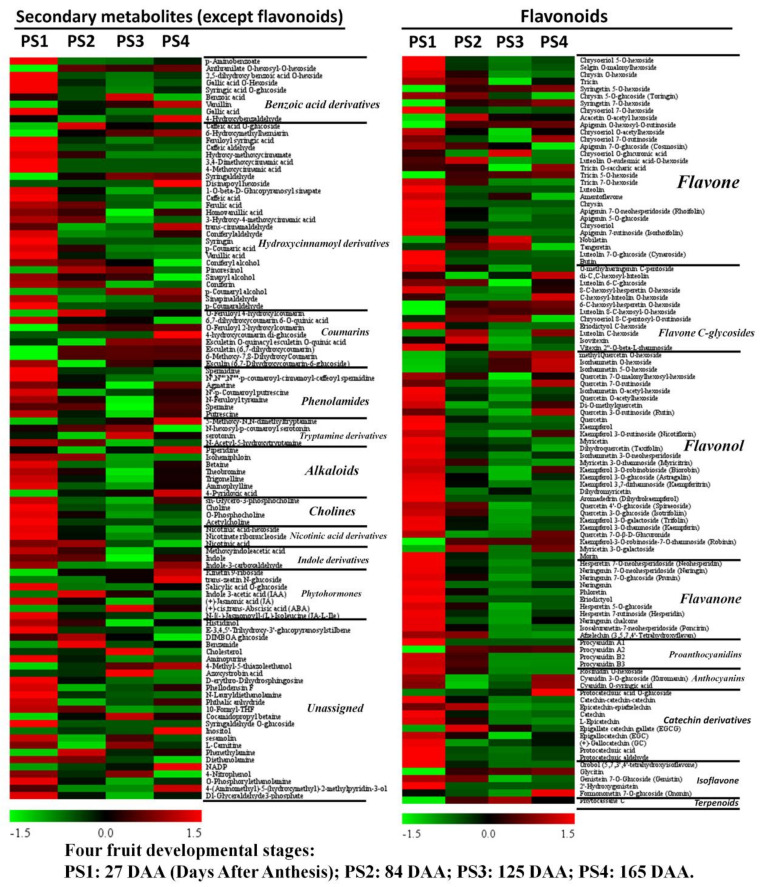
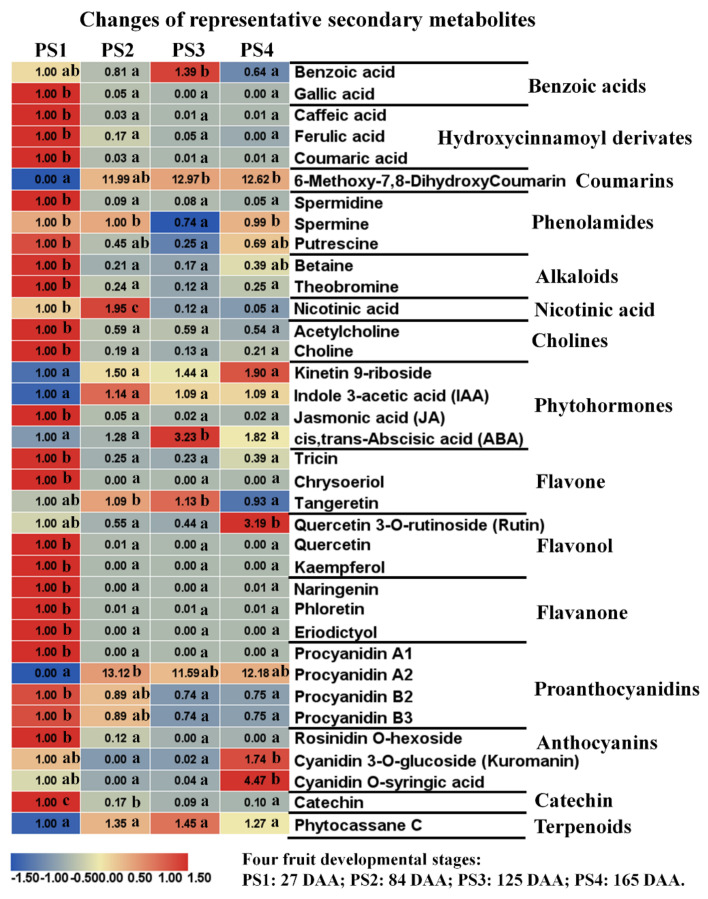
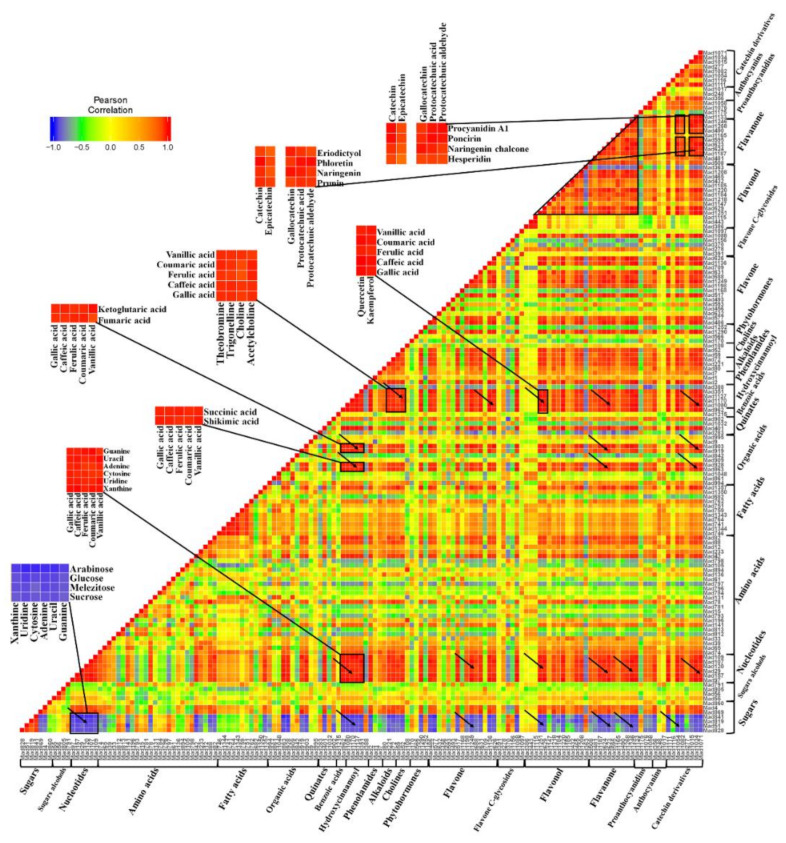
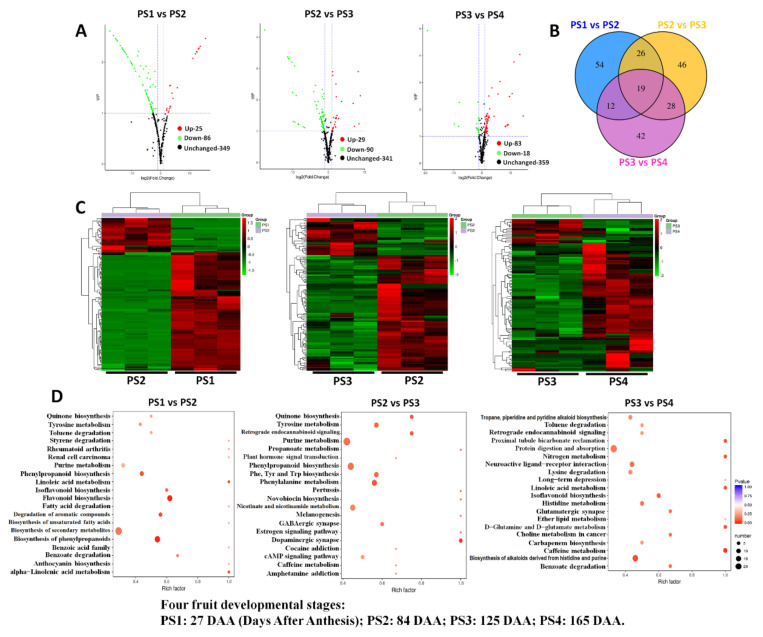
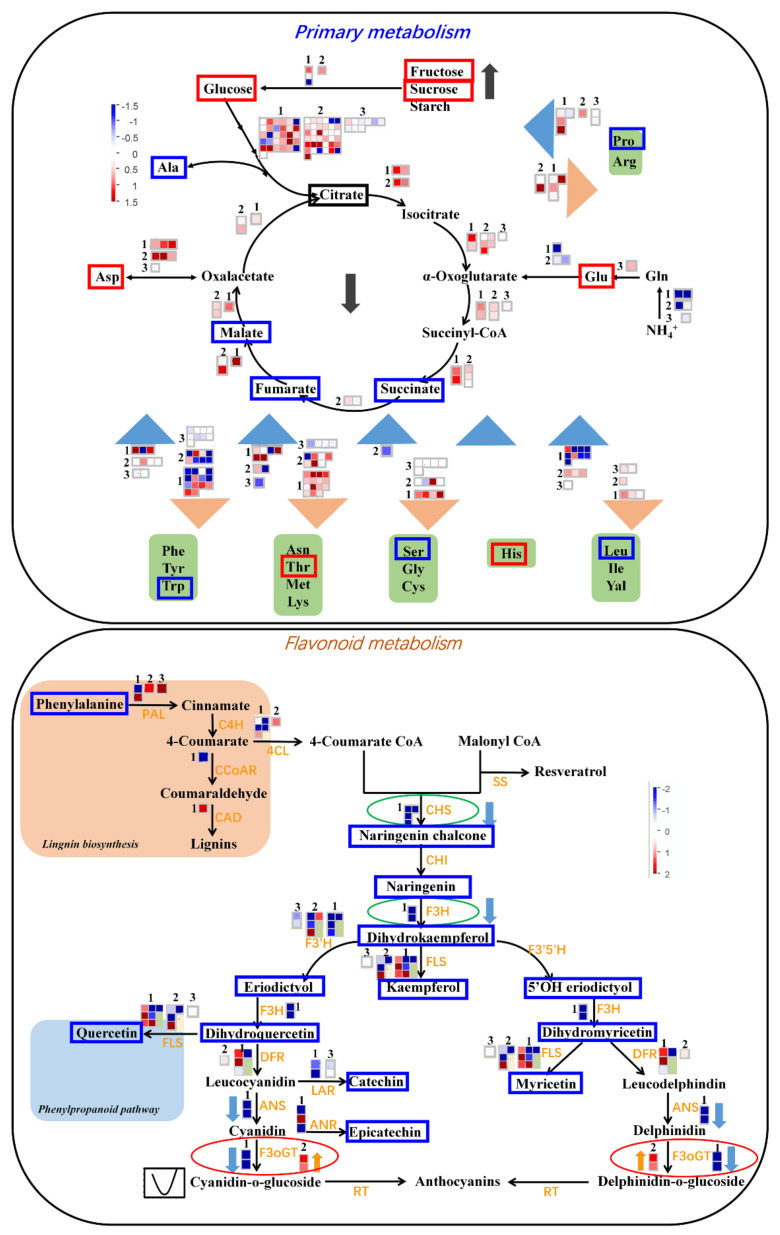
The apple is a favorite fruit for human diet and is one of the most important commercial fruit crops around the world. Investigating metabolic variations during fruit development can provide a better understanding on the formation of fruit quality. The present study applied a widely targeted LC-MS-based metabolomics approach with large-scale detection, identification and quantification to investigate the widespread metabolic changes during "Pinova" apple development and ripening. A total of 462 primary and secondary metabolites were simultaneously detected, and their changes along with the four fruit-development stages were further investigated. The results indicated that most of the sugars presented increasing accumulation levels while organic acid, including Tricarboxylic acid cycle (TCA) intermediates, showed a distinct decreasing trend across the four fruit-development stages. A total of 207 secondary metabolites consisted of 104 flavonoids and 103 other secondary metabolites. Many flavonoids maintained relatively high levels in the early fruit stage and then rapidly decreased their levels at the following developmental stages. Further correlation analyses of each metabolite-metabolite pair highlighted the cross talk between the primary and secondary metabolisms across fruit development and ripening, indicating the significant negative correlations between sugars and secondary metabolites. Moreover, transcriptome analysis provided the molecular basis for metabolic variations during fruit development. The results showed that most differentially expressed genes (DEGs) involved in the TCA cycle were upregulated from the early fruit stage to the preripening stage. The extensive downregulation of controlling genes involved in the flavonoid pathway is probably responsible for the rapid decrease of flavonoid content at the early fruit stage. These data provide a global view of the apple metabolome and a comprehensive analysis on metabolomic variations during fruit development, providing a broader and better understanding on the molecular and metabolic basis of important fruit quality traits in commercial apples.
Keywords: Malus domestica; fruit development; fruit quality; metabolome; transcriptome.
Conflict of interest statement
The authors declare no conflict of interest.
Figures
Similar articles
-
Integrative analyses of metabolome and transcriptome reveals metabolomic variations and candidate genes involved in sweet cherry (Prunus avium L.) fruit quality during development and ripening.PLoS One. 2021 Nov 15;16(11):e0260004. doi: 10.1371/journal.pone.0260004. eCollection 2021. PLoS One. 2021. PMID: 34780562 Free PMC article.
-
Comparative Transcriptomic Profiling to Understand Pre- and Post-Ripening Hormonal Regulations and Anthocyanin Biosynthesis in Early Ripening Apple Fruit.Molecules. 2018 Jul 31;23(8):1908. doi: 10.3390/molecules23081908. Molecules. 2018. PMID: 30065188 Free PMC article.
-
Metabolome and transcriptome profiling provide insights into green apple peel reveals light- and UV-B-responsive pathway in anthocyanins accumulation.BMC Plant Biol. 2021 Jul 24;21(1):351. doi: 10.1186/s12870-021-03121-3. BMC Plant Biol. 2021. PMID: 34303342 Free PMC article.
-
Research progress of fruit color development in apple (Malus domestica Borkh.).Plant Physiol Biochem. 2021 May;162:267-279. doi: 10.1016/j.plaphy.2021.02.033. Epub 2021 Mar 4. Plant Physiol Biochem. 2021. PMID: 33711720 Review.
-
Molecular Bases of Fruit Quality in Prunus Species: An Integrated Genomic, Transcriptomic, and Metabolic Review with a Breeding Perspective.Int J Mol Sci. 2020 Dec 30;22(1):333. doi: 10.3390/ijms22010333. Int J Mol Sci. 2020. PMID: 33396946 Free PMC article. Review.
Cited by
-
Cell Wall-Based Machine Learning Models to Predict Plant Growth Using Onion Epidermis.Int J Mol Sci. 2025 Mar 24;26(7):2946. doi: 10.3390/ijms26072946. Int J Mol Sci. 2025. PMID: 40243585 Free PMC article.
-
Changes in the proteomics and metabolomics profiles of Cormus Domestica (L.) fruits during the ripening process.BMC Plant Biol. 2024 Oct 10;24(1):945. doi: 10.1186/s12870-024-05677-2. BMC Plant Biol. 2024. PMID: 39390371 Free PMC article.
-
Metabolome profiling and molecular docking analysis revealed the metabolic differences and potential pharmacological mechanisms of the inflorescence and succulent stem of Cistanche deserticola.RSC Adv. 2021 Aug 9;11(44):27226-27245. doi: 10.1039/d0ra07488h. eCollection 2021 Aug 9. RSC Adv. 2021. PMID: 35480642 Free PMC article.
-
Metabolome and Transcriptome Integration Reveals Insights Into Flavor Formation of 'Crimson' Watermelon Flesh During Fruit Development.Front Plant Sci. 2021 May 12;12:629361. doi: 10.3389/fpls.2021.629361. eCollection 2021. Front Plant Sci. 2021. PMID: 34054886 Free PMC article.
-
Integrative Metabolomic and Transcriptomic Landscape during Akebia trifoliata Fruit Ripening and Cracking.Int J Mol Sci. 2023 Nov 24;24(23):16732. doi: 10.3390/ijms242316732. Int J Mol Sci. 2023. PMID: 38069056 Free PMC article.
References
-
- Holb I.J., Dremak P., Bitskey K., Gonda I. Yield response, pest damage and fruit quality parameters of scab-resistant and scab-susceptible apple cultivars in integrated and organic production systems. Sci. Hortic. 2012;145:109–117. doi: 10.1016/j.scienta.2012.08.003. - DOI
-
- Janssen B.J., Thodey K., Schaffer R.J., Alba R., Balakrishnan L., Bishop R., Bowen J.H., Crowhurst R.N., Gleave A.P., Ledger S., et al. Global gene expression analysis of apple fruit development from the floral bud to ripe fruit. BMC Plant Biol. 2008;8:16. doi: 10.1186/1471-2229-8-16. - DOI - PMC - PubMed
-
- Patricia Denne M. Fruit development and some tree factors affecting it. N. Z. J. Bot. 1963;1:265–294. doi: 10.1080/0028825X.1963.10428999. - DOI
-
- Denne M.P. The growth of apple fruitlets, and the effect of early thinning on fruit development. Ann. Bot. 1960;24:397–406. doi: 10.1093/oxfordjournals.aob.a083713. - DOI
MeSH terms
Substances
Grants and funding
- 31972370/National Natural Science Foundation of China
- 2017T100777/Special Financial Grant from the China Postdoctoral Science Foundation
- 2020JM-159/Natural Science Foundation of Shaanxi Province
- 2019YFD1000100/National key Research and Development Project of China
- 2016M592842/General Financial Grant from China Postdoctoral Science Foundation
LinkOut - more resources
Full Text Sources
