. 2020 Jul 7;9(7):892.
doi: 10.3390/foods9070892.

The Effect of Ethylene on the Color Change and Resistance to Botrytis cinerea Infection in 'Kyoho' Grape Fruits

Affiliations

The Effect of Ethylene on the Color Change and Resistance to Botrytis cinerea Infection in 'Kyoho' Grape Fruits

Tianyu Dong et al. Foods. .

Abstract

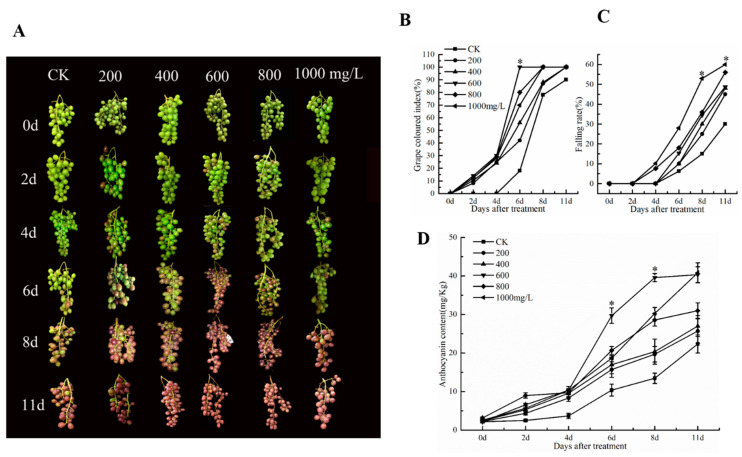
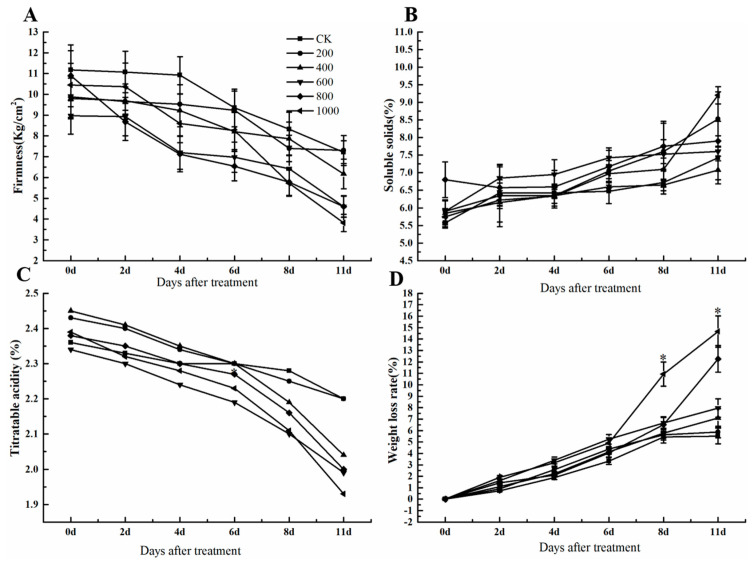
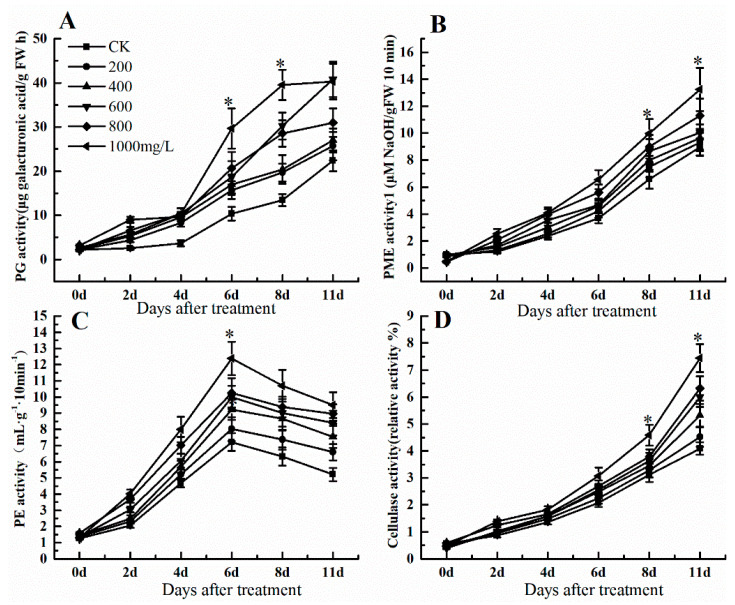
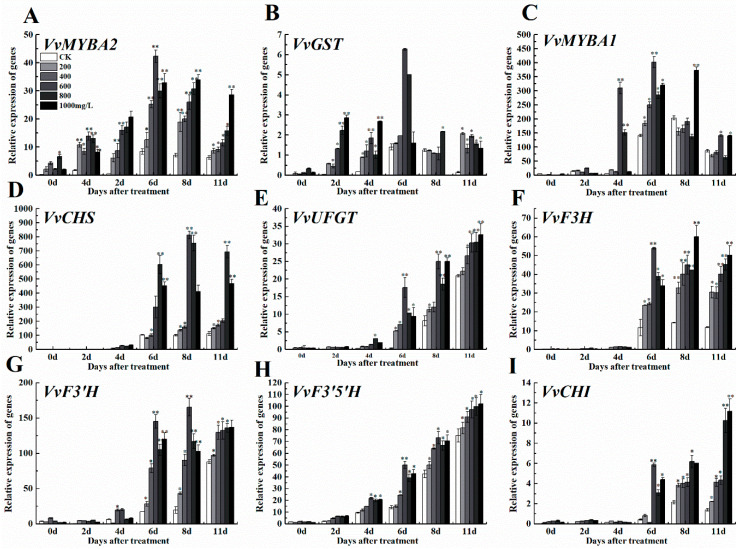
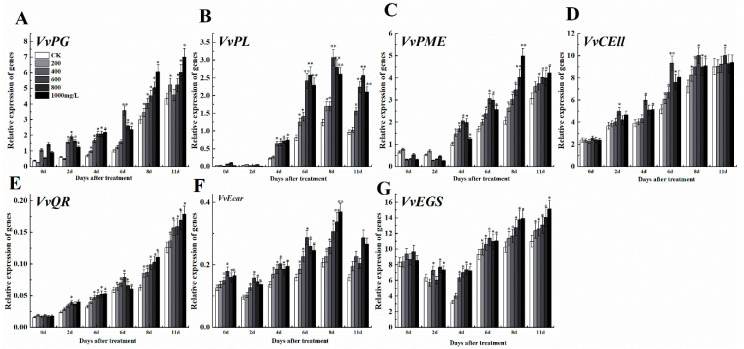
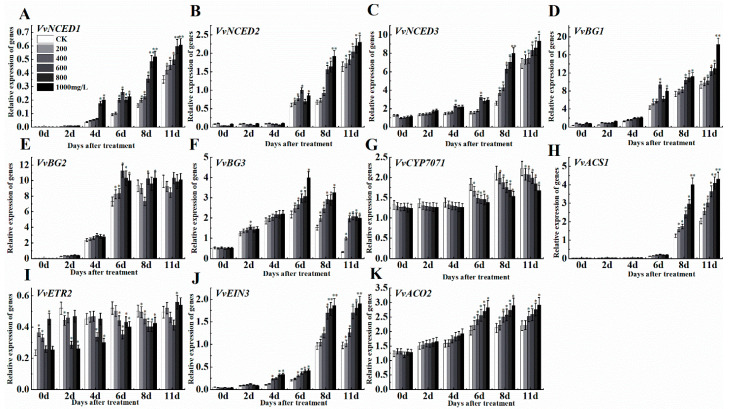
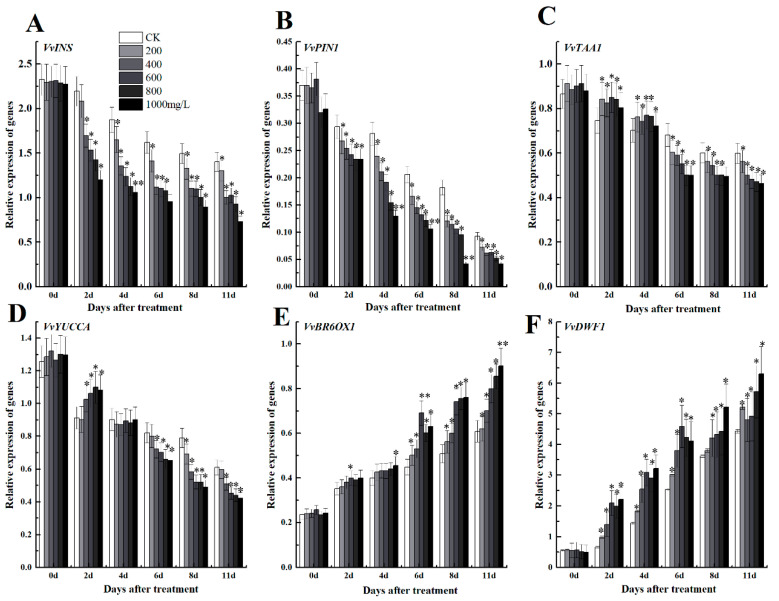
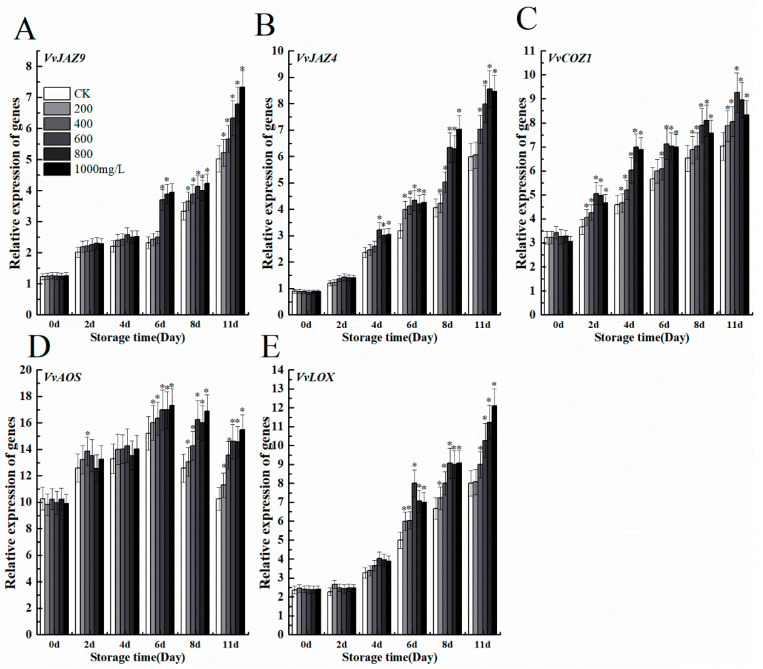
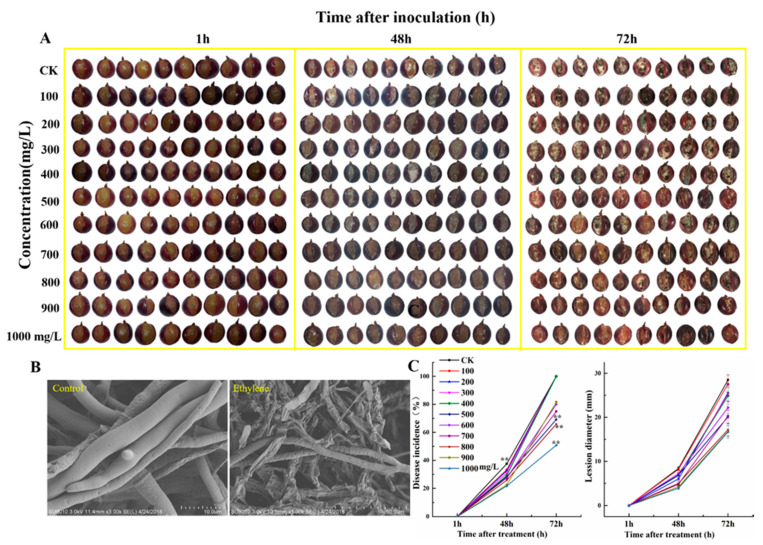
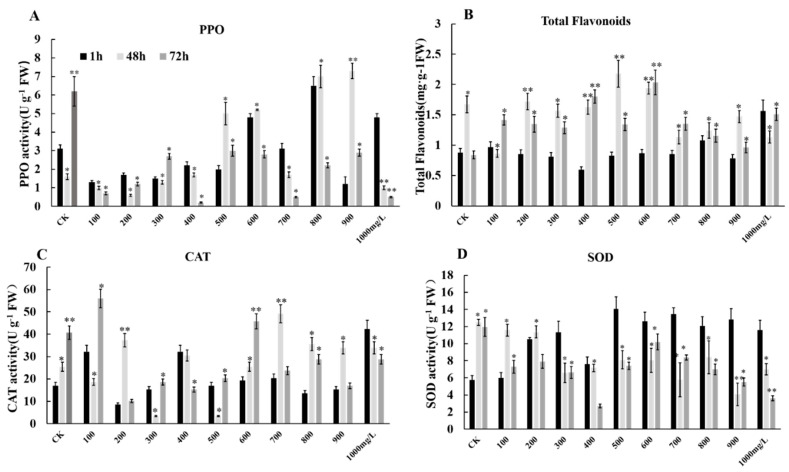
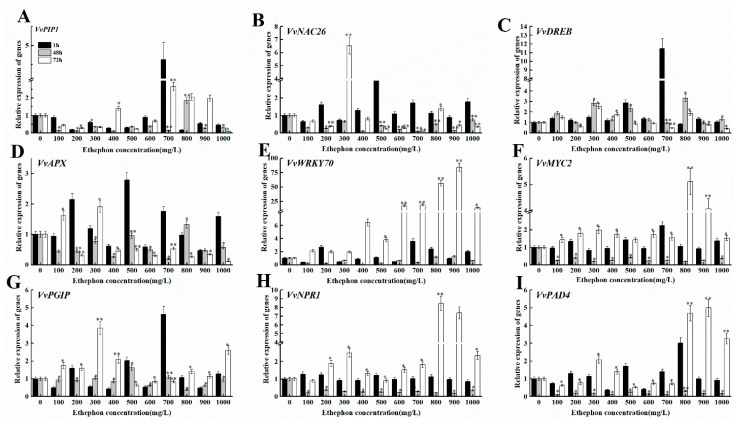
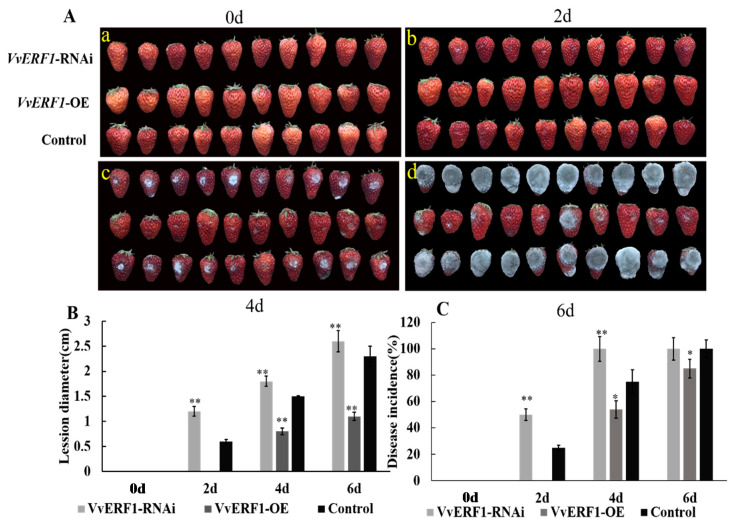
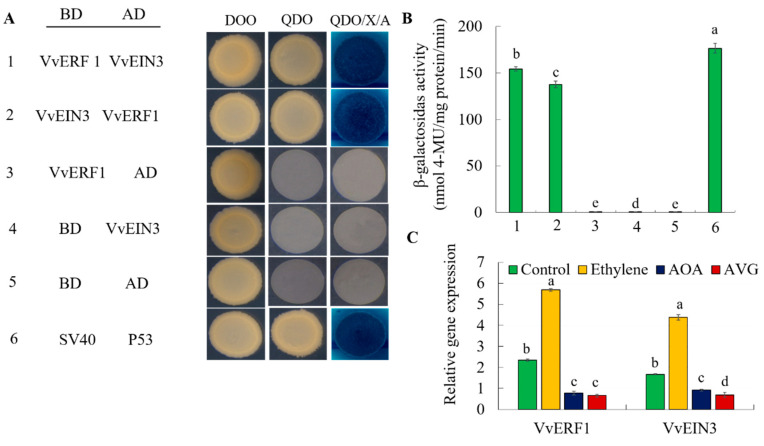
The formation of grape quality and the mechanism of resistance against foreign pathogens affect the storage stability of fruits during post-harvest handling. Ethylene plays a crucial role in regulating the ripeness of fruits and can be used as an exogenous regulator to resist exogenous pathogens. In this study, we used different concentrations of ethephon for treatment of grape fruits before veraison, analyzed the anthocyanin content, soluble solids, titratable acid, and determined fruit firmness and cell wall metabolism-related enzymes during fruit development. Results showed that exogenous ethephon promoted the early coloration of grape fruits and increased the coloring-related genes myeloblastosis A1(MYBA1), myeloblastosis A2(MYBA2), chalcone isomerase (CHI), flavanone 3-hydroxylase (F3H), flavonoid 3'-hydroxylase gene (F3'H), flavonoid 3', 5'hydroxylase (F3'5'H), 3-O-flavonoid glucosyltransferase (UFGT), and glutathione S-transferase (GST), softening related genes Polygalacturonase(PG), pectinate lyases(PL) and Pectin methylesterase( PME, as well as ethylene metabolism pathway-related genes 1-aminocyclopropane-1-carboxylic acid synthase 1(ACS1), 1-aminocyclopropane-1-carboxylic acid oxidase 2 (ACO2), ethylene receptor gene(ETR2), and ethylene-insensitive 3 (EIN3). Ethephon treatment also increased soluble solids and decreased titratable acid in grape fruit. Fruits pretreated with ethephon were inoculated with Botrytis cinerea, which led to resistance in grape fruit through activation of the antioxidant system. The expression levels of disease resistance-related genes including VvPAD4, VvPIP1, VvNAC26, VvDREB, VvAPX, Vvpgip, VvWRKY70, VvMYC2, VvNPR1 also increased in inoculated fruit with pathogen following ethephon pretreatment. Furthermore, we monitored ethylene response factor 1(ERF1) transcription factor, which could interact with protein EIN3 during ethylene signal transduction and mediate fruit resistance against B. cinerea infection. Meanwhile, overexpression of VvERF1 vectorin strawberry fruits reduced the susceptibility to B. cinerea infection. We suggest that ethylene can induce resistance in ripened fruits after B. cinerea infection and provide adequate postharvest care.

Keywords: Botrytis cinerea; VvERF1; ethephon; gene expression; grape.


Conflict of interest statement

The authors declare no conflict of interest.

Figures

Figure 1
Figure 1
Effect of ethephon on coloring and threshing in grape. (A) Morphology of grape clusters. (B) Grape colored index. (C) Falling rate of grape fruit. (D) Changes of anthocyanin content in grape. Ethephon was used in different concentrations (200, 400, 600, 800, and 1000 mg/L) and in a time course experiments (2, 4, 6, 8, and 11 days). Values are means ± SD of five biological replicates. * Significant differences compared with the control (water-treated fruits) at p < 0.05, using Student’s test. d: days.
Figure 2
Figure 2
Effect of ethephon on soluble solids, titratable acidity, firmness, and weight loss rate in grape. (A) Fruit firmness. (B) Fruit soluble solids. (C) Titratable acidity. (D) Weight loss. Ethephon was used in different concentrations (200, 400, 600, 800, and 1000 mg/L) and in a time course experiments (2, 4, 6, 8, and 11 days). Values are means ± SD of five biological replicates. * Significant differences compared with the control (water-treated fruits) sample at p < 0.05.
Figure 3
Figure 3
Effect of ethephon on cell wall metabolism-related enzyme activities in grape. (A) Polygalacturonase (PG) activity. (B) Pectin methylesterase (PME) activity. (C) Pectinesterase (PE) activity. (D) Cellulase activity. Ethephon was used in different concentrations (200, 400, 600, 800, and 1000 mg/L) and in a time course experiments (2, 4, 6, 8, and 11 days). Values are means ± SD of five biological replicates. * Significant differences compared with the control (water-treated fruits) sample at p < 0.05, using Student’s test.
Figure 4
Figure 4
Effect of ethephon on anthocyanin-related genes expression in grape. (A) VvMYBA2, (B) VvGST, (C) VvMYBA1, (D) VvCHS, (E) VvUFGT, (F) VvF3H, (G) VvF3’H, (H) VvF3’5’H, (I) VvCHI. Ethephon was used in different concentrations (200, 400, 600, 800, and 1000 mg/L) and in a time course experiments (2, 4, 6, 8, and 11 days). Values are means ± SD of three biological replicates. * Significant differences compared with the control (water-treated fruits) sample at p < 0.05, ** Significant differences compared with the control (water-treated fruits) sample at p < 0.01 using Student’s test.
Figure 5
Figure 5
Effect of ethephon on ripening-related genes expression in grape. The expression levels of softening-related genes (A) VvPG, (B) VvPL, (C) VvPME, and (D) VvCELL. Aroma synthesis-related gene expression levels of (E) VvQR, (F) VvEcar, and (G) VvEGS. Ethephon was used in different concentrations (200, 400, 600, 800, and 1000 mg/L) and in a time course experiments (2, 4, 6, 8, and 11 d). Values are means ± SD of three biological replicates. * Significant differences compared with the control (water-treated fruits) sample at p < 0.05, ** Significant differences compared with the control (water-treated fruits) sample at p < 0.01 using Student’s test.
Figure 6
Figure 6
Effect of ethephon on ABA and ethylene-related genes expression in grape. ABA metabolism-related gene expression levels of (A) VvNCED1, (B) VvNCED2, (C) VvNCED3, (D) VvBG1, (E) VvBG2, (F) VvBG3, (G) VvCYP707A. Ethylene metabolism-related gene expression levels of (H) VvACS1, (I) VvETR2, (J) VvEIN3 and (K) VvACO2. Ethephon was used in different concentrations (200, 400, 600, 800, and 1000 mg/L) and in a time course experiments (2, 4, 6, 8, and 11 days). Values are means ± SD of five biological replicates. * Significant differences compared with the control (water-treated fruits) sample at p < 0.05, ** Significant differences compared with the control (water-treated fruits) sample at p < 0.01 using Student’s test.
Figure 7
Figure 7
Effect of ethephon on auxin metabolism-related gene expression levels of (A) VvINS1, (B) VvPIN1, (C) VvTAA1 and (D) VvYUCCA. Brassinolide metabolism-related gene expression levels of (E) VvBR6OX1 and (F) VvDWF1. Ethephon was used in different concentrations (200, 400, 600, 800, and 1000 mg/L) and in time course experiments (2, 4, 6, 8, and 11 days). Values are means ± SD of five biological replicates. * Significant differences compared with the control (water-treated fruits) sample at p < 0.05, ** Significant differences compared with the control (water-treated fruits) sample at p < 0.01 using Student’s test.
Figure 8
Figure 8
Effect of ethephon on JA-related genes expression in grape. JA metabolism-related gene expression levels of (A) VvJAZ9, (B) VvJAZ4, (C) VvCOZ1, (D) VvAOS, and (E) VvLOX. Ethephon was used in different concentrations (200, 400, 600, 800, and 1000 mg/L) and in time course experiments (2, 4, 6, 8, and 11 days). Values are means ± SD of five biological replicates. * Significant differences compared with the control (water-treated fruits) sample at p < 0.05, using Student’s test.
Figure 9
Figure 9
Effects of different concentrations of ethephon pretreatment on the infected grape with B. cinerea. (A) The development of B. cinerea on the surface of ‘Kyoho’ grape fruits in pretreated samples with different concentrations of ethephon treatment (100, 200, 300, 400, 500, 600, 700, 800, 900, 1000 mg/L) for 24 h and then inoculation with B. cinerea. Samples were monitored at 1, 48, and 72 h after botrytis infection. (B) The B. cinerea mycelium grew on the surface of the grape fruit and was observed by electron microscope at 72 h. (C) Fruit disease incidence and lesion diameter changes were calculated. Values are means ± SD of twenty biological replicates. ** Significant differences compared with the control (water-treated fruits) sample at p < 0.01, using Student’s test.
Figure 10
Figure 10
Effects of different concentrations of ethephon treatment on the total flavonoids and antioxidant enzymes. Different concentration of ethephon (100, 200, 300, 400, 500, 600, 700, 800, 900, and 1000 mg/L) were sprayed on the fruit surface for 24 h, and then B. cinerea was inoculated on the grape. Samples were collected at 1, 48, and 72 h after botrytis infection and measured (A) PPO activity, (B) total flavonoid content, (C) SOD activity and (D) CAT activity. Values are means ± SD of five biological replicates. * Significant differences compared with the control (water-treated fruits) sample at p < 0.05, ** Significant differences compared with the control (water-treated fruits) sample at p < 0.01 using Student’s test.
Figure 11
Figure 11
Effects of different concentrations of ethephon treatment on genes expression of disease resistance in mature grape fruit. Different concentration of ethephon (100, 200, 300, 400, 500, 600, 700, 800, 900, and 1000 mg/L) were sprayed on the fruit surface for 24 h, and then B. cinerea was inoculated on the grape. Samples were collected at 1, 48, and 72 h after botrytis infection and the transcript levels of disease resistant genes including (A) VvPIP1, (B) VvNAC26, (C) VvDREB, (D) VvAPX, (E) VvWRKY70, (F) VvMYC2, (G) Vvpgip, (H) VvNPR1, and (I) VvPAD4. Values are means ± SD of five biological replicates. * and ** Significant differences compared with the control (water-treated fruits) sample at p < 0.05 and p < 0.01, respectively using Student’s test.
Figure 12
Figure 12
Effects of VvERF1 on strawberry fruit with transient expressions of VvERF1-OE, VvERF1-RNAi. (A) Strawberry fruit was inoculated with B. cinerea and sampled at 0, 2, 4, and 6 d. (B) Disease incidence. (C) Disease lesion diameter. Values are means ± SD of five biological replicates. * and ** Significant differences compared with the control (water-treated fruits) sample at p < 0.05 and p < 0.01, respectively using Student’s test, d: day.
Figure 13
Figure 13
Yeast two-hybrid system for VvERF1 and VvEIN3. (A) VvERF1 fragments were ligated into the pGBKT7 vector (binding domain (BD)) and VvEIN3 into the pGADT7 vector (activation domain (AD)). DDO, SD medium lacking Trp/Leu; QDO, SD medium lacking Trp/Leu/His/Ade; X-a-gal, QDO medium containing x-a-gal and AbA. The SV40 and P53 genes were used as the positive control, and AD and BD vectors were as the negative control. Blue plaques indicate interaction between two proteins. (B) β-galactosidase activity was quantified from the sample in (A). (C) Inhibitors of ethylene biosynthesis like Aminoetoxyvinylglycine (AVG) and aminoxyacetic acid (AOA) were sprayed on the grape fruit surface respectively, and the expression levels of VvERF1 and VvEIN3 genes were measured after 3 days in grape fruits. Values are means ± SD of three biological replicates. Different letters indicated a statistical difference at p < 0.05 as determined by Student’s test.

References

    1. Jia H., Zhang C., Pervaiz T., Zhao P., Liu Z., Wang B., Wang C., Zhang L., Fang J., Qian J. Jasmonic acid involves in grape fruit ripening and resistant against Botrytis cinerea. Funct. Integr. Genom. 2016;16:79–94. doi: 10.1007/s10142-015-0468-6. - DOI - PubMed
    1. Jia H., Xie Z., Wang C., Shangguan L., Qian N., Cui M., Liu Z., Zheng T., Wang M., Fang J. Abscisic acid, sucrose, and auxin coordinately regulate berry ripening process of the Fujiminori grape. Funct. Integr. Genom. 2017;17:441–457. doi: 10.1007/s10142-017-0546-z. - DOI - PubMed
    1. Gabler F.M., Smilanick J.L., Mansour M., Ramming D.W., Mackey B.E. Correlations of morphological, anatomical, and chemical features of grape berries with resistance to Botrytis cinerea. Phytopathology. 2003;93:1263–1273. doi: 10.1094/PHYTO.2003.93.10.1263. - DOI - PubMed
    1. Cappellini R.A., Ceponis M.J., Lightner G.W. Disorders in table grape shipments to the New-York market, 1972–1984. Plant Dis. 1986;70:1075–1079. doi: 10.1094/PD-70-1075. - DOI
    1. Stewart E.R., Freebairn H.T. Ethylene, seed germination, and epinasty. Plant Physiol. 1969;44:955–958. doi: 10.1104/pp.44.7.955. - DOI - PMC - PubMed