. 2020 Jul 7;21(13):4807.
doi: 10.3390/ijms21134807.

Implications of SARS-CoV-2 Mutations for Genomic RNA Structure and Host microRNA Targeting

Affiliations

Implications of SARS-CoV-2 Mutations for Genomic RNA Structure and Host microRNA Targeting

Ali Hosseini Rad Sm et al. Int J Mol Sci. .

Abstract

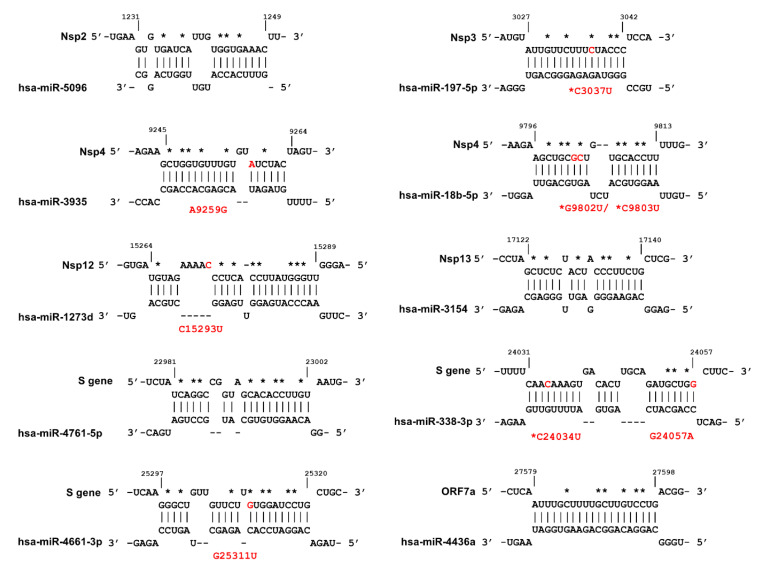
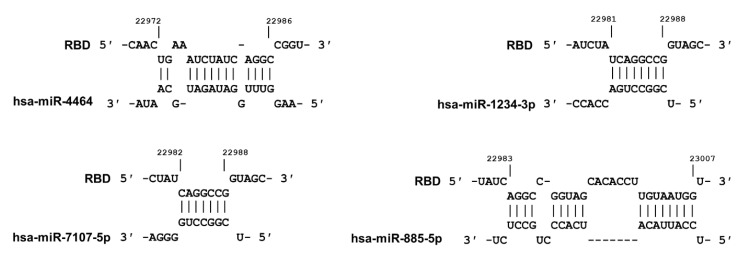
The SARS-CoV-2 virus is a recently-emerged zoonotic pathogen already well adapted to transmission and replication in humans. Although the mutation rate is limited, recently introduced mutations in SARS-CoV-2 have the potential to alter viral fitness. In addition to amino acid changes, mutations could affect RNA secondary structure critical to viral life cycle, or interfere with sequences targeted by host miRNAs. We have analysed subsets of genomes from SARS-CoV-2 isolates from around the globe and show that several mutations introduce changes in Watson-Crick pairing, with resultant changes in predicted secondary structure. Filtering to targets matching miRNAs expressed in SARS-CoV-2-permissive host cells, we identified ten separate target sequences in the SARS-CoV-2 genome; three of these targets have been lost through conserved mutations. A genomic site targeted by the highly abundant miR-197-5p, overexpressed in patients with cardiovascular disease, is lost by a conserved mutation. Our results are compatible with a model that SARS-CoV-2 replication within the human host is constrained by host miRNA defences. The impact of these and further mutations on secondary structures, miRNA targets or potential splice sites offers a new context in which to view future SARS-CoV-2 evolution, and a potential platform for engineering conditional attenuation to vaccine development, as well as providing a better understanding of viral tropism and pathogenesis.

Keywords: RNA secondary structure; SARS-CoV-2; conserved mutation; miRNA.


Conflict of interest statement

The authors declare no conflict of interest.

Figures

Figure 1
Figure 1
The ratio of SARS-CoV-2 nonsynonymous to synonymous mutations obtained from the Observable notebook (sequencing data available up to June 12, 2020).
Figure 2
Figure 2
The impact of C1059U mutation on local RNA secondary structure of Nsp2. (A) RNA secondary structures of Nsp2 wild type (MFE structure: −146.10 kcal/mol—centroid structure: −132.30 kcal/mol) and 1059 mutation (MFE structure: −147.20 kcal/mol—centroid structure: −137.80 kcal/mol) using RNAfold tool. (B) The base pair probabilities by circular plots with higher base pairing potential is reflected in darker hues of grey lines and the mutated position highlighted by red arrow (MutaRNA). (C) The dot plot shows the differences of the base pairing probabilities of 1059 mutation vs. wild type RNA, Pr(bp in WT)—Pr(bp in mut). The base pairs weakened by the 1059 mutation are in blue, while higher base pair probability in the mutant is depicted in red. The mutated position is highlighted by red dotted lines (P values based on RNAsnp are as follows: mode-1 = 0.2617, mode-2 = 0.3344). (D) The accessibility profiles of wild type (green line) and the mutation (yellow line) and their differences provide an assessment of the mutation effect on the RNA single-strandedness, which may relate to its interaction potential with other RNAs or proteins. Accessibility is measured in terms of local single-position unpaired probabilities and is plotted as WT—Mut, whereby a negative value indicates increased accessibility caused by the mutation [45]. The mutated position is highlighted by a red line.
Figure 3
Figure 3
The impact of G29742U mutation on the 3′ UTR. (A) The RNA secondary structures of wild type 3′ UTR (MFE structure: −36.90 kcal/mol—centroid structure: −30.50 kcal/mol) and 29,742 mutation (MFE structure: −40.30 kcal/mol—centroid structure: −30.30 kcal/mol) using RNAfold tool. Note the change in predicted secondary structure of 3′ UTR RNA through the 29742 mutation. The s2m regions are highlighted by red rectangles. (B) The base pair probabilities of global fold of Nsp2 RNA demonstrated by circular plots, with higher base pairing potential reflected in darker hues of graduated grey lines. The original and mutated nucleotides are highlighted by red arrows (MutaRNA). (C) The dot plot shows the differences of the base pairing probabilities of the 29,742 mutation vs. wild type RNA, Pr(bp in WT)—Pr(bp in mut). The base pairs weakened by the mutation are in blue while higher base pair probability in the mutant is depicted in red. The mutated position is highlighted by red dotted lines (P values based on RNAsnp are as follows: mode-1 = 0.6204, mode-2 = 0.6638). (D) The accessibility profiles of wild type (green line) and mutation (yellow line) and their differences provide an assessment of the effect of the mutation on the RNA single-strandedness. Accessibility is measured in terms of local single-position unpaired probabilities and is plotted as WT—Mut, whereby a negative value indicates increased accessibility caused by the mutation [45]. The mutated position is highlighted by a red line.
Figure 4
Figure 4
(A) Identification of host miRNA targeting different regions of SARS-CoV-2 genome. (B) The relative expression level of candidate miRNA in different human tissues. Data was obtained from the IMOTA database. Darker blue indicates the higher expression. Grey colour shows undetectable expression in those tissues. The plotted presentations of miRNA expression in different human tissues obtained from TissueAtlas and TISSUES databases are available in the supplementary figure file.
Figure 5
Figure 5
Prediction of host miRNAs binding sites within different regions of SARS-CoV-2 genome. The mutations that occur in miRNA binding sites are indicated in red, and the designations of the mutations are shown in red font. Conserved mutations are indicated with red asterisks while the nucleotide substitutions that result in significant effect on MBS are shown with black asterisks. The figure was produced using IntaRNA tool.
Figure 6
Figure 6
Identification of four miRNAs with ability to bind to the RBD within the S gene. Although not expressed in target cells, these potential miRNAs are included due to their potential use in miRNA-mediated attenuation of the SARS-CoV-2 [37,38].

References

    1. Totura A.L., Baric R.S. SARS coronavirus pathogenesis: Host innate immune responses and viral antagonism of interferon. Curr. Opin. Virol. 2012;2:264–275. doi: 10.1016/j.coviro.2012.04.004. - DOI - PMC - PubMed
    1. Tort F.L., Castells M., Cristina J. A comprehensive analysis of genome composition and codon usage patterns of emerging coronaviruses. Virus Res. 2020;283:197976. doi: 10.1016/j.virusres.2020.197976. - DOI - PMC - PubMed
    1. MacLean O.A., Orton R.J., Singer J.B., Robertson D.L. No evidence for distinct types in the evolution of SARS-CoV-2. Virus Evol. 2020;6:veaa034. doi: 10.1093/ve/veaa034. - DOI - PMC - PubMed
    1. van Dorp L., Richard D., Tan C.C., Shaw L.P., Acman M., Balloux F. No evidence for increased transmissibility from recurrent mutations in SARS-CoV-2. bioRxiv. 2020 - PMC - PubMed
    1. Zhang L., Jackson C.B., Mou H., Ojha A., Rangarajan E.S., Izard T., Farzan M., Choe H. The D614G mutation in the SARS-CoV-2 spike protein reduces S1 shedding and increases infectivity. bioRxiv. 2020 doi: 10.1101/2020.06.12.148726. - DOI

MeSH terms

LinkOut - more resources