

Sweetened beverage taxes and changes in beverage price, imports and manufacturing: interrupted time series analysis in a middle-income country
- PMID: 32646500
- PMCID: PMC7350205
- DOI: 10.1186/s12966-020-00980-1
Sweetened beverage taxes and changes in beverage price, imports and manufacturing: interrupted time series analysis in a middle-income country
Abstract
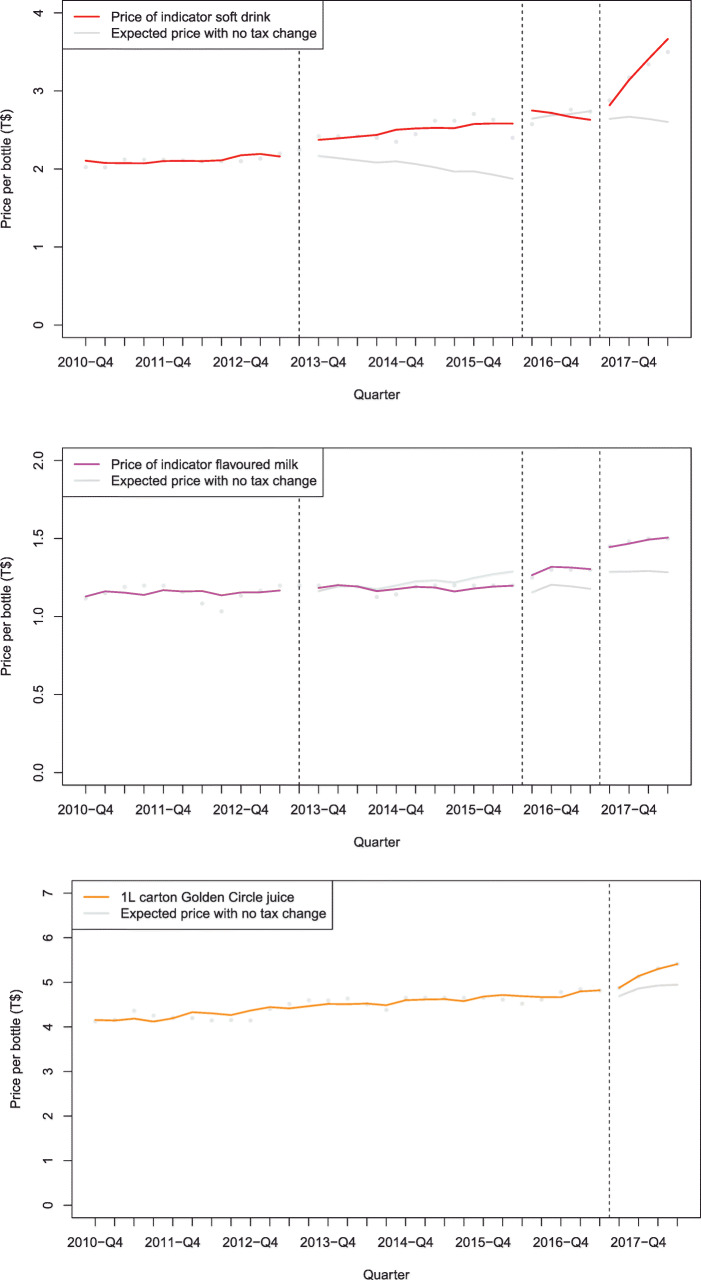
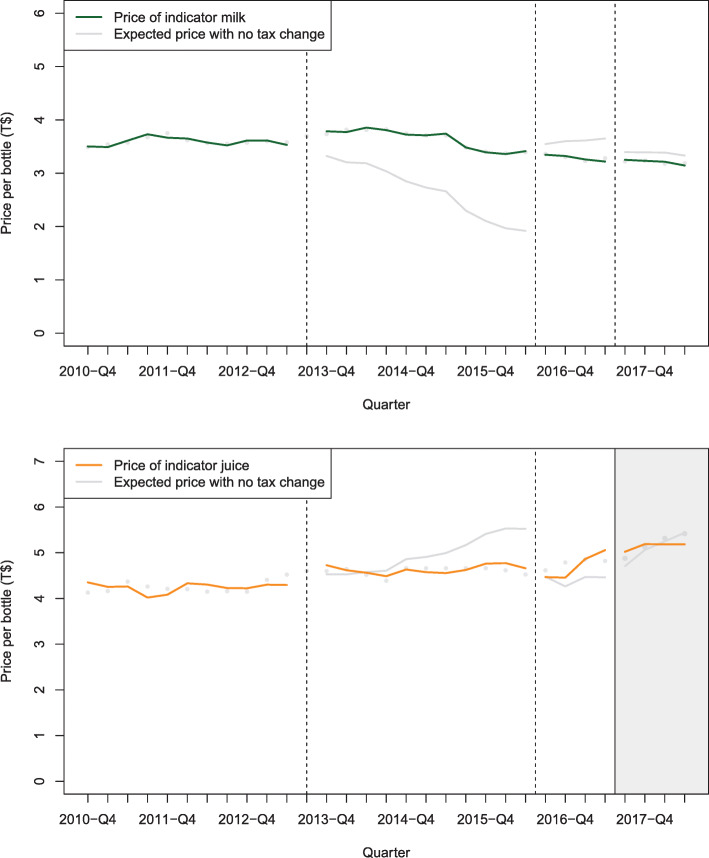
Background: The Pacific Island nation of Tonga (a middle-income country) introduced a sweetened beverage tax of T$0.50/L in 2013, with this increasing further in 2016 (to T$1.00/L), and in 2017 (T$1.50/L; US$0.02/oz). Given the potential importance of such types of fiscal intervention for preventing chronic disease, we aimed to evaluate the impact of these tax changes in Tonga.
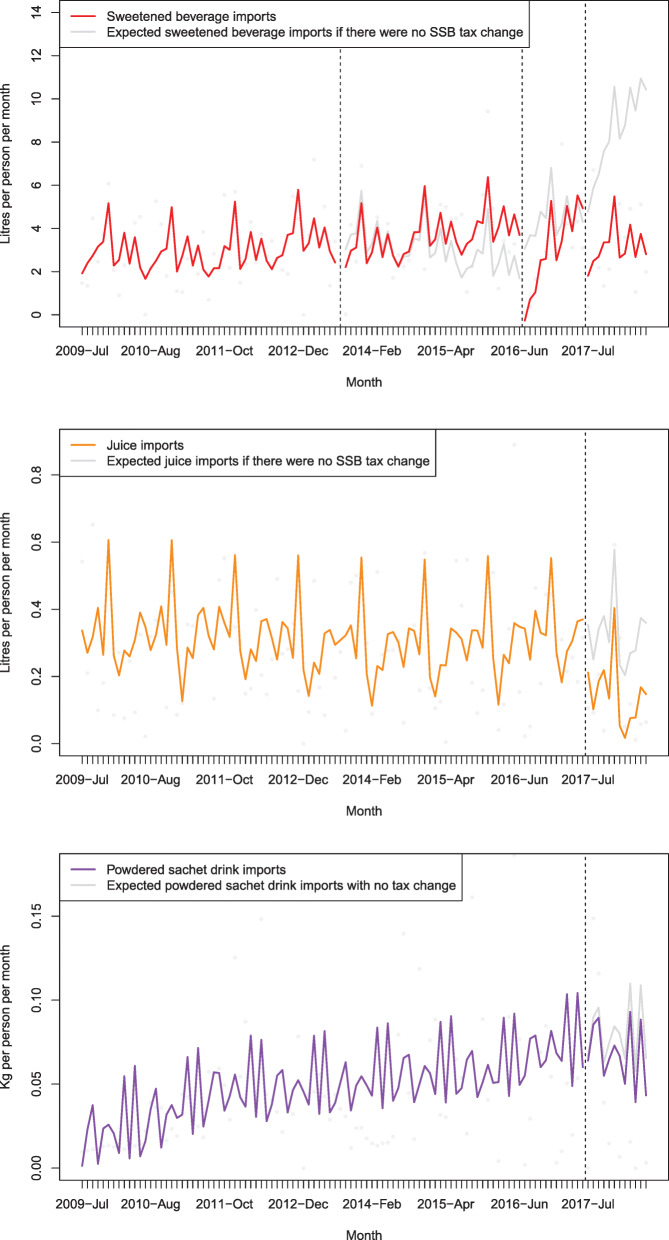
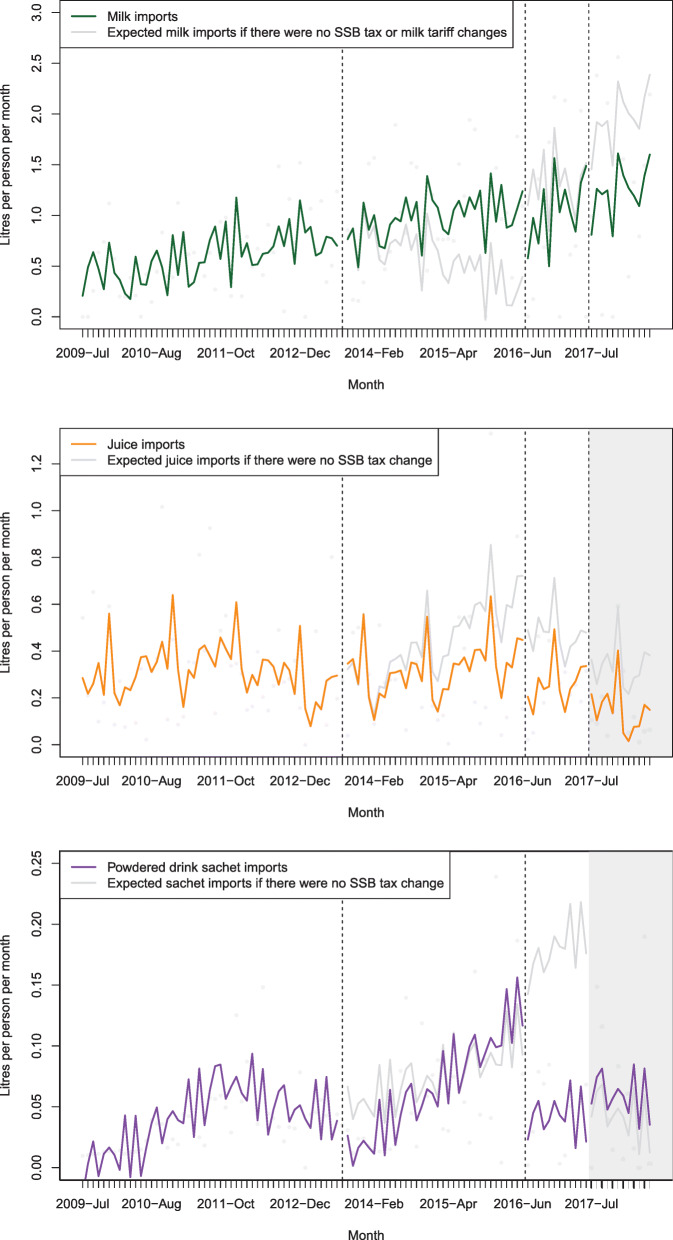
Methods: Interrupted time series analysis was used to examine monthly import volumes and quarterly price and manufacturing 1 year after each tax change, compared with a counterfactual based on existing trends. Autocorrelation was adjusted for when present, and adjustments were made for changes in GDP per capita, visitor numbers, season and T$/US$ exchange rate.
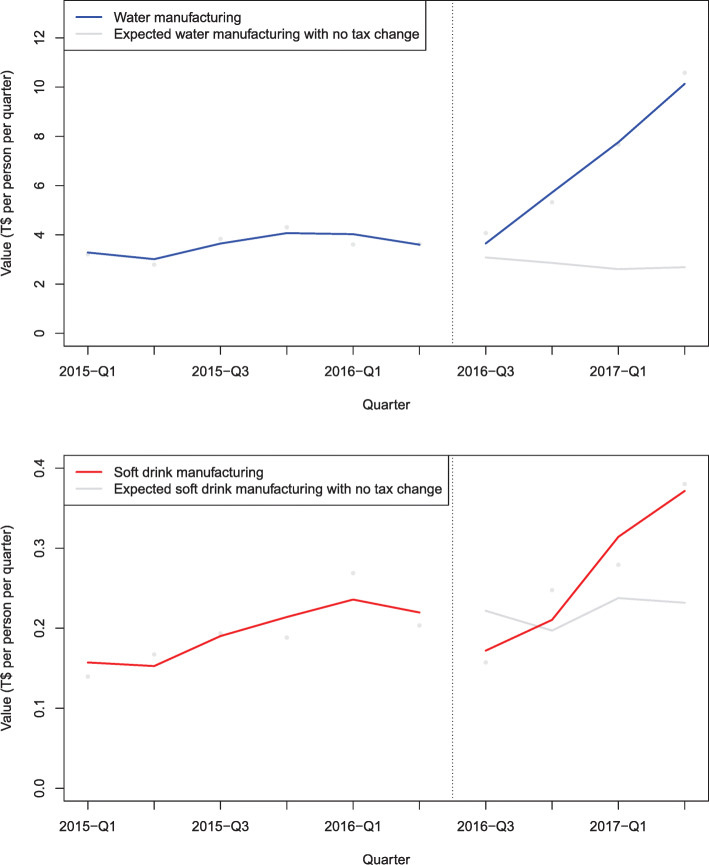
Results: In the year after the 2013, 2016 and 2017 tax increases, the price of an indicator soft drink increased by 16.8% (95%CI: 6.3 to 29.6), 3.7% (- 0.6 to 8.3) and 17.6% (6.0 to 32.0) respectively. Imports of sweetened beverages decreased with changes of - 10.4% (- 23.6 to 9.0), - 30.3% (- 38.8 to - 20.5) and - 62.5% (- 73.1 to - 43.4) respectively. Juice imports changed by - 54.2% (- 93.2 to - 1.1), and sachet drinks by - 15.5% (- 67.8 to 88.3) after the 2017 tax increase. Tonga water bottling (T$) increased in value by 143% (69 to 334) after the 2016 tax increase and soft drink manufacturing increased by 20% (2 to 46, albeit 5% market share).
Conclusions: Consistent with international evaluations of sugar-sweetened beverage taxes, the taxes in Tonga were associated with increased prices, decreased taxed beverages imports, and increased locally bottled water.
Keywords: Evaluation; Natural experiment; Pacific; Quasi experiment; Soft drink; Sugar-sweetened beverages; Sugary drinks; Taxes; Time-series; Tonga; Trade.
Conflict of interest statement
The authors declare that they have no competing interests.
Figures
Similar articles
-
Impact of sugar-sweetened beverage taxes on price, import and sale volumes in an island: interrupted time series analysis.Public Health Nutr. 2021 May;24(7):1828-1835. doi: 10.1017/S1368980021000185. Epub 2021 Jan 18. Public Health Nutr. 2021. PMID: 33455614 Free PMC article.
-
Association of a Sweetened Beverage Tax With Purchases of Beverages and High-Sugar Foods at Independent Stores in Philadelphia.JAMA Netw Open. 2021 Jun 1;4(6):e2113527. doi: 10.1001/jamanetworkopen.2021.13527. JAMA Netw Open. 2021. PMID: 34129022 Free PMC article.
-
Association of a Beverage Tax on Sugar-Sweetened and Artificially Sweetened Beverages With Changes in Beverage Prices and Sales at Chain Retailers in a Large Urban Setting.JAMA. 2019 May 14;321(18):1799-1810. doi: 10.1001/jama.2019.4249. JAMA. 2019. PMID: 32930704
-
Progress in the Pacific on sugar-sweetened beverage taxes: a systematic review of policy changes from 2000 to 2019.Aust N Z J Public Health. 2021 Aug;45(4):376-384. doi: 10.1111/1753-6405.13123. Epub 2021 Jun 7. Aust N Z J Public Health. 2021. PMID: 34097355
-
Impact of sugar-sweetened beverage taxes on purchases and dietary intake: Systematic review and meta-analysis.Obes Rev. 2019 Sep;20(9):1187-1204. doi: 10.1111/obr.12868. Epub 2019 Jun 19. Obes Rev. 2019. PMID: 31218808 Free PMC article.
Cited by
-
Impact of sugar-sweetened beverage taxes on price, import and sale volumes in an island: interrupted time series analysis.Public Health Nutr. 2021 May;24(7):1828-1835. doi: 10.1017/S1368980021000185. Epub 2021 Jan 18. Public Health Nutr. 2021. PMID: 33455614 Free PMC article.
-
Food environments in the Pacific region and efforts to improve them: a scoping review.Public Health Nutr. 2024 Nov 26;28(1):e5. doi: 10.1017/S1368980024002350. Public Health Nutr. 2024. PMID: 39587426 Free PMC article.
-
Sugar, power and policy: The political economy of a health and economic 'win-win' in Fiji's sugar-sweetened beverage tax.Global Health. 2025 Aug 4;21(1):43. doi: 10.1186/s12992-025-01139-y. Global Health. 2025. PMID: 40759972 Free PMC article.
-
Effectiveness of implemented global dietary interventions: a scoping review of fiscal policies.BMC Public Health. 2024 Sep 19;24(1):2552. doi: 10.1186/s12889-024-19988-4. BMC Public Health. 2024. PMID: 39300446 Free PMC article.
-
Equity of expenditure changes associated with a sweetened-beverage tax in Tonga: repeated cross-sectional household surveys.BMC Public Health. 2021 Jan 18;21(1):149. doi: 10.1186/s12889-020-10139-z. BMC Public Health. 2021. PMID: 33461511 Free PMC article.
References
-
- The Pacific Monitoring Alliance for Non-communicable disease Action (Pacific MANA) Coordination team, Pacific Community (SPC). Status of NCD policy and legislation in Pacific Island Countries and Territories, 2018. (The Pacific Monitoring Alliance for Non-communicable disease Action (Pacific MANA) ed. pp. 1–35). Noumea: Pacific Community; 2019. p. 1–35.
-
- World Bank, editor. Using taxation to address noncommunicable diseases lessons from Tonga. (World Bank ed. pp. 1–127) Washington DC: Food and Agriculture Organization of the United Nations, TongaHealth, Australian Aid, New Zealand Foreign Affairs and Trade Aid Programme, Government of Japan; 2019. pp. 1–127.
Publication types
MeSH terms
LinkOut - more resources
Full Text Sources
