Case Reports
. 2020 Jul 10;5(49):eabc3979.
doi: 10.1126/sciimmunol.abc3979.

The cytoskeletal regulator HEM1 governs B cell development and prevents autoimmunity

Affiliations
Case Reports

The cytoskeletal regulator HEM1 governs B cell development and prevents autoimmunity

Elisabeth Salzer et al. Sci Immunol. .

Abstract

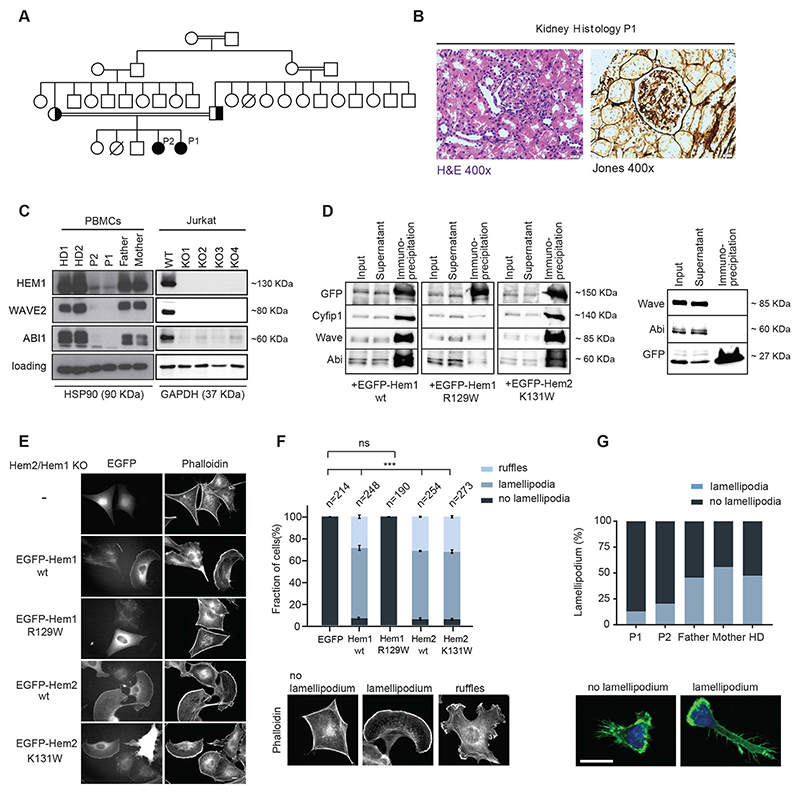
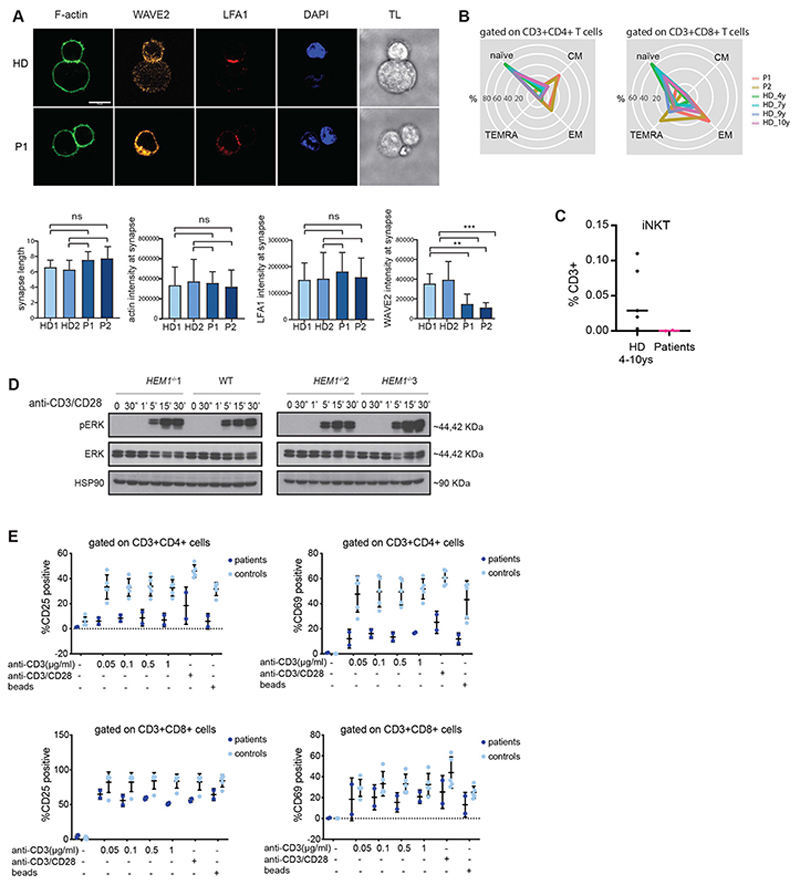
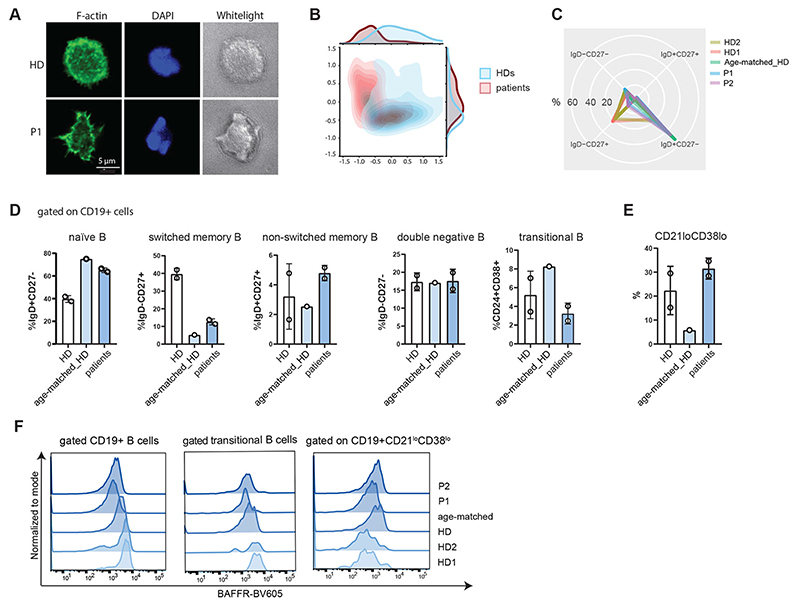
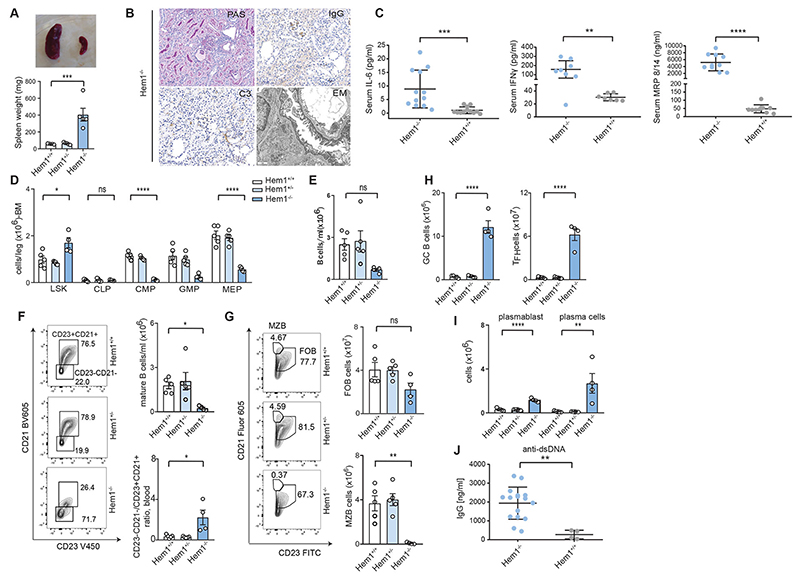
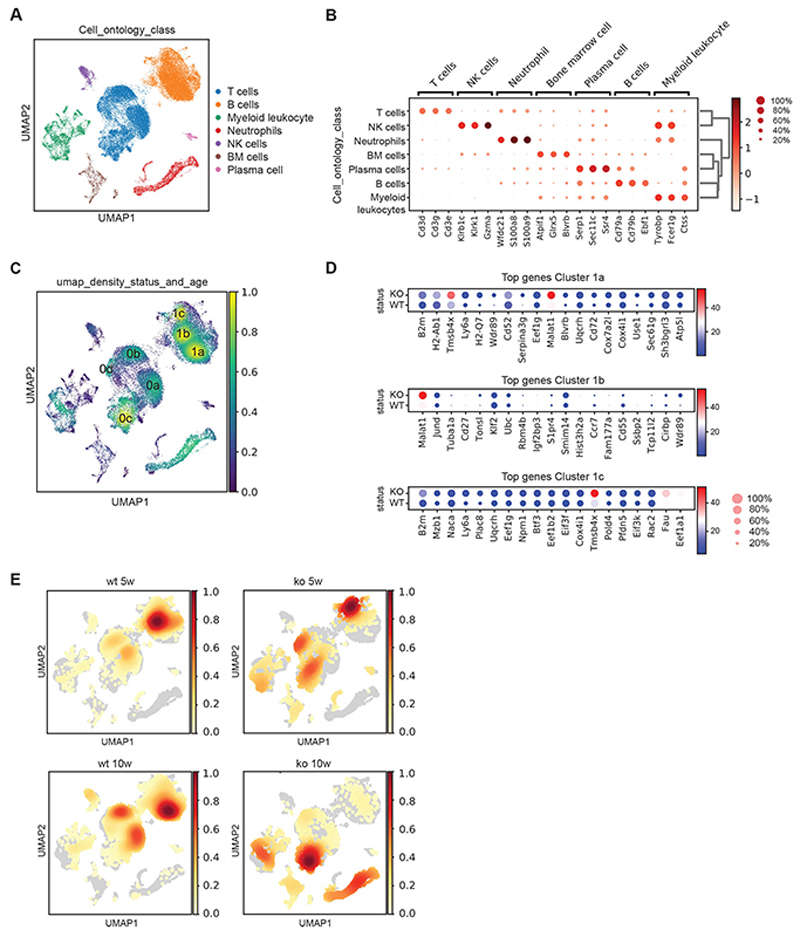
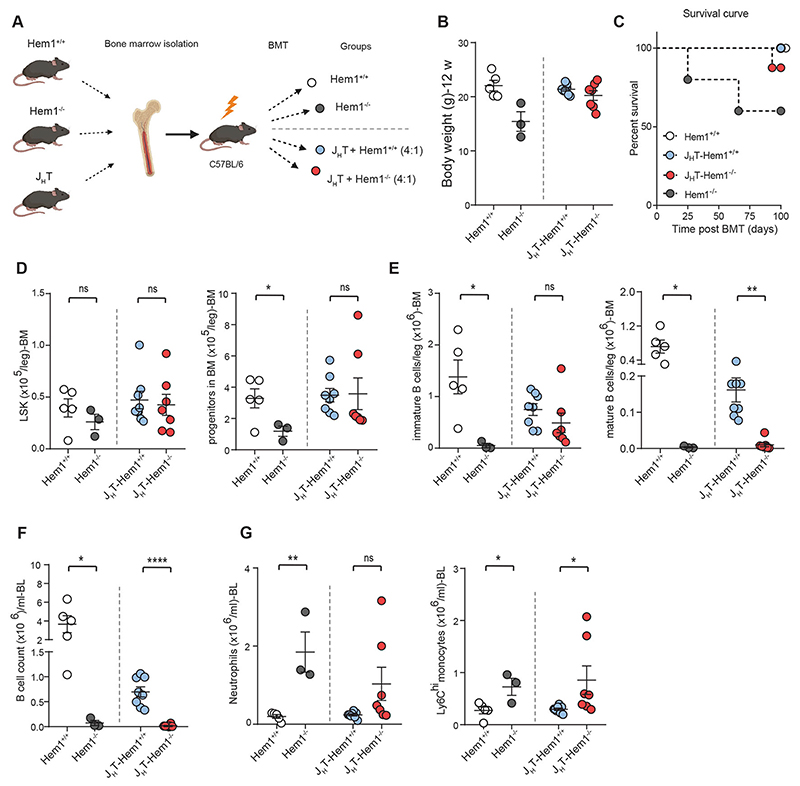
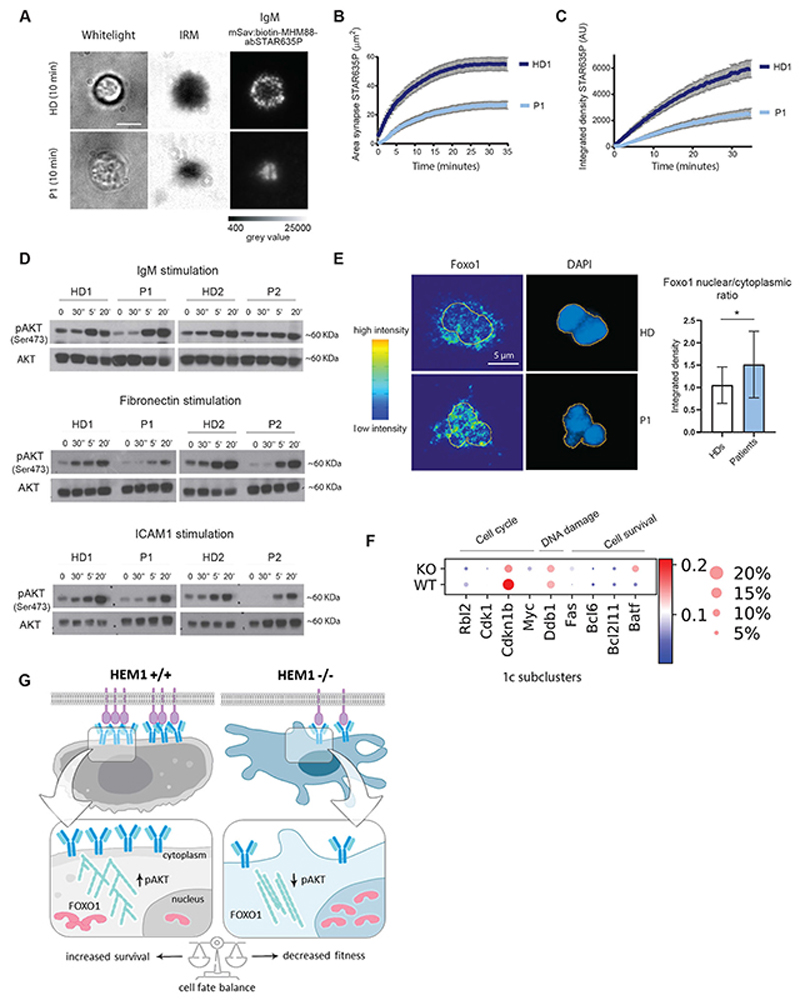
The WAVE regulatory complex (WRC) is crucial for assembly of the peripheral branched actin network constituting one of the main drivers of eukaryotic cell migration. Here, we uncover an essential role of the hematopoietic-specific WRC component HEM1 for immune cell development. Germline-encoded HEM1 deficiency underlies an inborn error of immunity with systemic autoimmunity, at cellular level marked by WRC destabilization, reduced filamentous actin, and failure to assemble lamellipodia. Hem1-/- mice display systemic autoimmunity, phenocopying the human disease. In the absence of Hem1, B cells become deprived of extracellular stimuli necessary to maintain the strength of B cell receptor signaling at a level permissive for survival of non-autoreactive B cells. This shifts the balance of B cell fate choices toward autoreactive B cells and thus autoimmunity.


Conflict of interest statement

Competing interests: The authors declare no competing financial interests. Correspondence and requests for materials should be addressed to kaan.boztug@ccri.at.

Figures

Fig. 1
Fig. 1. HEM1 deficiency results in aberrant cell morphology and defective lamellipodia formation in HEMl-deficient patients.
(A) Pedigree of the index family: double lines indicate consanguinity; black filling indicates the index patients; diagonal lines indicate deceased siblings. (B) Image of hematoxylin/eosin staining showing capillary proliferation and polymorphonuclear neutrophils in glomeruli, magnification 400x (left); Periodic Acid Schiff (PAS) staining showing mild mesangial expansion, 400x (right), consistent with Lupus nephritis, class III, active. (C) Cropped immunoblot analysis of HEM1, WAVE2, ABI1, GAPDH or HSP90 (heat shock protein 90) in peripheral blood mononuclear cells (PBMCs) of healthy donor (HD), patients (P1, P2), their parents (left) and in CRISPR/Cas9 HEM1 knock-out Jurkat T cells (right). (D) Co-immunoprecipitation of endogenous WRC subunits with ectopically expressed EGFP-tagged proteins (indicated at the bottom) in wildtype B16-F1 cells. EGFP alone was used as control (right panel). (E) Hem2/Hem1 knock-out B16-F1 clone #8 was transfected with indicated EGFP-tagged constructs. The panels display respective phalloidin stainings. Scale bar represents 10 μm. (F) Quantification of lamellipodia/ruffle formation as indicated by the color shading shows fraction of cells in % ± SEM from three independent experiments. n equals number of transfected cells analyzed. Bottom: Representative examples of cell morphologies used for cell categorization. (G) Representative images (bottom) and quantification (top) of expanded T cells spreading on fibronectin-coated surfaces stained with phalloidin and DAPI and imaged with a Zeiss LSM700 confocal microscope and a 63x oilimmersion objective. Scale bar, 10 μm.
Fig. 2
Fig. 2. Impaired T-cell function in HEM1 deficiency.
(A) Representative images of immune conjugate formation in healthy donor (upper row) and patient (lower row) expanded CD8+ T cells with anti-CD3 coated P815 target cells stained with WAVE2 (orange), phalloidin (green), DAPI (blue) and LFA-1 (red), from left to right, respectively. Scale bar, 10 μm. Below: quantifications of synapse features including synapse length, F-actin, LFA-1 and WAVE2 intensities at the synapse area in both patients (P1 and P2) and two healthy donors (HD1 and HD2) TL, transmission light. (B) Radar plots showing the distribution of main T cell subpopulations of CD4+ and CD8+ T cells (naïve, central memory [CM], effector memory [EM], effector memory re-expressing CD45RA [TEMRA]) in both patients and age-matched controls. Age-matched controls are for easier illustration and comparison. Age-dependent reference values for these subsets have been published earlier (for details see Supplementary Table 4). (C) Quantification plot based on immunophenotyping data of patient iNKT cells (CD3+TCR-Vβ11+, TCRVα24+) in P1, P2, and 4 different age-matched and one adult healthy donors. (D) ERK phosphorylation in CRISPR/Cas9 HEM1 knock-out Jurkat T cells, stimulated with anti-CD3 (OKT3)/anti-CD28 for different time points. (E) Percentages of CD25- and CD69-positive cells upon stimulation with different concentrations of anti-CD3, anti-CD28 and stimulatory beads in CD4+ and CD8+ T-cell populations from both patients and 2 healthy controls.
Fig. 3
Fig. 3. Aberrant B-cell phenotype in HEM1 deficiency.
(A) Representative images and of magnetic-activated cell sorting (MACS)-sorted B cells spreading on IgM-coated surfaces stained with phalloidin and DAPI and imaged with a Zeiss LSM700 confocal microscope and a 63x oil-immersion objective. Scale bar, 5 μm. TL, transmission light (B) Principal component analysis of cell morphology parameters extracted from immunofluorescence images using CellProfiler™. Patient (blue contour) and healthy donor (red contour) B cells can be distinguished on the basis of these parameters (list of parameters in Supplementary Table 5). (C) Radar plot showing the distribution of naïve, memory and double negative B cell subpopulations among the patients and healthy controls. (D) B-cell immunophenotyping showing relative proportions of naïve (IgD+CD27-), memory non-switched (IgD+CD27+) and memory-switched (IgD-CD27+), (IgD-CD27-) double negative B cells, relative proportions of transitional (CD19+CD24+CD38+) and (E) memory-like (CD19+CD27-IgD+CD21lowCD38low) B cells (gating strategy as outlined in Supplementary Figure 3A). (F) Expression of BAFFR (BV605) on the surface of CD19+, transitional and CD21lowCD38lowB cells of P1, P2, age-matched and adult healthy donors (gating strategy as explained in Figure S3A).
Fig. 4
Fig. 4. Hem1-/- mice replicate aberrant B-cell development and autoantibody generation.
(A) Representative image and comparison of spleen size of the Hem1-/- vs. Hem1+/+ mice. (B) Immunohistochemistry and electron microscopy of kidneys from Hem1-/- mice illustrating severe systemic autoimmunity by glomerulonephritis (mesangial enlargement, hypercellularity and sclerosis and C3 deposits). (C) IL-6, IFNg and MRP8/14 cytokine levels in Hem1+/+ and Hem1-/- mice. Each dot represents one mouse. (D) LSK (Lin-Sca1+Kit-) stem cells in the bone marrow of Hem1+/+, Hem1+/- or Hem1-/- mice. (E) Quantification of total blood B cells (B220). (F) Quantification of mature blood B cells (CD21+CD23+) (top, right) and ratio of mature (CD21+CD23+) and immature B cells (CD21low CD23-) of Hem1+/+, Hem1+/+ or Hem1-/- mice in blood (bottom, right); representative FACS plots (left). (G) Representative flow cytometry plots of marginal zone (B220+CD21hiCD23-) and follicular (B220+CD21intCD23+) B cells in the spleen of Hem1+/+, Hem1+/- or Hem1-/- mice (left), quantification (right). (H) Representative flow cytometry quantification of splenic GL-7hi germinal center B cells in Hem1+/+, Hem1+/- or knockout Hem1-/- mice. Representative flow cytometry quantification of T-follicular helper cells (CD3+CD4+PD1+CXCR5+). (I) Quantification of representative flow cytometry plots along with the enumeration of splenic plasmablast (CD138+, B220+) and plasma cell (CD138+B220-) counts in Hem1+/+, Hem1+/- or Hem1-/- mice. (J) Anti-dsDNA-specific serum IgG titers of Hem1+/+, and Hem1-/- mice quantified by ELISA. FITC, fluorescein isothiocyanate; CLP, common lymphoid progenitor; CMP, common myeloid progenitor; MEP, megakaryocyte-erythroid progenitor; GMP, granulocyte-macrophage progenitor.
Fig. 5
Fig. 5. Single-cell RNA sequencing reveals dysregulated B-cell development.
(A) Leiden clustering of pooled Hem1+/+ and Hem1-/- spleen cells identifies major leukocyte subsets. Cell clustering of single cell data using pseudo-timeline analysis. Major cell types are shown in different colors. (B) Expression levels of marker genes for identifying hotspots of clustering. (C) Cellular density map identifying 3 main B-cell (1a, 1b, 1c) and 4 main T-cell clusters (0a,0b,0c,0d) (yellow: high density area, blue low-density area). (D) Top genes identified through differential expression analysis for high density B-cell sub-clusters (1a, 1b and 1c) are shown for Hem1+/+ and Hem1-/-. (E) Cell density maps over time, in 5 versus 10-week-old mice depicting substantial differences in B-cell subclusters in 5-week vs. 10-week-old Hem1+/+ and Hem1-/- mice (red: high density area, yellow: low density area, grey: no cells).
Fig. 6
Fig. 6. Defective B-cell intrinsic survival in murine Hem1-/- B cells.
(A) Scheme for the transplantation experiment, mixed bone marrow chimeras of JHT and Hem1-/- vs. Hem1+/+ bone marrow were transplanted into sub-lethally irradiated Bl6 mice (Hem1+/+). Control groups consisted of mice receiving Hem1+/+ or Hem1-/- bone marrow (shown in white and gray dots). The 4 transplanted grouped are depicted in the Figure. (B) Body weight of the 4 different groups of transplanted mice at the termination point of experiment (12 weeks). (C) Kaplan-Meier survival curve of bone marrow chimera experiment (C57BL/6J mice with mixed JHT and WT BM (4:1) and C57BL/6J mice with mixed JHT and KO BM (4:1). (D) Absolute number of LSK (left) and progenitor cells (right) in transplanted mice with JHT-Hem1+/+ and JHT-Hem1-/- chimeras and control groups. (E) Absolute number of immature (left) and mature (right) B cells in the bone marrow of transplanted mice. (F) Absolute number of blood B220+ B cells in transplanted mice with JHT-Hem1+/+ and JHT-Hem1-/- chimeras and the control groups. (G) Absolute number of neutrophils in blood of transplanted mice with JHT-Hem1+/+ and JHT-Hem1-/- chimeras and the control groups (left). Absolute number of blood Ly6Chi monocytes of JHT-Hem1+/+ and JHT-Hem1-/- chimeras and the control groups (right). BMT, bone marrow transplantation.
Fig. 7
Fig. 7. Disrupted BCR signaling in HEM1 deficiency.
(A) Healthy donor (top) and patient (bottom) B cells following IgM stimulation using a planar-supported lipid bilayer functionalized with a monovalent streptavidin platform presenting biotinylated and abSTAR635P-conjugated MHM-88 mAbs, transmission light, TL (left), Interference Reflection Microscopy, IRM (middle) and IgM (right). Scale bar: 5μM. (B) Area of IgM (abSTAR635P)/μm2 over time illustrates accumulation of IgM at the immune synapse. (C) Integrated density of IgM [Arbitrary Unit (AU)] over time illustrates intensity of IgM at the immune synapse (HD1-dark blue, patient 1 (light blue) (D) Representative EBV-LCL transformed B-cells Western blots of P1, P2 and 2 healthy donors of pAKT (Ser473) and total AKT including ratios of phospho/total AKT by IgM, fibronectin and ICAM1 stimulation. (E) Immunofluorescence staining of patient and healthy donor-derived primary B cells for Foxo1 and DAPI following IgM stimulation illustrating increased levels of Foxo1 in the nucleus of P1. Quantification of nuclear/cytoplasmic ratio of both P1 and p2 (pooled) and two healthy donors. The yellow line indicates the nuclear border, intensity map (left). (F) Representative graphs for Foxo1 target genes regulating cell cycle progression (Rbl2, Cdk1, Cdknlb, Myc), DNA damage (Ddb1) and apoptosis (Bcl6, Bcl2lll, Batf). (G) Scheme illustrating proposed mechanism.

References

    1. Moulding DA, Record J, Malinova D, Thrasher AJ. Actin cytoskeletal defects in immunodeficiency. Immunol Rev. 2013;256:282–99. - PMC - PubMed
    1. Kahr WHA, Pluthero FG, Elkadri A, Warner N, Drobac M, Chen CH, Lo RW, Li L, Li R, Li Q, Thoeni C, et al. Loss of the Arp2/3 complex component ARPC1B causes platelet abnormalities and predisposes to inflammatory disease. Nat Commun. 2017;8:14816. - PMC - PubMed
    1. Lanzi G, Moratto D, Vairo D, Masneri S, Delmonte O, Paganini T, Parolini S, Tabellini G, Mazza C, Savoldi G, Montin D, et al. A novel primary human immunodeficiency due to deficiency in the WASPinteracting protein WIP. J Exp Med. 2012;209:29–34. - PMC - PubMed
    1. Suetsugu S, Miki H, Takenawa T. Identification of Two Human WAVE/SCAR Homologues as General Actin Regulatory Molecules Which Associate with the Arp2/3 Complex. Biochem Biophys Research Commun. 1999;260:296–302. - PubMed
    1. Campellone KG, Welch MD. A nucleator arms race: cellular control of actin assembly. Nat Rev Mol Cell Biol. 2010;11:237–251. - PMC - PubMed

Publication types