

Voxelwise and Patientwise Correlation of 18F-FDOPA PET, Relative Cerebral Blood Volume, and Apparent Diffusion Coefficient in Treatment-Naïve Diffuse Gliomas with Different Molecular Subtypes
- PMID: 32646876
- PMCID: PMC8049346
- DOI: 10.2967/jnumed.120.247411
Voxelwise and Patientwise Correlation of 18F-FDOPA PET, Relative Cerebral Blood Volume, and Apparent Diffusion Coefficient in Treatment-Naïve Diffuse Gliomas with Different Molecular Subtypes
Abstract
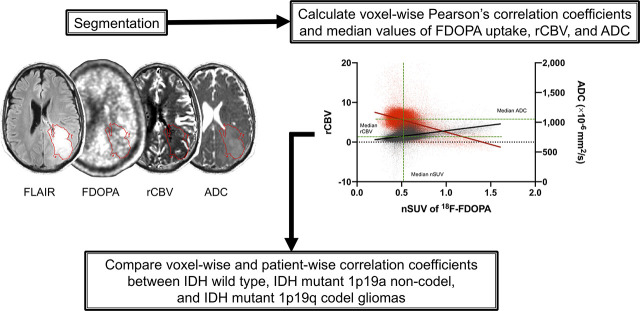
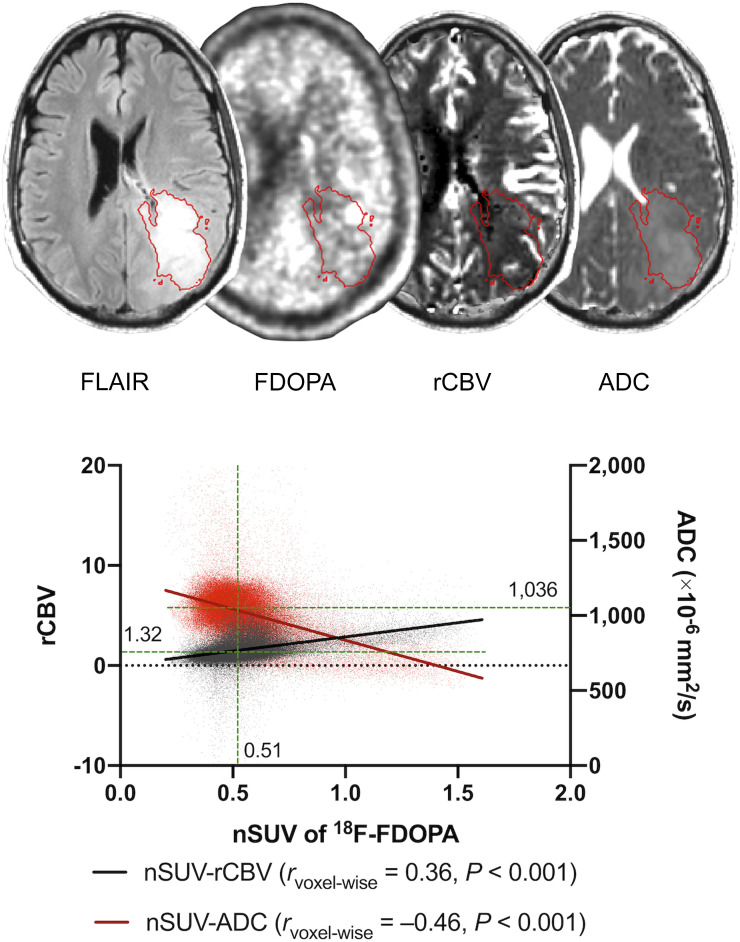
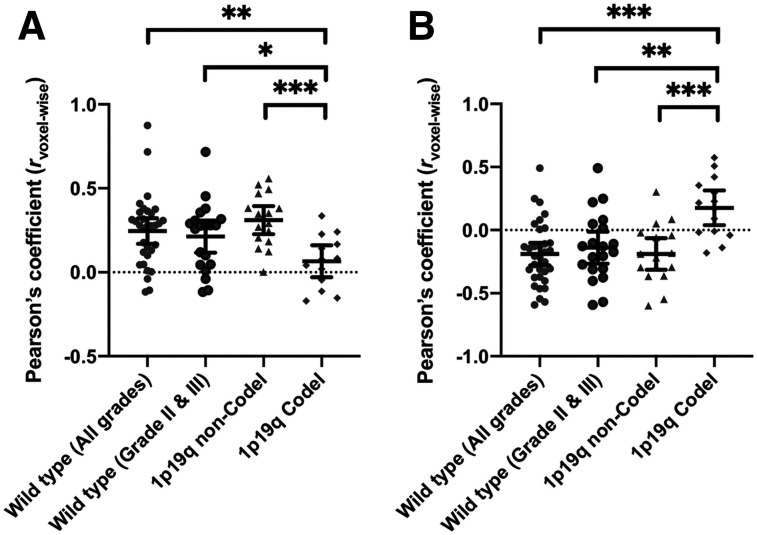
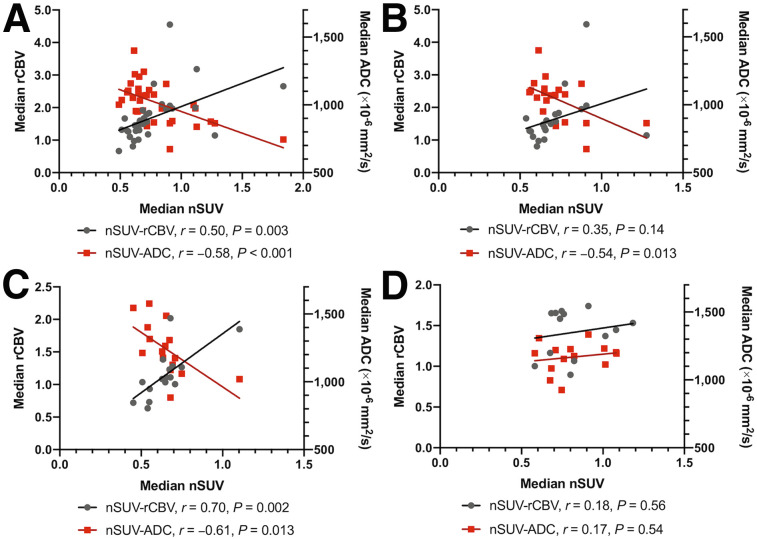
Our purpose was to identify correlations between 18F-fluorodihydroxyphenylalanine (18F-FDOPA) uptake and physiologic MRI, including relative cerebral blood volume (rCBV) and apparent diffusion coefficient (ADC), in gliomas with different molecular subtypes and to evaluate their prognostic values. Methods: Sixty-eight treatment-naïve glioma patients who underwent 18F-FDOPA PET and physiologic MRI were retrospectively selected (36 with isocitrate dehydrogenase wild-type [IDHwt], 16 with mutant 1p/19q noncodeleted [IDHm-noncodel], and 16 with mutant codeleted [IDHm-codel]). Fluid-attenuated inversion recovery hyperintense areas were segmented and used as regions of interest. For voxelwise and patientwise analyses, Pearson correlation coefficients (rvoxelwise and rpatientwise) between the normalized SUV (nSUV), rCBV, and ADC were evaluated. Cox regression analysis was performed to investigate the associations between overall survival and rvoxelwise, maximum or median nSUV, median rCBV, or median ADC. Results: For IDHwt and IDHm-noncodel gliomas, nSUV demonstrated significant positive correlations with rCBV (rvoxelwise = 0.25 and 0.31, respectively; rpatientwise = 0.50 and 0.70, respectively) and negative correlations with ADC (rvoxelwise = -0.19 and -0.19, respectively; rpatientwise = -0.58 and -0.61, respectively) in both voxelwise and patientwise analyses. IDHm-codel gliomas demonstrated a significant positive correlation between nSUV and ADC only in voxelwise analysis (rvoxelwise = 0.18). In Cox regression analysis, rvoxelwise between nSUV and rCBV (hazard ratio, 28.82) or ADC (hazard ratio, 0.085) had significant associations with overall survival for only IDHwt gliomas. Conclusion: IDHm-codel gliomas showed distinctive patterns of correlations between amino acid PET and physiologic MRI. Stronger correlations between nSUV and rCBV or ADC may result in a worse prognosis for IDHwt gliomas.
Keywords: 18F-FDOPA PET; ADC; correlation coefficient; glioma; rCBV.
© 2021 by the Society of Nuclear Medicine and Molecular Imaging.
Figures
References
-
- Galldiks N, Lohmann P, Cicone F, Langen KJ. FET and FDOPA PET imaging in glioma. In: Pope W, ed. Glioma Imaging. Springer; 2019:211–222.
-
- Deuschl C, Kirchner J, Poeppel TD, et al. 11C-MET PET/MRI for detection of recurrent glioma. Eur J Nucl Med Mol Imaging. 2018;45:593–601. - PubMed
-
- Rahm V, Boxheimer L, Bruehlmeier M, et al. Focal changes in diffusivity on apparent diffusion coefficient MR imaging and amino acid uptake on PET do not colocalize in nonenhancing low-grade gliomas. J Nucl Med. 2014;55:546–550. - PubMed