. 2020 Sep;61(9):1271-1286.
doi: 10.1194/jlr.RA120000888. Epub 2020 Jul 9.

Angiopoietin-like protein 3 governs LDL-cholesterol levels through endothelial lipase-dependent VLDL clearance

Affiliations

Angiopoietin-like protein 3 governs LDL-cholesterol levels through endothelial lipase-dependent VLDL clearance

Rene C Adam et al. J Lipid Res. 2020 Sep.

Abstract

Angiopoietin-like protein (ANGPTL)3 regulates plasma lipids by inhibiting LPL and endothelial lipase (EL). ANGPTL3 inactivation lowers LDL-C independently of the classical LDLR-mediated pathway and represents a promising therapeutic approach for individuals with homozygous familial hypercholesterolemia due to LDLR mutations. Yet, how ANGPTL3 regulates LDL-C levels is unknown. Here, we demonstrate in hyperlipidemic humans and mice that ANGPTL3 controls VLDL catabolism upstream of LDL. Using kinetic, lipidomic, and biophysical studies, we show that ANGPTL3 inhibition reduces VLDL-lipid content and size, generating remnant particles that are efficiently removed from the circulation. This suggests that ANGPTL3 inhibition lowers LDL-C by limiting LDL particle production. Mechanistically, we discovered that EL is a key mediator of ANGPTL3's novel pathway. Our experiments revealed that, although dispensable in the presence of LDLR, EL-mediated processing of VLDL becomes critical for LDLR-independent particle clearance. In the absence of EL and LDLR, ANGPTL3 inhibition perturbed VLDL catabolism, promoted accumulation of atypical remnants, and failed to reduce LDL-C. Taken together, we uncover ANGPTL3 at the helm of a novel EL-dependent pathway that lowers LDL-C in the absence of LDLR.

Keywords: atherosclerosis; cardiovascular disease; familial hypercholesterolemia; lipidomics; low density lipoprotein receptor; low density lipoprotein-cholesterol; very low density lipoprotein.


Conflict of interest statement

Conflict of interest—R.C.A., I.J.M., C.A.A-B., L.M.S., J.S.L., P.B., S.C.H., H.I.K., C.V.H., G.D.Y., A.J.M., J.G., M.W.S. and V.G. are or were employees and stockholders at Regeneron Pharmaceuticals while engaged in this study. All other authors declare that they have no conflicts of interest with the contents of this article.

Figures

Fig. 1.
Fig. 1.
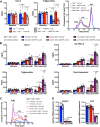
EL is necessary for the LDLR-independent LDL-C-lowering effect upon ANGPTL3 inhibition. A: Inhibition of ANGPTL3 lowers serum phospholipids in Ldlr−/− mice on chow diet 4 days after ANGPTL3 mAb or control mAb (n = 5 mice per group, 10 mg/kg mAb) (left). Mean ± SEM are shown. P-values are from unpaired two-tailed Student’s t-test. Serum lipid distribution in Ldlr−/− mice showing ANGPTL3 mAb lowers phospholipids across all lipoproteins. Pooled serum [n = 6 mice in control (Ctrl) mAb group; n = 5 mice in ANGPTL3 mAb group] was fractionated by FPLC, and phospholipid levels were measured enzymatically in each fraction (right). B: Serum PLTP activity in Ldlr−/− mice on chow diet 6 days before (baseline) and 7 days after ANGPTL3 mAb or control mAb (n = 6 mice per group, 10 mg/kg mAb). Mean ± SEM are shown. P-values are from two-way ANOVA with Sidak correction posttest relative to control. C: Serum lipid distribution of chow-fed WT (n = 10), Lipg−/− (n = 12), Ldlr−/− (n = 23), and Lipg−/−Ldlr−/− (n = 24) mice (left). Pooled serum from each group of mice was separated by HPLC, and cholesterol levels were measured enzymatically. Ratio showing VLDL and LDL APOB-particle numbers in Ldlr−/− and Lipg−/−Ldlr−/− mice (right). D: Nonfasted serum cholesterol of WT and Lipg−/− mice on chow (baseline), after 2 weeks on HFD (HFD baseline), and 6 days after ANGPTL3 or control mAb dose (25 mg/kg) while on HFD. Mean ± SEM are shown (n = 15 mice in WT Ctrl mAb group, n = 16 mice in all other groups). P-values are from two-way ANOVA with Tukey correction posttest. E: Nonfasted serum lipids of Ldlr−/− and Lipg−/−Ldlr−/− mice on chow diet before (baseline, day −6) and 7 days after ANGPTL3 or control mAb-dose (10 mg/kg). Mean ± SEM are shown (n = 14 mice in each Ldlr−/− group, n = 17 mice in Lipg−/−Ldlr−/− Ctrl mAb group, n = 18 mice in Lipg−/−Ldlr−/− ANGPTL3 mAb group). P-values are from two-way ANOVA with Sidak correction posttest.
Fig. 2.
Fig. 2.
Lipidomic analysis reveals the impact of EL on LDL composition. A: Sample preparation for lipidomic analysis. Serum of chow-fed Ldlr−/− and Lipg−/−Ldlr−/− individual mice was collected 7 days after mAb administration and subjected to FPLC analysis to separate lipoproteins. Fractions corresponding to VLDL/LDL/HDL were pooled and snap-frozen for subsequent metabolite extraction. B: Score scatter plot (unsupervised PCA) showing clustering of lipidomics samples depending on lipoprotein species. Model diagnostics: A = 6; R2X = 0.872; Q2X = 0.813. C: Heatmap representing individual metabolites (denoted on the left side) obtained for the comparisons performed in LDL samples (n = 8 mice per group). Heatmap color codes for log2 (fold-change) and unpaired two-tailed Student’s t-test P-values are indicated at the bottom. D: Boxplots (defined in the Materials and Methods) of LDL-lipids upon ANGPTL3 mAb or isotype control. P-values are from unpaired two-tailed Student’s t-test. E: Volcano plots showing impact of ANGPTL3 inhibition on LDL in Ldlr−/− and Lipg−/−Ldlr−/− mice. All mice were on chow diet. See also lipidomics data in supplemental Table S3.
Fig. 3.
Fig. 3.
EL promotes VLDL catabolism and APOB particle reduction. A: Heatmap of lipidomics analysis, from the study outlined in Fig. 2, representing individual metabolites (denoted on the left side) obtained for the comparisons performed in VLDL samples (n = 8 mice per group). Heatmap color codes for log2 (fold-change) and unpaired two-tailed Student’s t-test P-values are indicated at the bottom. B: Boxplots (defined in the Materials and Methods) of VLDL-lipids upon ANGPTL3 mAb or control antibody treatment. P-values are from unpaired two-tailed Student’s t-test. C: Boxplots (defined in the Materials and Methods) of VLDL-PCs in Ldlr−/− and Lipg−/−Ldlr−/− mice upon ANGPTL3 inhibition. P-values are from unpaired two-tailed Student’s t-test. D: Serum APOB levels before (baseline) and 4 days after ANGPTL3 mAb administration. Mean ± SEM are shown (n = 14 mice in Ldlr−/− groups, n = 18 mice in Lipg−/−Ldlr−/− groups). P-value is from two-way ANOVA with Sidak correction posttest. E: APOB Western blot analysis. Serum of Ldlr−/− (n = 7) and Lipg−/−Ldlr−/− mice (n = 9) was collected 4 days after mAb administration, pooled, and lipoproteins were separated by FPLC. Fractions corresponding to VLDL/LDL were immunoblotted and probed with anti-APOB antibody. Densitometry quantifications are on the right. Samples were derived from the same experiment and gels/blots were processed in parallel. Full scans of Western blots are provided in the supplemental data online. All mice were on chow diet. See also lipidomics data in supplemental Table S4.
Fig. 4.
Fig. 4.
ANGPTL3 inhibition promotes VLDL processing and clearance. A: Plasma clearance kinetics of [3H]CE-labeled VLDL (left) and LDL (right) isolated from Ldlr−/− or Lipg−/−Ldlr−/− mice and injected into Ldlr−/− mice (VLDL from Ldlr−/−: n = 10 recipient mice; VLDL from Lipg−/−Ldlr−/−: n = 9 recipient mice). B: Plasma clearance kinetics of [3H]CE-labeled VLDL (left) or LDL (right) isolated from Apoe−/− mice after 2 weekly injections of ANGPTL3 mAb or control mAb and injected into Apoe−/− mice (n = 10 mice per group). A, B: The percentage of injected CE-label remaining at each timepoint was determined using the value obtained at 30 s as starting point. Mean ± SEM are shown for each timepoint. P-values from two-way ANOVA with Sidak correction posttest: *P < 0.05, **P < 0.01, ***P < 0.001, ****P < 0.001. The half-life was calculated from the decay curve of [3H]CE activity plotted against time. All mice were on chow diet. C, D: NMR analysis of human lipoproteins following ANGPTL3 inhibition with evinacumab (ANGPTL3 mAb). Hyperlipidemic individuals were administered ANGPTL3 mAb or control mAb (phase 1 single ascending dose clinical study) (28), and serum was collected at the indicated timepoints. Mean ± SEM are shown for each timepoint (n = 18 in placebo; n = 10 in 5 mg/kg iv; n = 9 in 10 mg/kg iv; n = 11 in 20 mg/kg iv; n = 12 in 150 mg sc; and n = 9 in 250 mg sc groups). Human VLDL/chylomicron and LDL concentration (C) and particle size analysis by NMR (D). P-values are from two-way ANOVA with Tukey correction posttest: *P < 0.05, **P < 0.01, ***P < 0.001, ****P < 0.0001 relative to placebo (color of asterisks indicates relevant group); #P < 0.0001 regarding all ANGPTL3 mAb groups relative to placebo; &P < 0.0001 regarding all intravenously administered ANGPTL3 mAb groups relative to placebo.
Fig. 5.
Fig. 5.
ANGPTL3 inhibition lowers LDL-C independently of several lipoprotein receptors. A: Nonfasted serum lipids of Ldlr−/− and Sdc1−/−Ldlr−/− mice on chow diet before (baseline, day −6) and 7 days after ANGPTL3 or control mAb-dose (10 mg/kg). Mean ± SEM are shown [n = 7 mice in Sdc1−/−Ldlr−/− control (Ctrl) mAb group, n = 8 mice in all other groups]. P-values are from two-way ANOVA with Sidak correction posttest. HPLC analysis shown at right. B, C: The effect of ANGPTL3 inhibition on serum lipids in ASO-mediated knockdown of Scarb1 and/or Lrp1 in Sdc1−/−Ldlr−/− mice on chow diet. Nonfasted serum was collected from Sdc1−/−Ldlr−/− mice (baseline). Scarb1, Scarb1+Lrp1, or control ASOs (25 mg/kg) were administered twice weekly by subcutaneous injections, for a total of 10 doses. Two once-weekly doses of ANGPTL3 or control mAb (10 mg/kg) were administered after first six doses of ASO (ASO pre-mAb). Seven days after the second mAb dose, serum was collected and livers were harvested (ASO, post-mAb). Mean lipid levels ± SEM are shown in B; HPLC analysis of serum is shown in C (n = 8 mice in all groups except n = 7 in Scarb1+Lrp1 ASO + ANGPTL3 mAb group). P-values are from two-way ANOVA with Sidak correction posttest. D: Hepatic knockdown efficiency upon ASO-mediated knockdown of Scarb1 and/or Lrp1 in Sdc1−/−Ldlr−/− mice, corresponding to the study shown in B and C. Mean ± SEM are shown (n = 8 mice per group except n = 7 mice in Scarb1+Lrp1 ASO + ANGPTL3 mAb group). P-values are from one-way ANOVA with Tukey correction posttest. ****P < 0.0001 for Scarb1 ASO groups or Lrp1+Scarb1 ASO groups relative to control ASO groups.
Fig. 6.
Fig. 6.
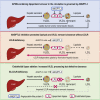
ANGPTL3 inhibition lowers LDL-C through VLDL remodeling and remnant clearance. Schematic depicting the mechanism of how ANGPTL3 inhibition lowers LDL-C. Upper panel: During homeostasis, ANGPTL3 curbs vascular lipases LPL and EL and thus regulates APOB-containing lipoprotein turnover. Middle panel: ANGPTL3 inhibition leads to derepression of both lipases, promoting VLDL remodeling and preferential removal of VLDL remnants from the circulation via redundant receptors. ANGPTL3 inhibition hence lowers LDL-C by limiting vascular LDL production. Lower panel: EL is critical in the process: without EL, LDLR-independent clearance mechanisms are perturbed, leading to accumulation of LDL particles and rendering ANGPTL3 inhibition ineffective in the reduction of LDL-C levels.

References

    1. Hegele R. A. 2009. Plasma lipoproteins: genetic influences and clinical implications. Nat. Rev. Genet. 10: 109–121. - PubMed
    1. Akyea R. K., Kai J., Qureshi N., Iyen B., and Weng S. F.. 2019. Sub-optimal cholesterol response to initiation of statins and future risk of cardiovascular disease. Heart. 105: 975–981. - PMC - PubMed
    1. Goldstein J. L., Hobbs H. H., and Brown M. S.. 2001. Familial hypercholesterolemia. In The Metabolic and Molecular Bases of Inherited Disease. 8th edition. C. R. Scriver, A. L. Beaudet, W. S. Sly, et al., editors. McGraw-Hill, Inc.; New York. 2863–2913.
    1. Kersten S. 2019. New insights into angiopoietin-like proteins in lipid metabolism and cardiovascular disease risk. Curr. Opin. Lipidol. 30: 205–211. - PubMed
    1. Romeo S., Yin W., Kozlitina J., Pennacchio L. A., Boerwinkle E., Hobbs H. H., and Cohen J. C.. 2009. Rare loss-of-function mutations in ANGPTL family members contribute to plasma triglyceride levels in humans. J. Clin. Invest. 119: 70–79. - PMC - PubMed